Category: Analysis

Get in-depth analysis and expert insights on the latest trends, market data, and emerging technologies. Stay informed with detailed evaluations and comprehensive breakdowns.

  • Crypto Analysis 24/05: BTC, ETH, BNB, SOL, XRP, DOGE, TON

    Crypto Analysis 24/05: BTC, ETH, BNB, SOL, XRP, DOGE, TON

    ETH has been the center of attention in the last seven days. Following several months of uncertainty, the US Security and Exchange Commission finally approved a spot ETF.

    In the days leading up to the approval, the regulators quelled the uncertainties by contacting filers to update their request, increasing odds from 25% to 75%. The market responded with massive surges as several assets reclaimed their 2024 highs. It also gained almost 5% in 24 hours.

    Ethereum products like PEPE and FLOKI  surged to their peak as the first registered a new all-time high. Aside from these ETH products, BONK gained a whopping 20% as it surged past its two-month high.

    The past seven days were some of the most profitable for the crypto market. Let’s see how the top 10s performed

    BTC/USD

    Bitcoin is up by over 2% in the last seven days. The apex coin is experiencing significant downtrends the massive surge it had on May 20. It peaked at $71,500 after starting the day at $66,255. It also ended the session with gains exceeding 7%.
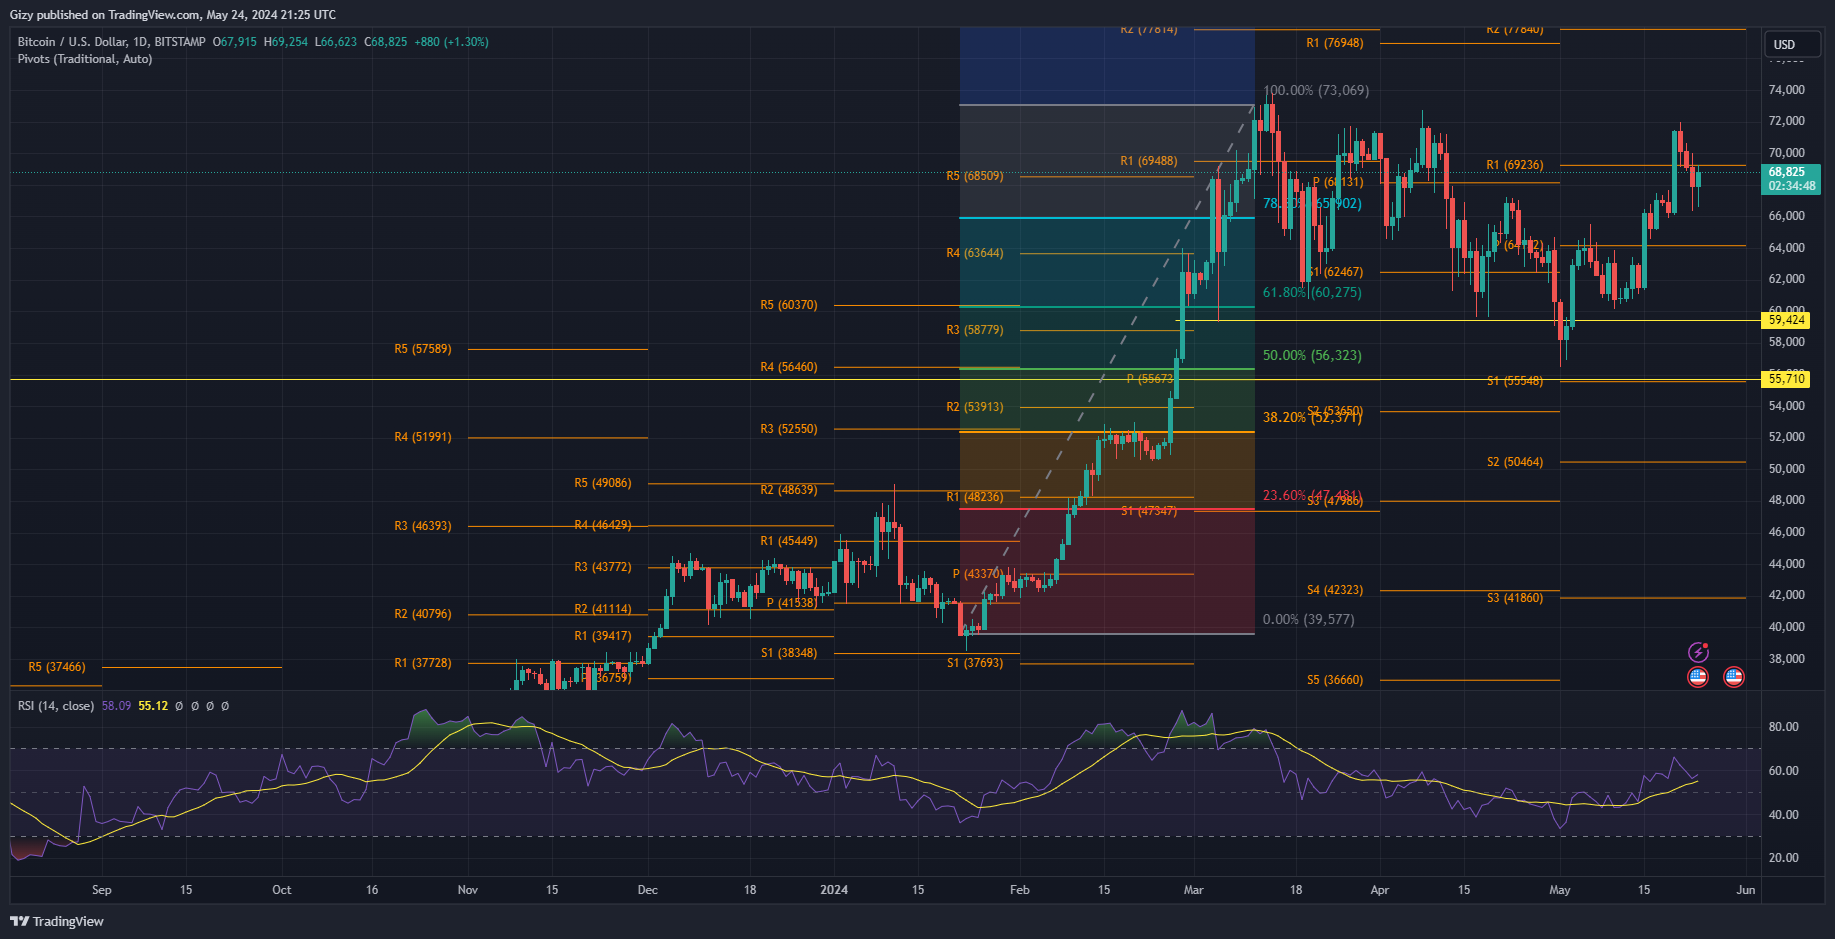
    Currently printing green candle, this is the first such cand as it registered significant declines over the last three days. During this period, the coin lost almost 5% as it gradually lost levels it attained during the previous hike. It dropped to the lowest mark on May 23 as it rebounded at $66,600.

    A few hours ago, the asset dropped to this level again. Nonetheless, as with the previous day, it rebounded and is edging towards $69k.

    The $67k mark is losing its value as many analysts previously predicted that it was critical for an attempt at $70k. However, the $66k support has remained instrumental in maintaining the momentum to retest the highlighted resistance.

    The Fibonacci retracement points to the continuation of the two-day trend as the highlighted support is close to the 78% Fib level. This means there is notable demand concentration there.

    Nonetheless, BTC is trading at $68,921, which shows it is edging towards its first pivot resistance at $69,200. A decisive flip will see the cryptocurrency surge above $70k before the week ends.

    ETH/USD

    May 20 saw Ethereum attempt its 2024 high. In a massive surge, it gained a whopping 19% as it climbed from $3,070 to a high of $3,695. During the rally, it climbed above several pivot levels. One such is the pivot point, which served as resistance for over fourteen days before the hike. The first pivot resistance is another critical level that broke.
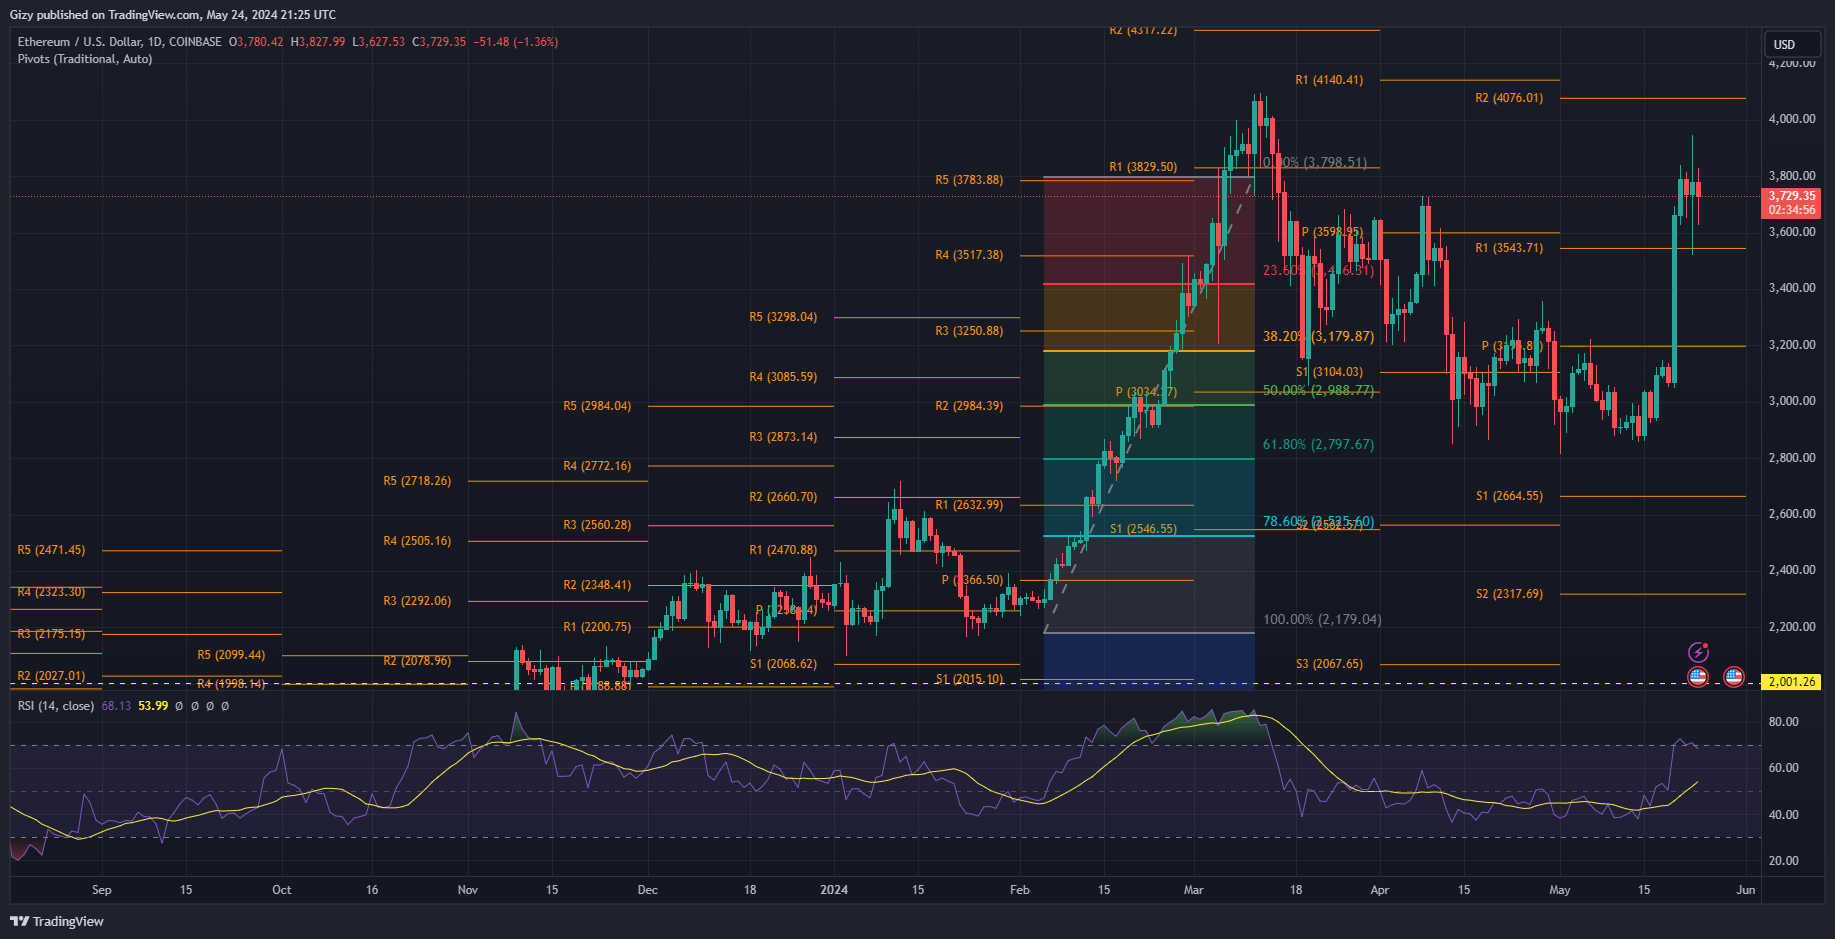
    Since climbing above these levels, the coin has maintained trading above them. Nonetheless, during the previous intraday session, it slipped below them. Following its failed attempt at $k, it dropped to $3,521 and peaked at $3,947.

    Currently printing a red candle, the asset is recovering from a drop to $3,700 and is yet to fully achieve this bid. However, the most recent trend is the opposite of what many expected, as the ETH ETF got its approval during the previous intraday session. The surges they anticipated never came as the altcoin is struggling to gain stability above $3,800.

    Nonetheless, the relative strength index suggests further price declines. At 68, it is falling below 70 for the first time in almost four days. This will mean a drop below $3,500 may take place in the coming days.

    BNB/USD

    Binance coin is on the downtrend and has yet to recover. Nonetheless, May 20 and 21 were some of the most bullish periods of the last seven days. It gained over 7% as it peaked at $631 after bouncing off its pivot point at $574.
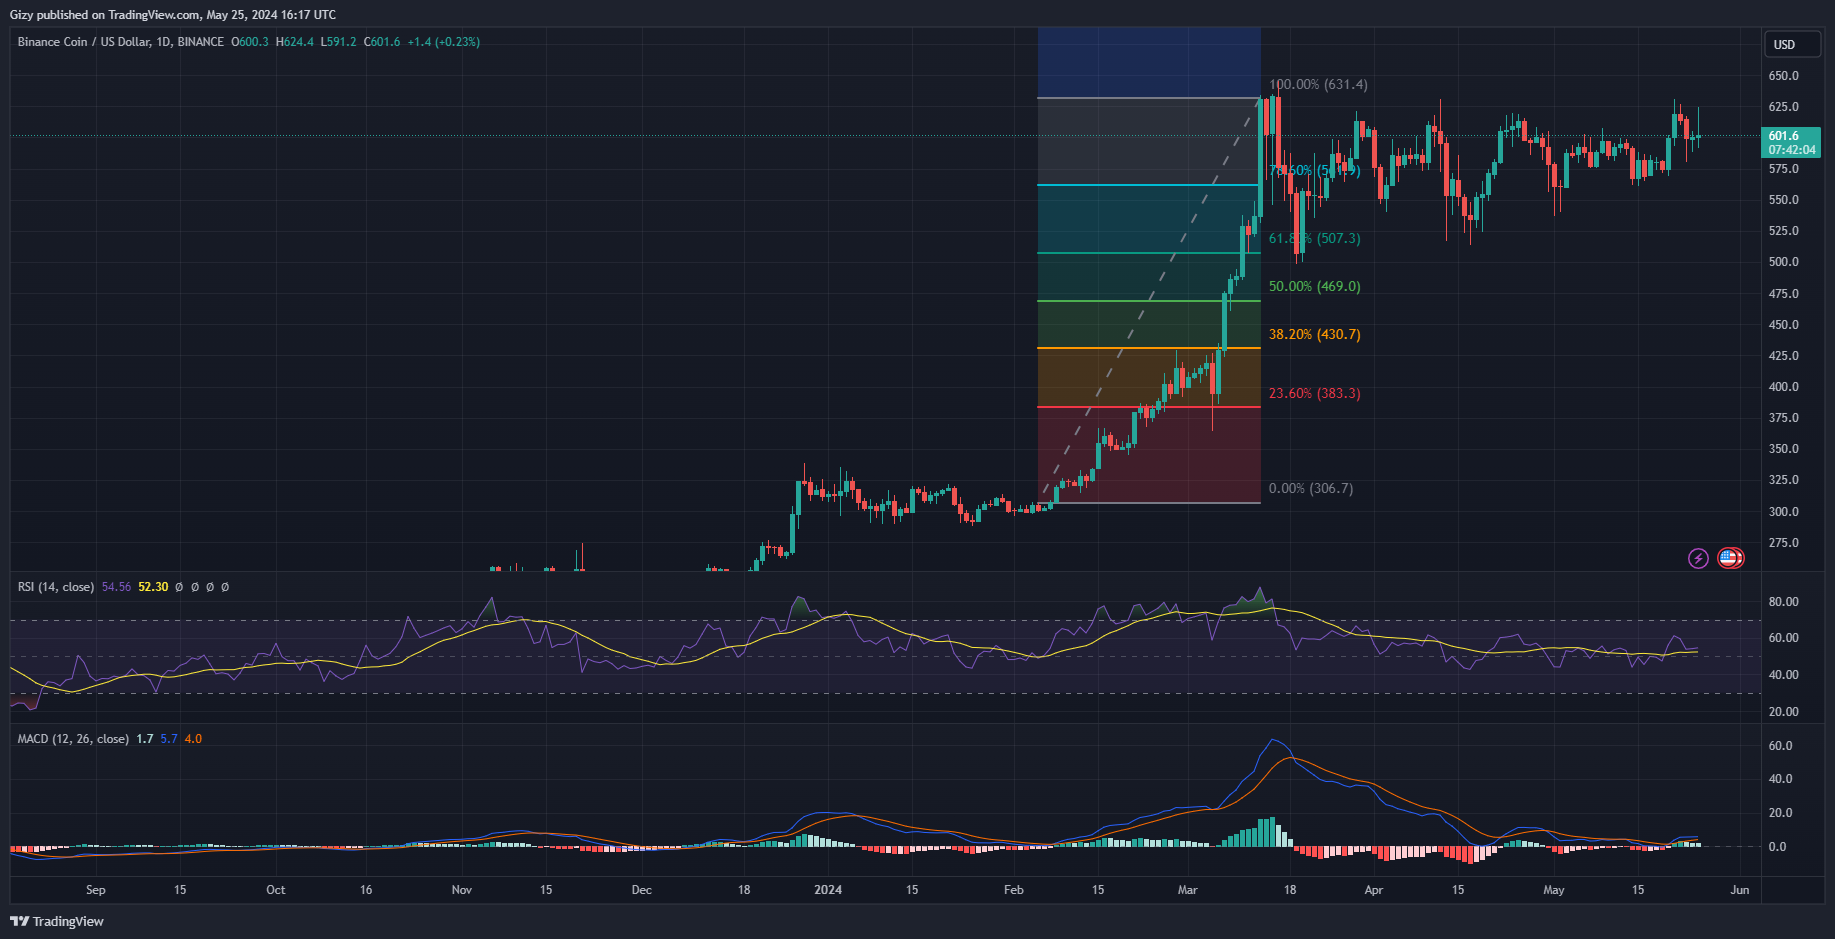
    It edged close to retesting this level during the previous intraday session. It dropped to a low of $580 but recovered and closed at $599, recording losses of over 2%. It is currently printing a doji as the bulls attempt to halt the downtrend it experienced during the last two days.

    Nonetheless, price movements suggest a retest of the pivot point in the coming days. This comes as price movements remain flat in the past 24 hours. Additionally, the relative strength index halted its descent and is currently trending in an almost straight line. This illustrated an equal pressure between the buying and selling pressure.

    The 12-day EMA is also moving in the same pattern as RSI. Additionally, the 26-day EMA is on an uptrend which suggests an impending bearish convergence if the trend continues. This may lead to BNB retesting its 50-day exponential moving average.

    SOL/USD

    The current candle shows that Solana bulls are staging a buyback. However, it appears unsuccessful as it has yet to register any significant price improvement. As a result, it is printing a doji. Additionally, RSI halted its decline in response to the latest attempt.
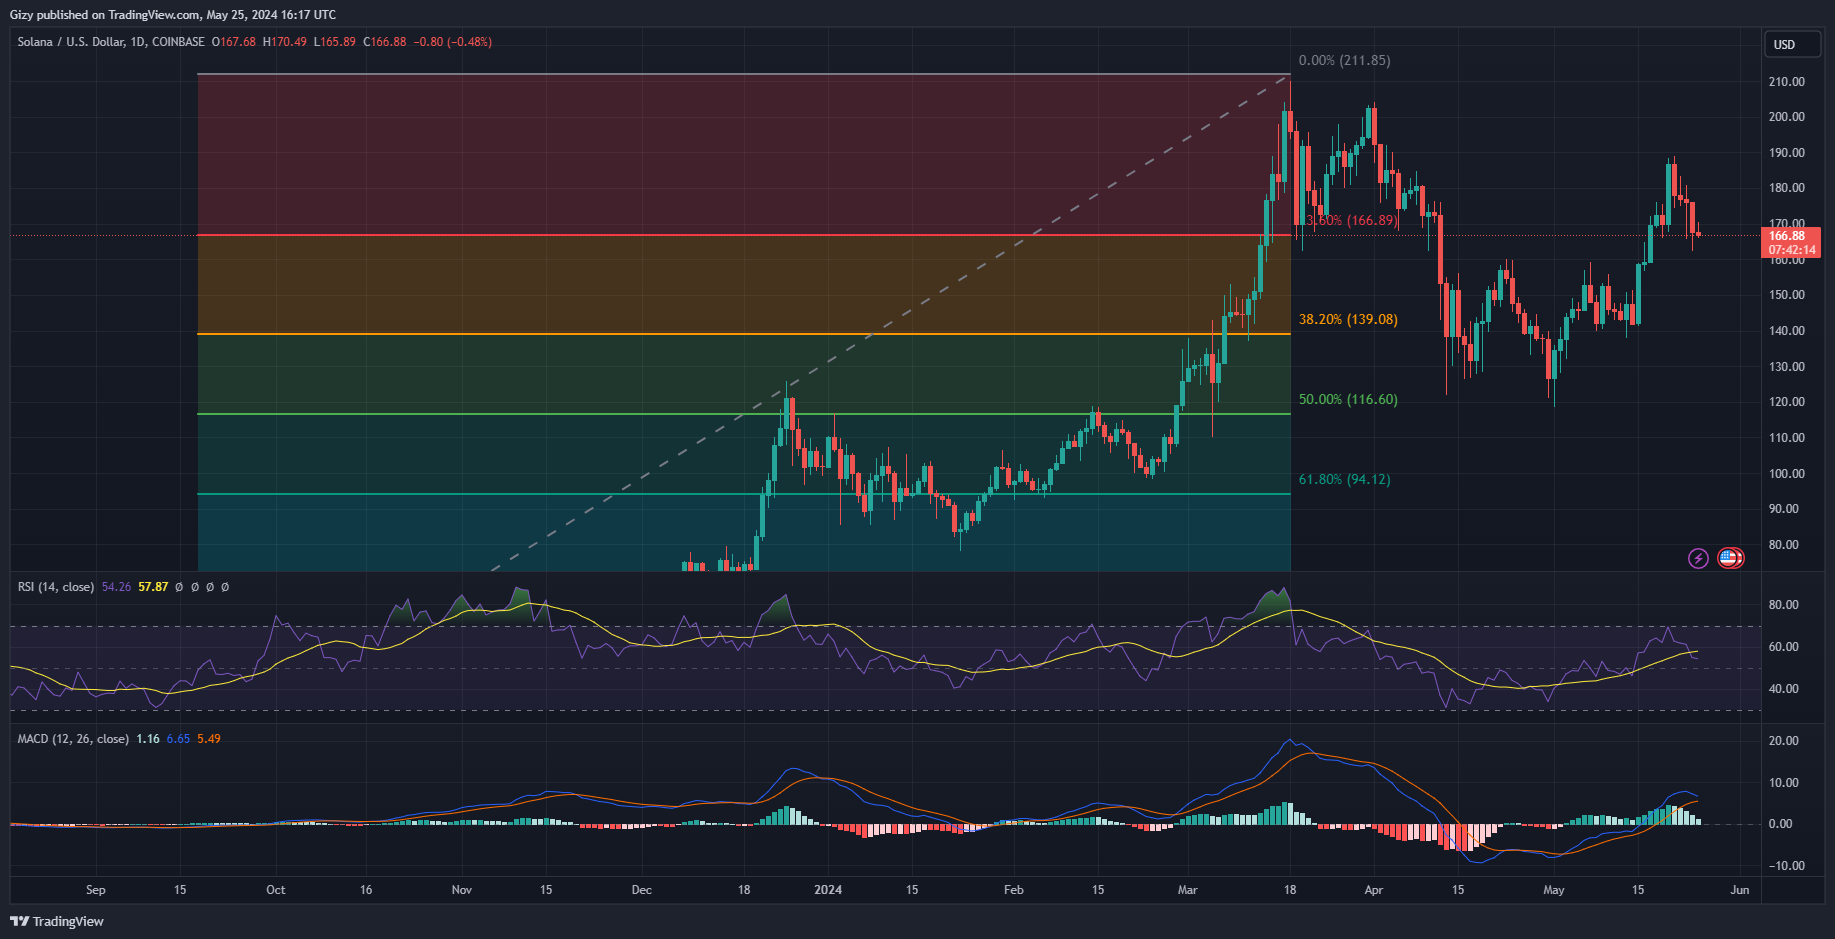
    The most recent price movement is an improvement from the last four days as the asset will likely register its first green. The previous intraday session was the worst of the period as it registered one of its biggest dips. It lost almost 5% as it retraced to a low of $162.

    The move brought it close to breaking the $160 support and testing the 50-day EMA at $157. Nonetheless, RSI points to the possible reasons for the latest decline. A few days ago, the metric surged to 70 which meant it was seeing maximum buying pressure. Further uptrends would make the asset overbought. It also meant that the asset was due for corrections.

    The moving average convergence divergence indicates further downtrends. The 12-day EMA is on the decline and will intercept the 26-day EMA in bearish convergence. This will mean a drop below the 50-day  EMA is almost inevitable.

    Currently trading close to the 23% Fib level, it will lose the mark. The next critical level to watch is the 38% Fib mark at $140.

    XRP/USD

    XRP is looking to continue its growing uptrend.  A green close on May 25 will mark the third consecutive day with minute price improvement. Currently displaying one of the tiniest candles on the chart, the asset is holding on to $0.53.
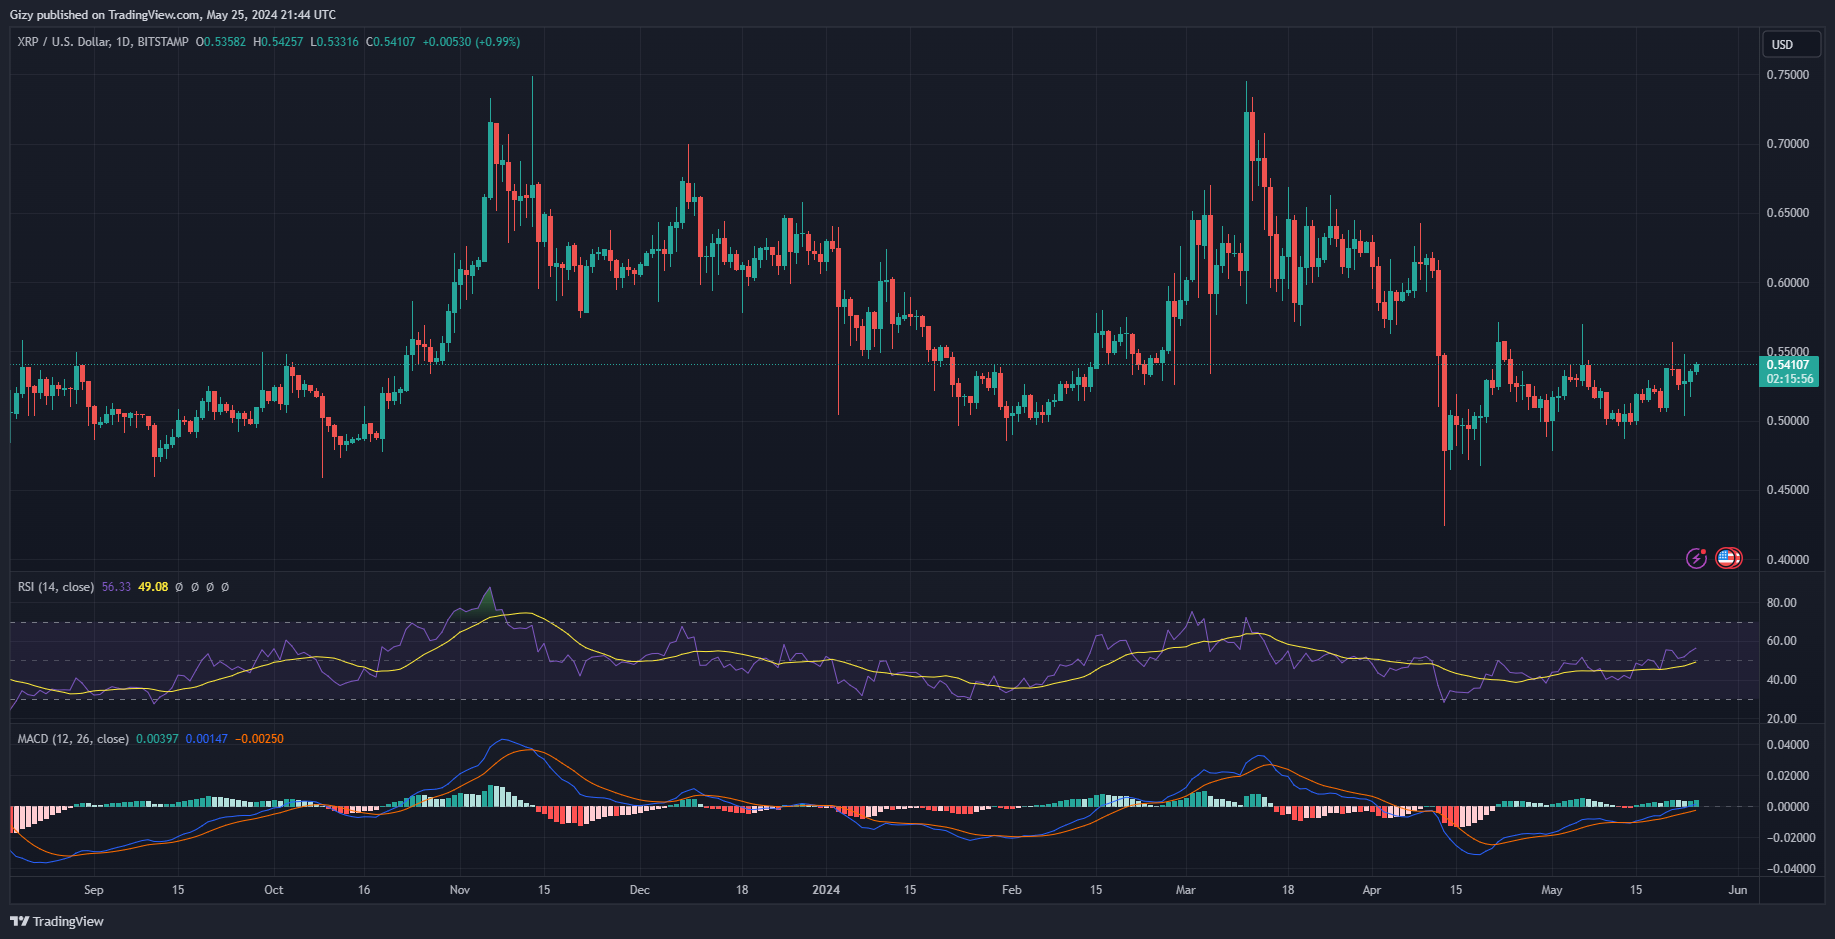
    Nonetheless, since May 2, it has struggled to keep prices above $0.52. It enjoyed surges that saw it close with gains of more than 5%. It is worth noting that two days ago, the coin retraced to retest the $0.50 support but rebounded.

    The current price trajectory suggests that the asset will test $0.55 if the uptrend continues. It will continue to hold on to the pivot point at $0.52.

    The relative strength index is at 55 which places the bulls at an advantage. Additionally, it is on an uptrend which indicates growing buying pressure. Nonetheless, the accumulation and distribution chart suggests a gradual drop in trading volume.

    Additionally, the moving average convergence divergence is silent following the bullish divergence a week ago. Both the 12-day and 26-day EMA are on the uptrend which tells that XRP is maintaining its bullish posture.

    DOGE/USD

    Dogecoin is seeing significant price changes at the time of writing. It is up by almost 4% as it edged closer to testing its seven-day high.
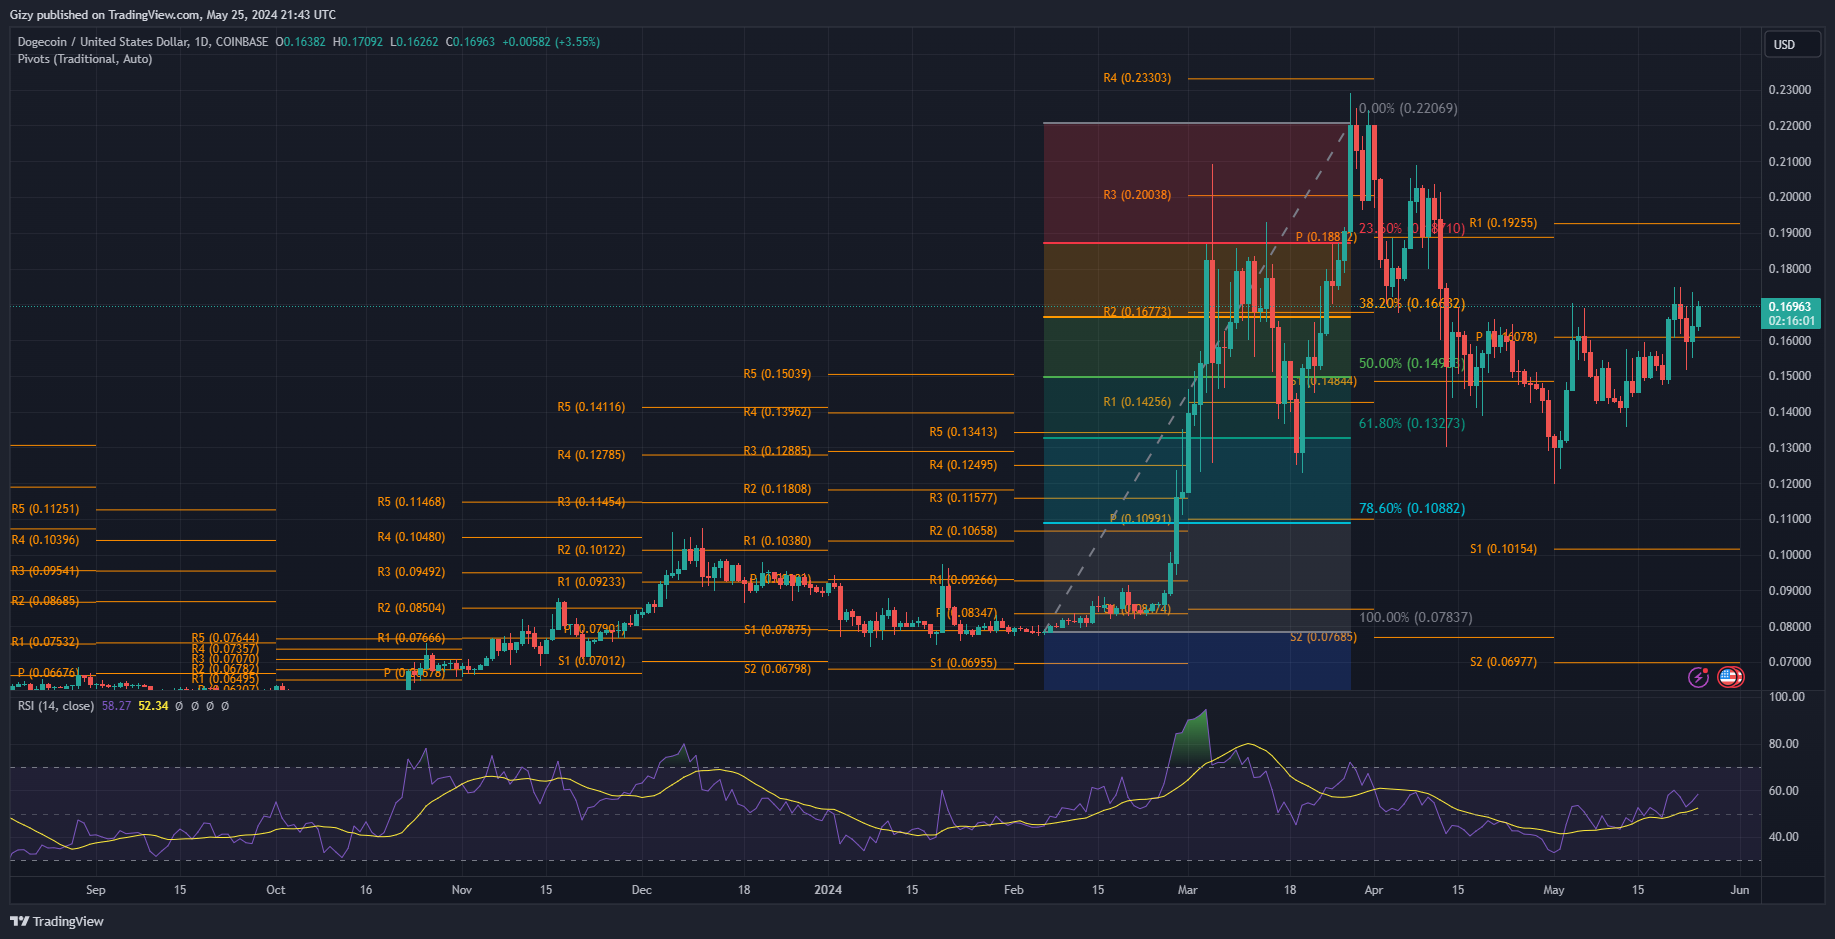
    The most recent hike is a continuation of the previous day’s surge. It peaked at $0.173 and retraced to a low of $0.155. Nonetheless, it closed with gains of almost 3%. The current day’s increase confirms the coin’s U-turn from its downtrend.

    RSI resumed its uptrend following the increase in buying volume. The change comes amidst the massive decline in trading volume. The volume dropped by 53% in the last 24 hours. Currently at 58, the bulls are at an advantage.

    Nonetheless, MACD is also on the uptrend. It continues its buy signals as the 12-day and the 26-day EMA are still on the uptrend. The gap between the two metrics grew wider in response to the previous 48-hour trend.

    Currently trading above the 38% Fibonacci retracement level at $0.166, the bulls will look to defend the mark and continue the uptrend. The mark is close to the pivot point. However, a change in market trajectory could send the token as low as low as the 50% Fib level at $0.15

  • Top Five Cryptocurrencies to Watch This Week (May 13)

    Top Five Cryptocurrencies to Watch This Week (May 13)

    Most cryptocurrencies have seen significant price declines over the last 24 hours. As a result, the global cryptocurrency market cap is down by over 2% in the last 24 hours, compared to less than 4% in the previous seven days.

    The latest decline comes amid reports of Gamestop’s massive rallies. Following the hike in stock value, GME traded for $80 per share in the early hours of May 14. This sparked speculation about whether this is a sign the alt-season is arriving soon.

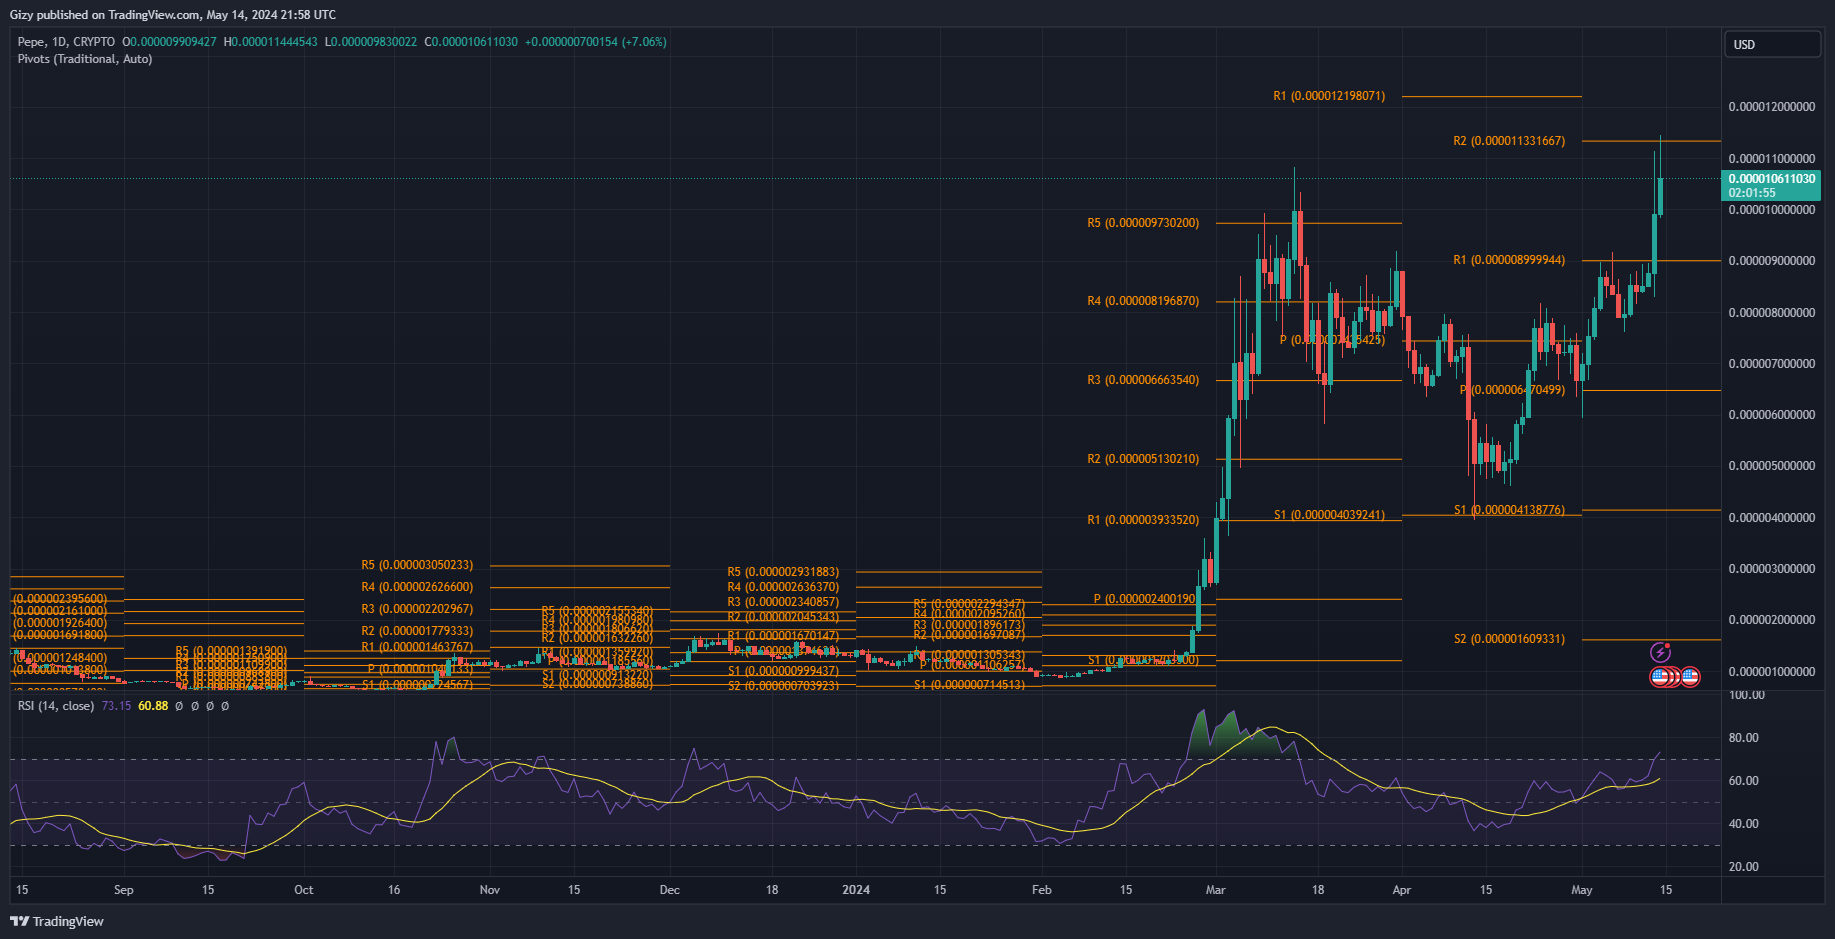
    Pepe’s latest run further supports this claim. It is up by over 21% on the weekly scale, having attained a new ATH a few hours ago.

    However, the most recent surge in some altcoins did not affect major coins in the top 10. Will they pick up?

    Top five Cryptocurrencies to Watch

    1. Bitcoin (BTC)

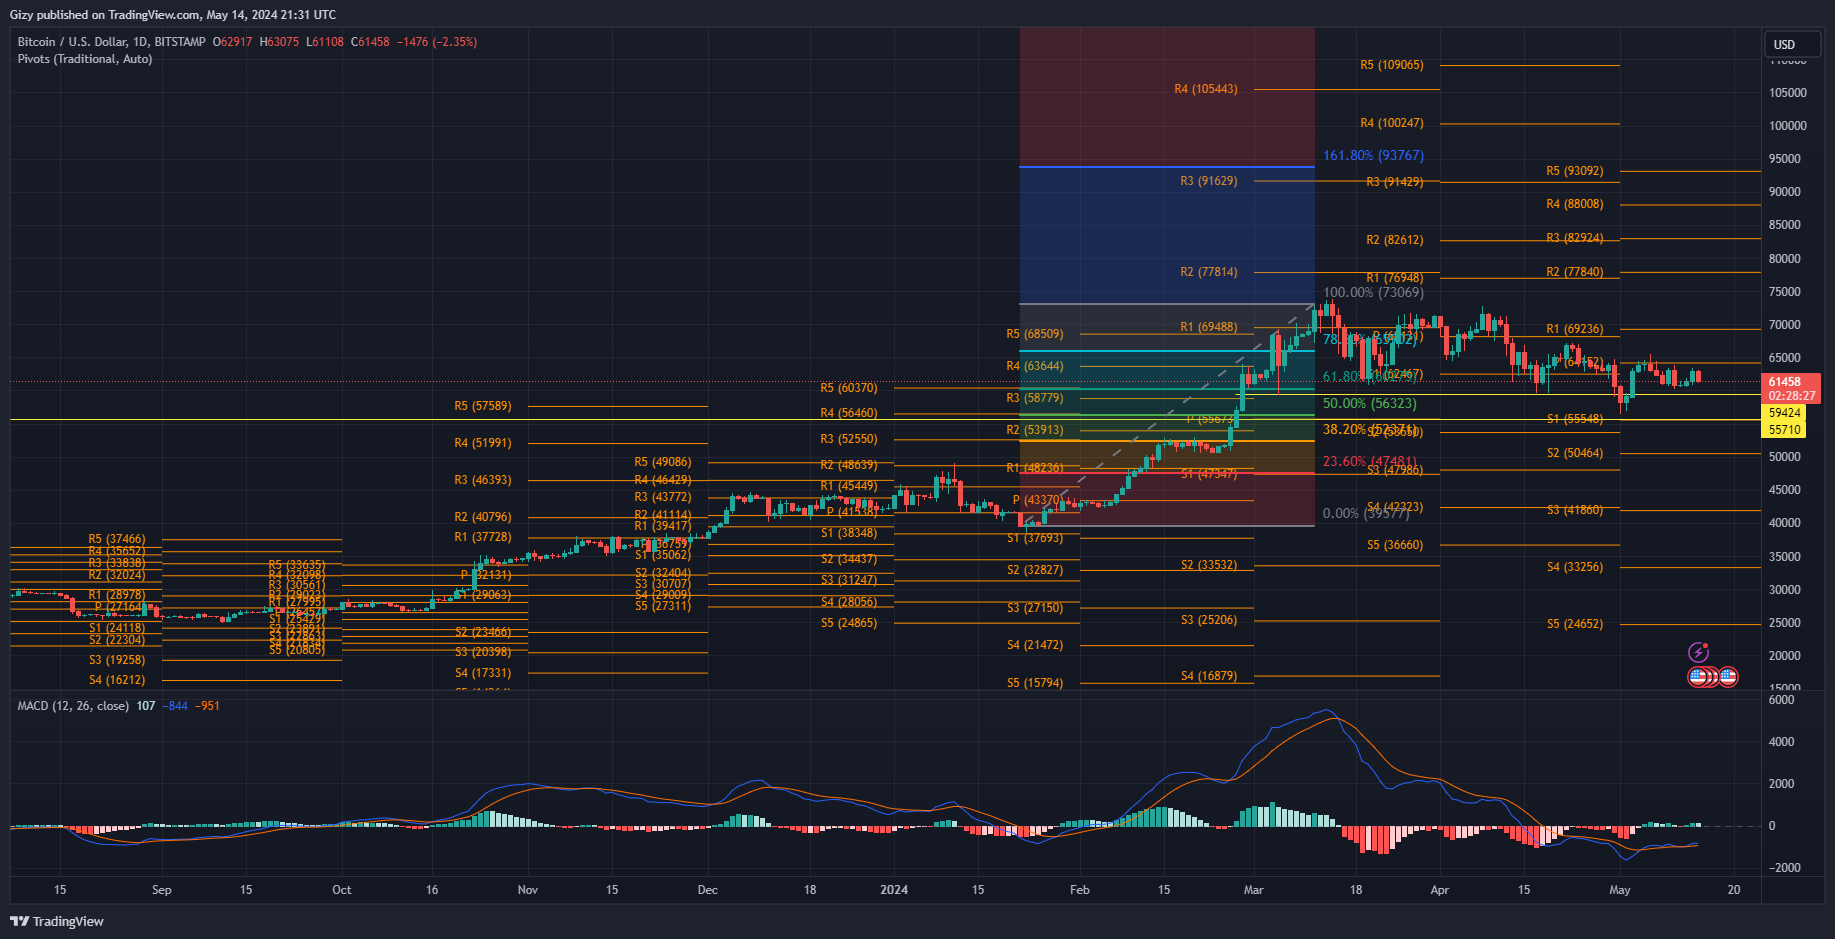
    Bitcoin is edging closer to testing its seven-day support at $60,500. The latest move shows the apex coin lost all the gains it had accumulated during the previous intraday session. The gains came amidst fresh endorsements from two US senators.

    Due to this, it is yet to register any notable price changes on the weekly scale. It is also printing a doji in response to the most recent trend. With the pattern of closing lower than it started the week, BTC will retest $60k.

    Nonetheless, the mark held out following several attempts within the last seven days. The price mark is also close to the 61% Fibonacci retracement level, which many expect rebounds at following a significant dip.

    The bulls will also look to restart the uptrend. They will look to reclaim stability above $65k, as many analysts suggest that this is the make-or-break level for the top asset. The apex coin must decisively flip the pivot point at $64k.

    However, the moving average convergence divergence indicates a further price decline. The 12-day EMA has halted its ascent and may start downhill as the coin loses momentum and buying volume. If this happens, the bears will eye a decline to $59k.

    2. Pepe (PEPE)

    PEPE surged to a new ATH barely 24 hours after the previous one. During the previous intraday session, it started trading at $0.0000087 but peaked at $0.0000111, the all-time high as of May 13. Following the milestone, several traders took profit. As a result, the asset ended the day with less than half its total profit.

    The same trend took place during the current session, as the token surged to a new ATH. It went less than 3% higher as it climbed above its second pivot resistance at $0.0000113. As with the previous day, traders took profit, and speculation of the asset’s next price action differs greatly as uncertainty grows.

    Nonetheless, if the bullish trend continues, the bulls will look to retest the second PR. Flipping it decisively will result in the PEPE surging as high as $0.000012. MACD points to this possibility as the indicator 12-day EMA continues its uptrend.

    However, the relative strength index is blaring warnings. Due to the recent bullish move, the asset has been overbought as it has crossed 70. This means the coin will experience notable corrections in the coming days.

    If the bearish reading plays out, the token will sink as low as the first pivot resistance at $0.0000089. The bulls must defend this level, as failure will result in a drop to $0.0000080.

    3. Render (RNDR)

    Render is currently seeing one of the biggest corrections in weeks. It is struggling to keep its price above it seven-day support at $9.90. Nonetheless, it is experiencing significant demand concentration at the first pivot resistance.

    Nonetheless, the most recent price movements are the opposite of what the asset had during the previous intraday session. It gained almost 4% compared to the more than 10% loss during the present intraday session.

    In response to the most recent change in trend, MACD is printing sell signals. The 12-day EMA halted its uptrend. It’s lightly arched downwards and will start going downhill if selling pressure continues. This will result in the start of a bearish convergence. Additionally, RSI is at 54 after dropping from 67 in less than 24 hours as selling pressure mounts.

    Currently trading above the 50-day EMA, a further price decline will see the asset retest this critical metric. It could also drop to $9.30 after it loses its current support at $9.90.

    On the other hand, the bulls will attempt buyback. The next target may be the second pivot resistance at $12. Nonetheless, the asset must gain stability above $11 to achieve this feat.

    4. Floki Inu (FLOKI)

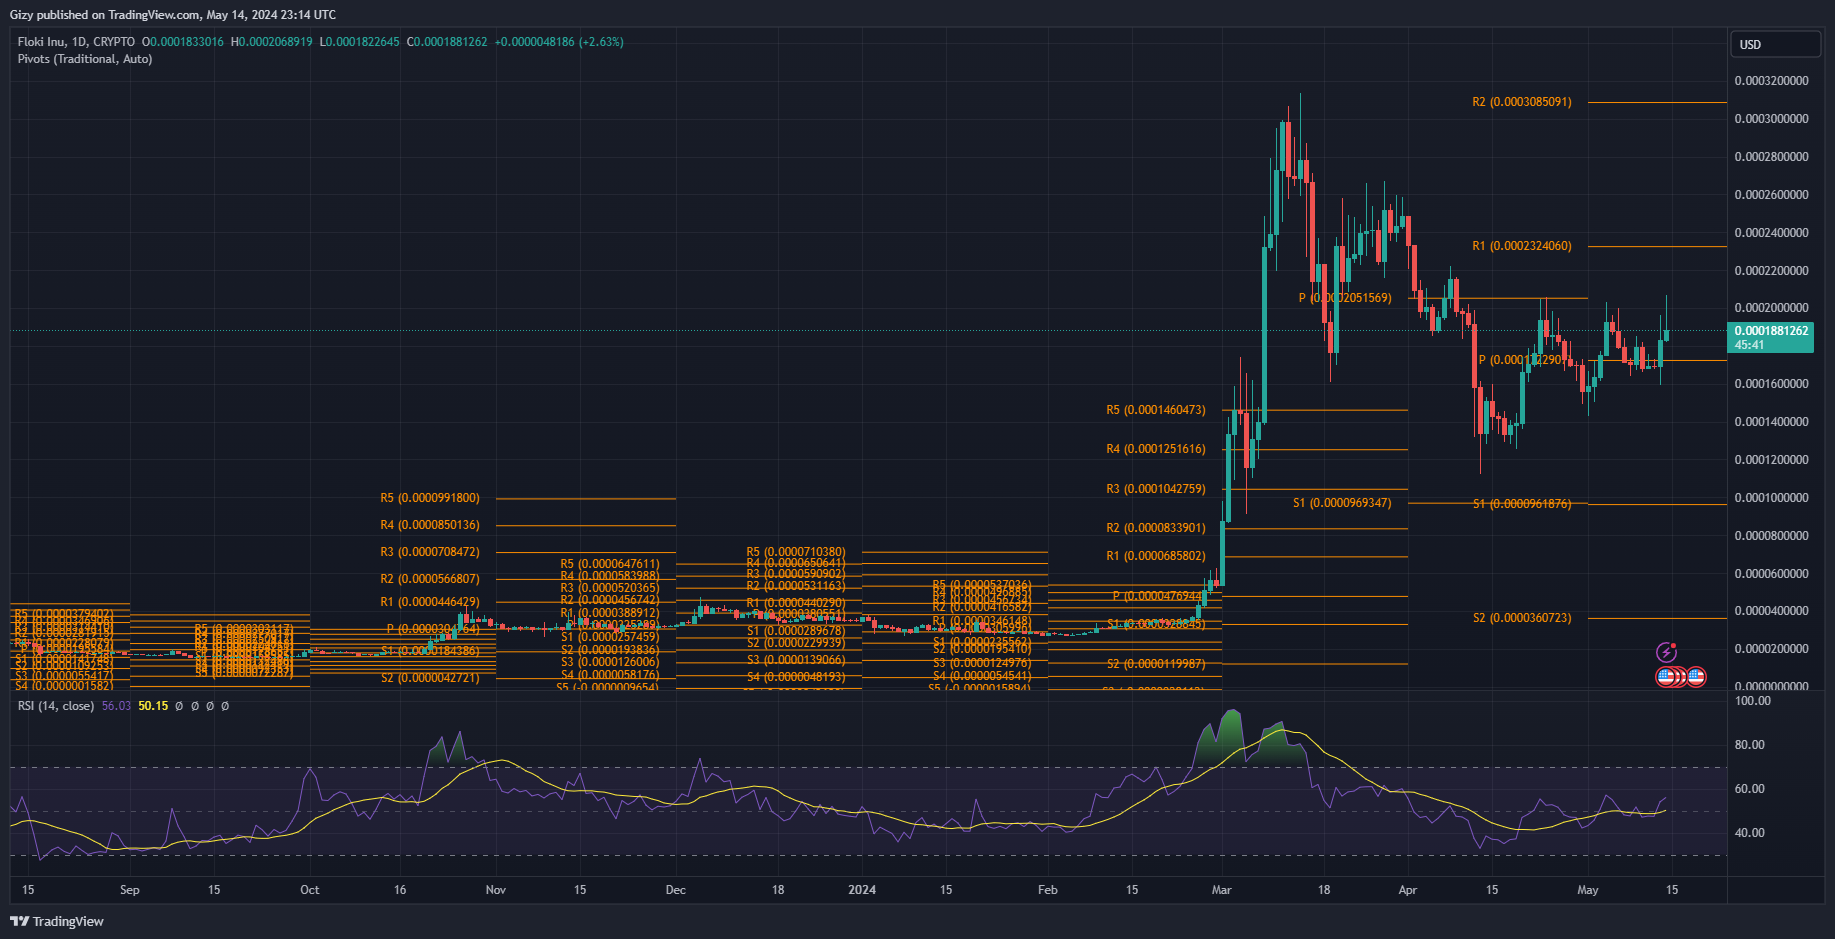
    Floki is also seeing a significant change in value in the last seven days. It gradually attained its seven-day high during the previous intraday session as it started trading at $0.00016 and surged to $0.00019. It faced massive corrections at the mark afterward and ended the day with gains of over 8%.

    It attained a new high during the current session. The Ethereum token peaked at $0.00020 but is trading at $0.00019, which signifies gains of over 3%. The latest surge also marks an over 10% increase on the weekly scale.

    Nonetheless, in response to the most recent surges, the relative strength index is on the rise. It is at 56 which places the bulls at an advantage and hints at further price increases.

    In the same vein, MACD is printing buy signals. The 12-day EMA is on the uptrend following a close bearish divergence. The latest change in trajectory comes amidst the growing buying pressure the asset is seeing.

    With the bearish readings from these indicators, Floki will continue to trade above its pivot point at $0.00017. It will edge to retest the first pivot resistance at $0.00023. To attain this, the asset must gain stability above its seven-day resistance at $0.00020.

    5. Worldcoin (WLD)

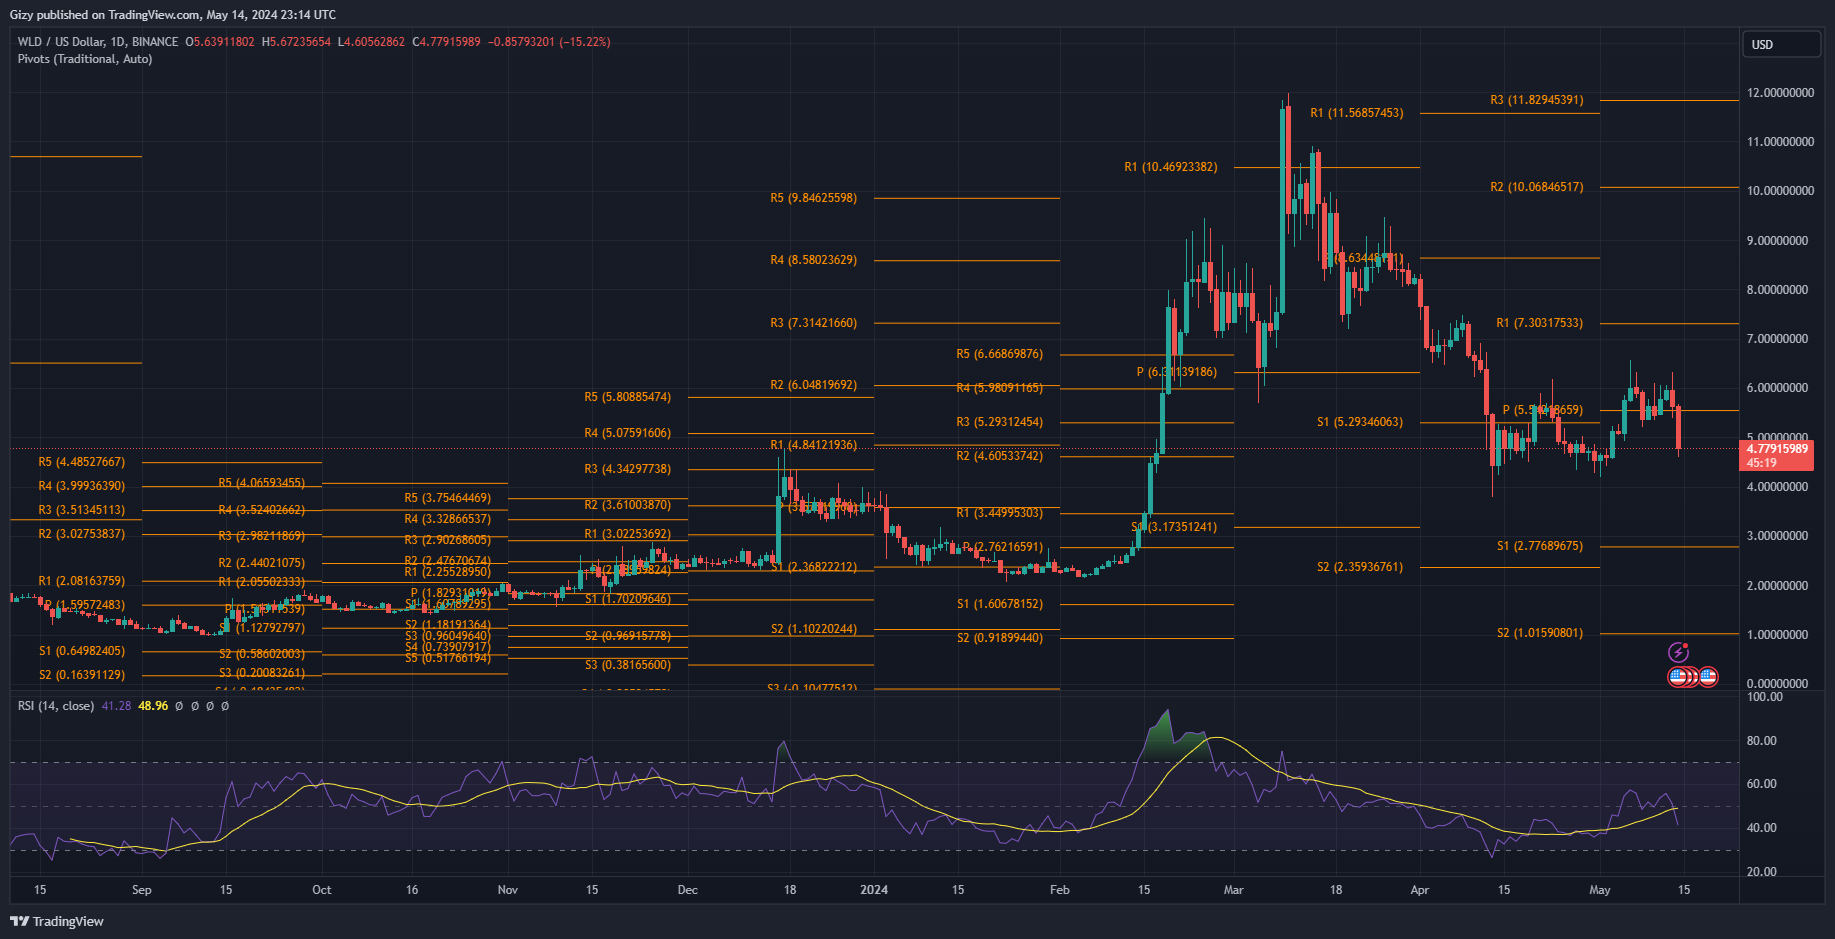
    Worldcoin is facing a lot of backlash from the crypto community following the announcement of a possible dump by insiders. They estimated the dump would be around billions worth of WLD, which would result in a massive price decline.

    Some traders sold their bags in a bid to avert such losses. This explains the asset’s current downtrend. It has been down by over 15% in the last 24 hours as several indicators flipped bearish. Nonetheless, the most recent dump is a continuation of the previous day’s trend that saw it lost over 5%.

    It remains to be seen if the decline will continue. It will retrace as low as $4.30 if the downtrend continues. However, the bulls may attempt recovery the coming days.

  • Crypto Analysis 12/5: BTC, ETH, BNB, SOL, XRP, DOGE, ADA

    Crypto Analysis 12/5: BTC, ETH, BNB, SOL, XRP, DOGE, ADA

    ADA was gaining a lot of attention at the start of the week. This stems from several fundamentals relating to its ecosystem. One such was Charles Hoskinson’s proposal to partner with Bitcoin Cash. He conducted a poll on X, asking users to vote on the collaboration. The poll garnered over 14,000 votes, with over 68% in favor.

    Nonetheless, the Cardano co-founder hinted that the bitcoin fork would have to be bridged or cross-chained for compatibility with his project. However, neither project has yet to agree on the technical aspect of such collaboration.

    However, traders gradually moved past the fundamentals, and the asset is trading at a loss. This is the same trend with the global cryptocurrency market cap. It is down by over 5% as it is worth $2.26 trillion from $2.36 trillion.

    The current crypto market valuation points to the decline in the price of other assets. Let’s examine how they performed.

    1. Bitcoin (BTC)

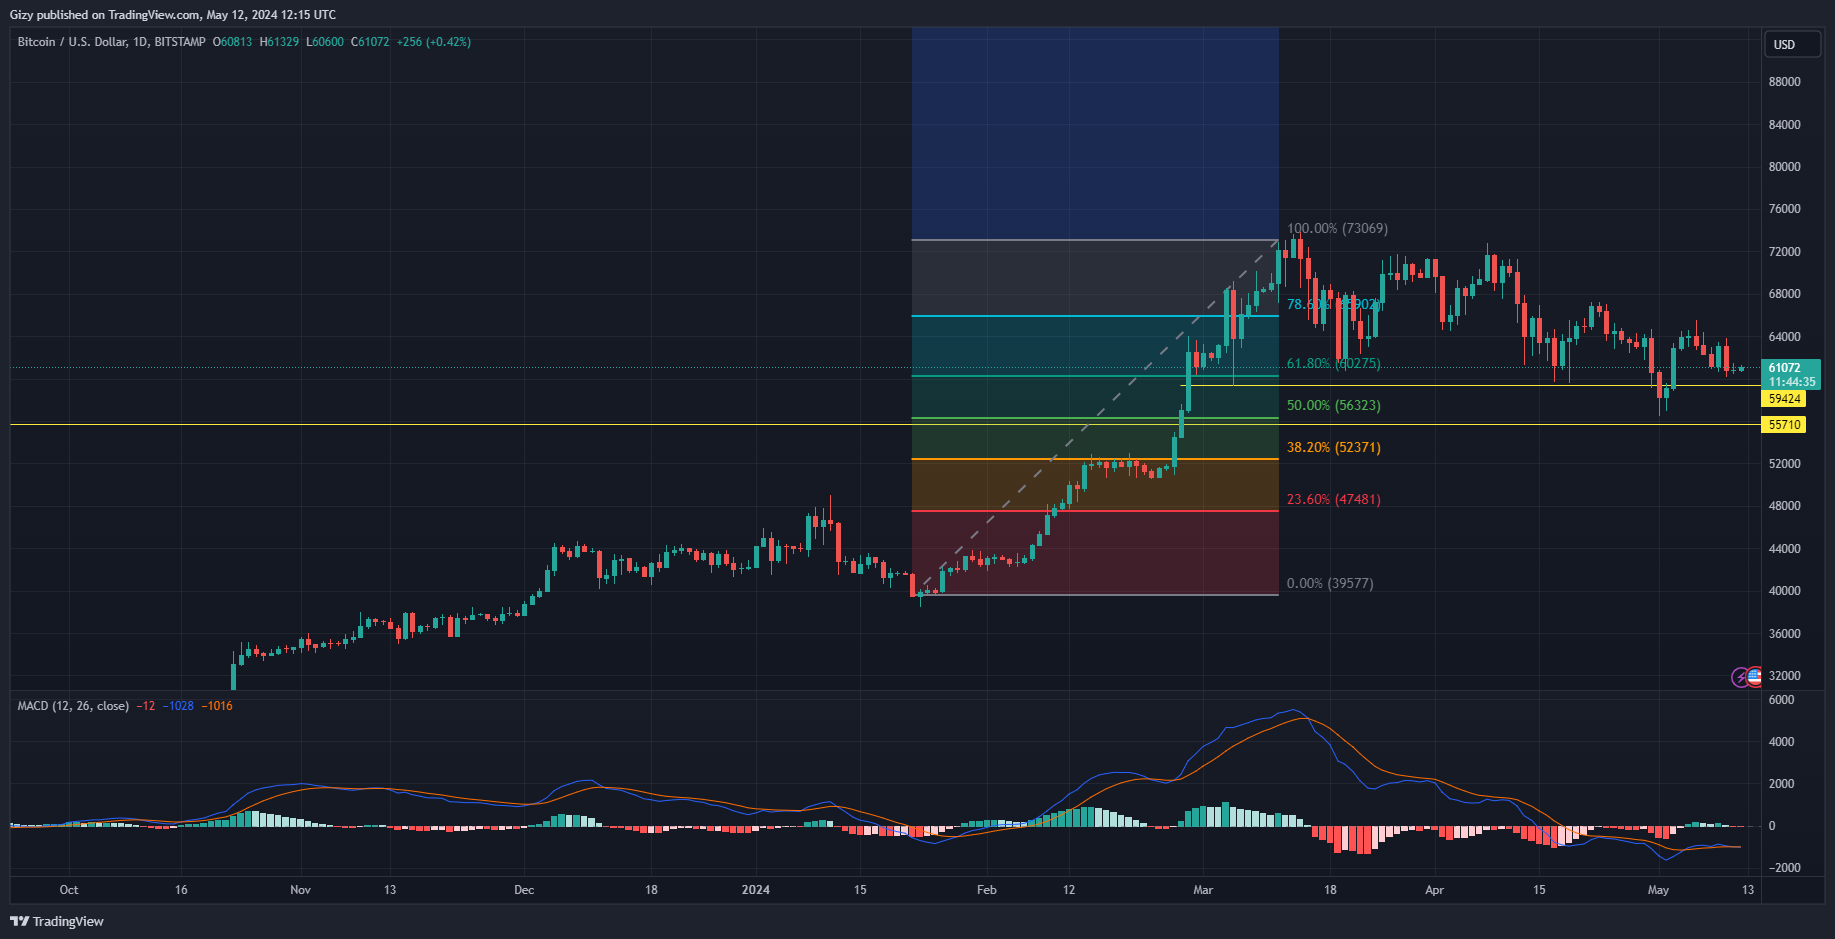
    Bitcoin is down by over 4% on the weekly scale. This comes after it retraced to a low of $60k and failed to surge above $65k. After hitting a brick wall at $65,500, it started a decline that it’s struggling to recover from.

    In response, the bulls are trying to stage a buyback at $60k. This move produced minimal results as the coin is exchanging at $61k. However, no sign of a massive pump will erase the coin’s accumulated losses.

    The moving average convergence divergence is seeing less volatility. This is the same trend with BTC. In the last 48 hours, it barely moved by 2%. In response, MACD has yet to show its bearish divergence. The space between the 12-day EMA and the 26-day EMA remains closed. Nonetheless, the current trend indicates an impending breakout.

    The exponential moving averages hint at prices going downhill. On more than three occasions, bitcoin failed to break the 50-day EMA decisively. Following its inability to flip it, the asset retested the 100-day EMA and bounced off it twice.

    If the apex coin flips the metric, it will retest the 61% Fibonacci retracement level at $60,200. Breaking this level will result in the coin edging close to the 200-day EMA at $53k. Nonetheless, before this critical level, the bulls will attempt a buyback at the 50% Fib level.

    2. Ethereum (ETH)

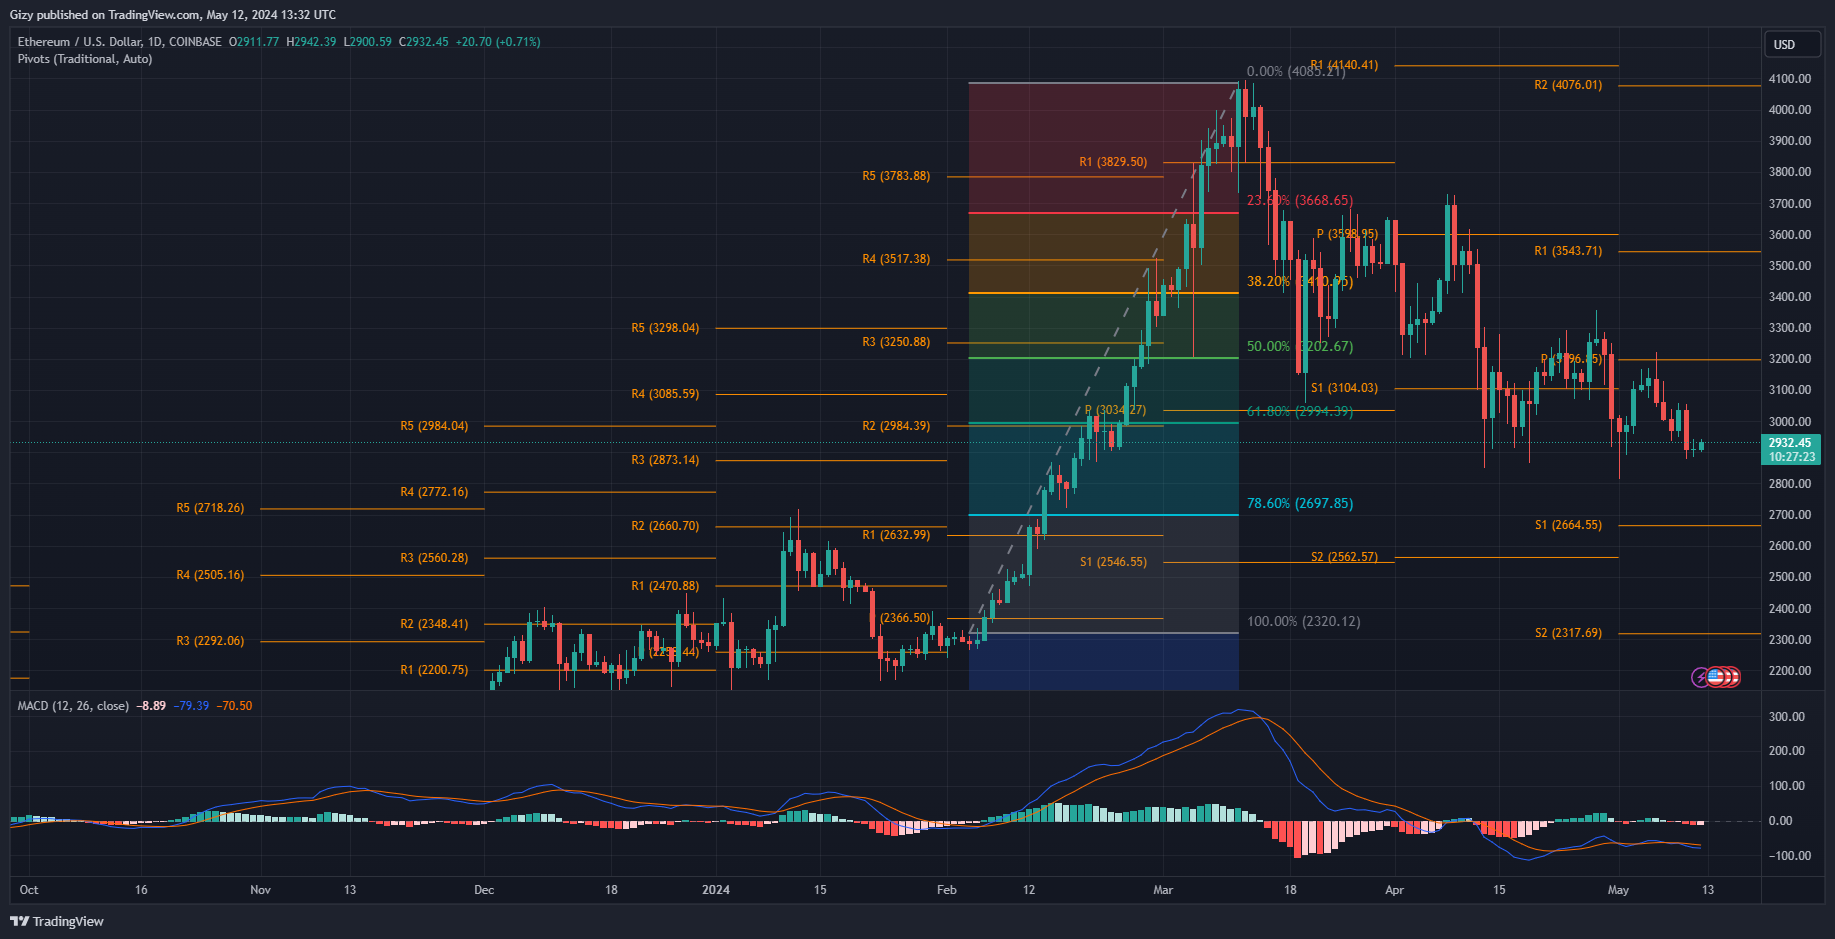
    Ethereum bulls are attempting a recovery as it appears the downtrend is coming to a grinding halt. During the previous intraday session, the doji saw the asset return to its weekly low. Nonetheless, the current candle possesses a more pronounced body.

    The most recent price trend shows the bull’s failed attempt to halt the ETH correction as it nears the second consecutive week of losses. It is down by over 6% on the weekly scale, extending the losses in the last fourteen days to almost 10%.

    A closer look at the chart shows the coin edging close to the first pivot support at $2,664. MACD is hinting at the chances that this will happen, as it displayed a bearish divergence a few days ago. Amidst small attempts at recovery in the last 48 hours, the 12-day EMA continues its descent. As a result, the space between both MACD’s EMA is growing.

    Having lost the 61% Fib retracement level, the bulls will look for buyback opportunities at the 78% Fib. This illustrates notable demand concentration at $2,700. Nonetheless, ether is edging to retest its 200-day EMA at $2,800 after losing the 100-day EMA a few days ago.

    3. Binance Coin (BNB)

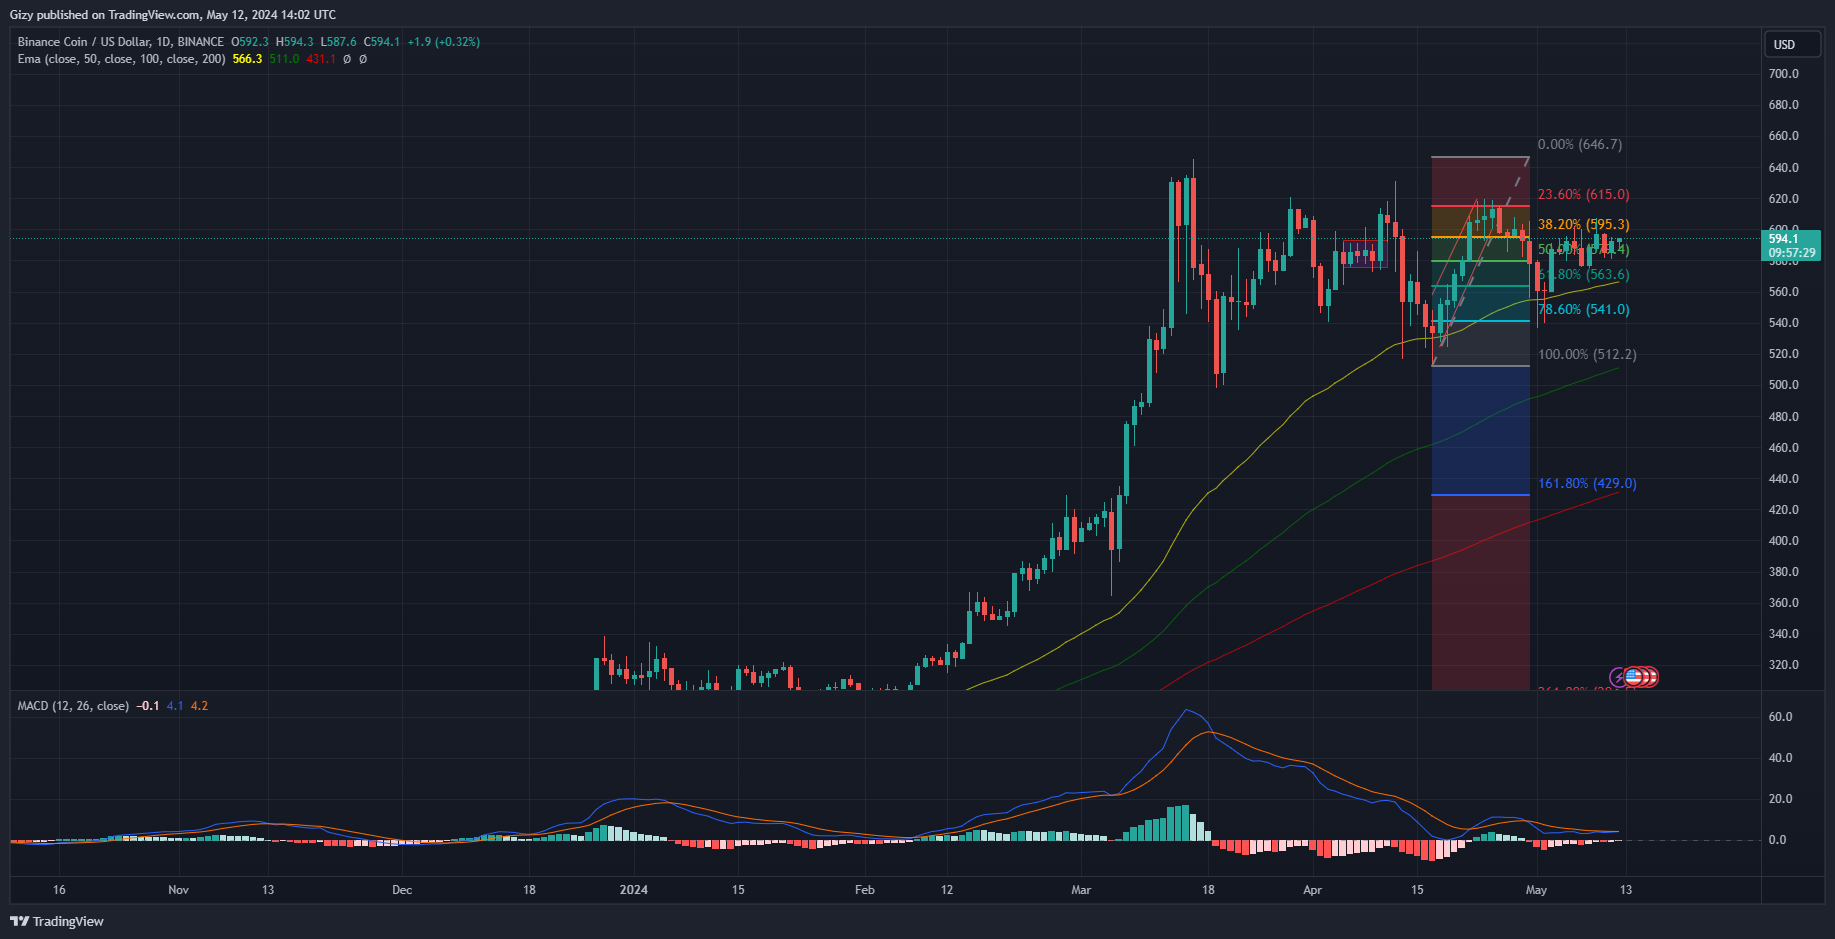
    Binance coin has yet to register any significant gains since the week started. It’s printing a doji on the weekly scale as it dropped to a low of $575 after facing strong rejections at $5607. The most recent valuation comes after it retraced to a low of $538 some weeks ago.

    Nonetheless, BNB has remained range-bound over the last seven days. Three days ago, it moved its lowest point to $583, which suggests a possible attempt at a further uptrend. The most recent price trend resulted from the asset’s massive decline last week. The decline was in response to the bear flag it printed due to an eight-day surge.

    The 12-day EMA is on the uptrend, responding to the minor price improvements in the last 48 hours. MACD is currently displaying buy signals, and both the 12-day EMA and 26-day EMA are in contact.

    It is also noted that the coin held on to the 50% Fibonacci retracement level at $580. This will be the launch pad for the subsequent attempts at resistance. They will look to reclaim the 26% Fib level at $615. This will mean the asset must flip the $600 resistance decisively in the coming days. The EMA also points at the bullish reading as BNB trades above the 50-day EMA.

    4. Solana (SOL)

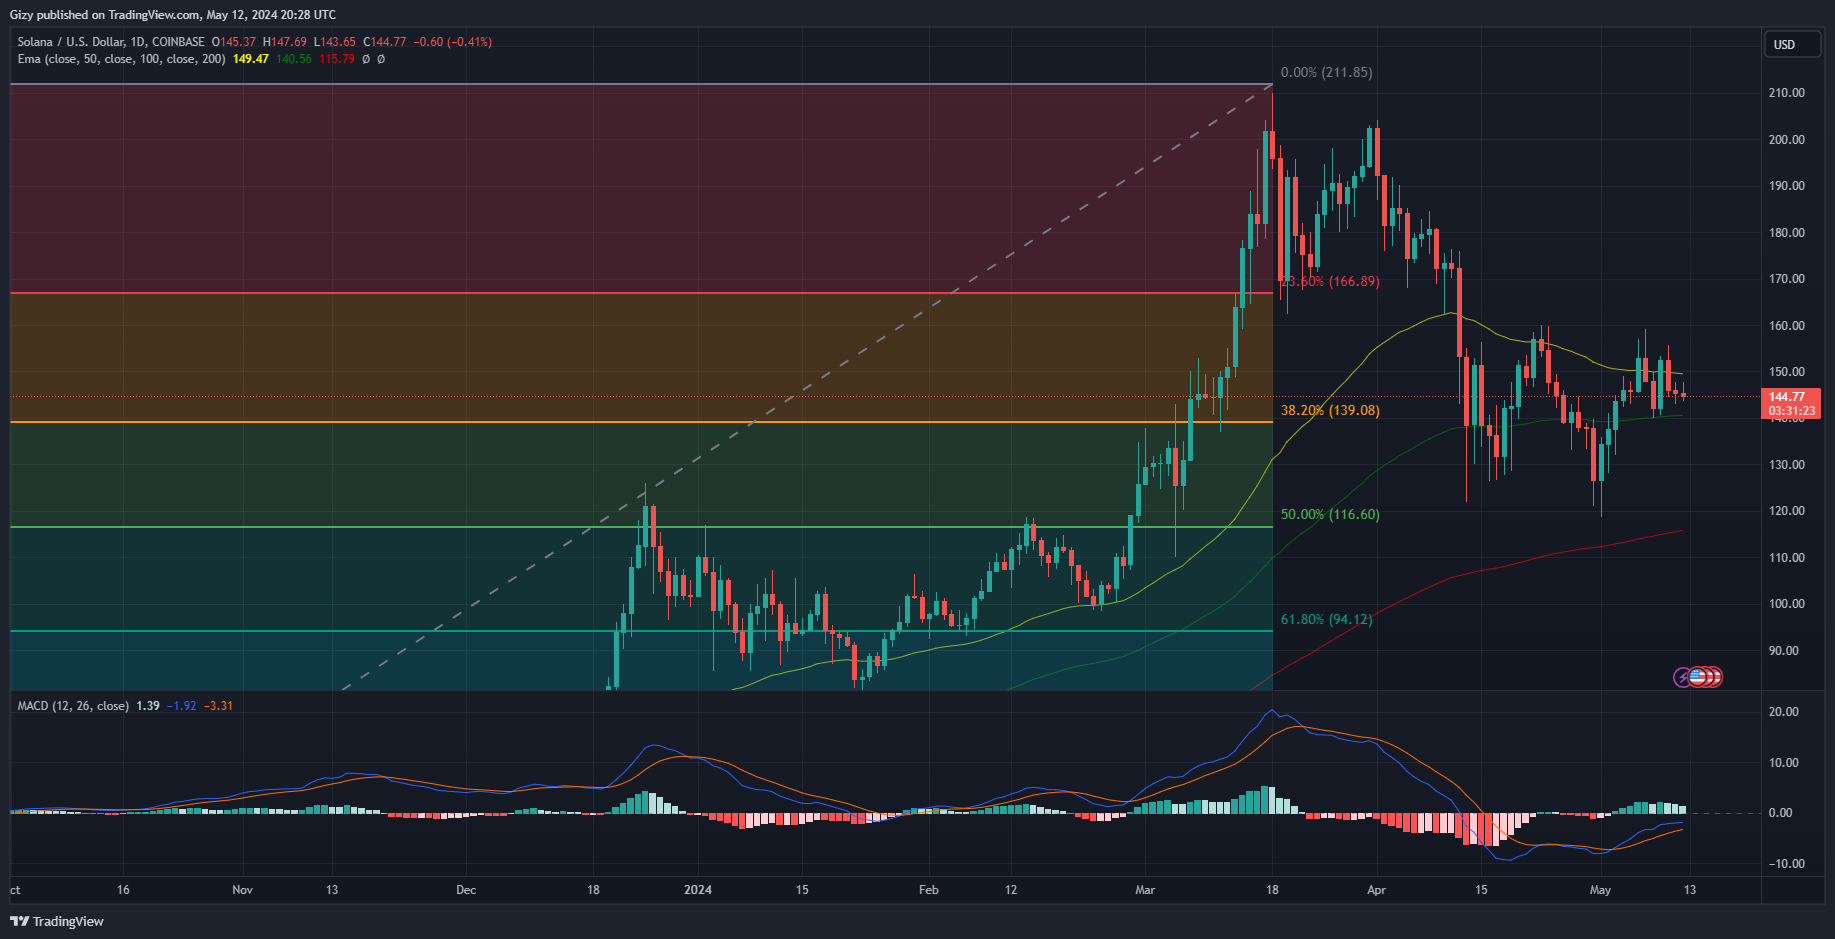
    Solana is printing a red doji on a weekly scale. The latest price movement comes after the coin retraced below $120 last week. A closer look at the current doji suggests a massive improvement from the previous week’s low.

    The 72 hours have been some of the most bearish for the altcoin since the week started. It lost over 5% during this period. Nonetheless, the coin is seeing a gradual stop to the downtrend. As a result, it failed to register any notable changes in price over the last 48 hours.

    Currently trading at $144, the asset is below its 50-day EMA and approaching the 100-day EMA. A retest of the 100-day EMA could see the asset drop as low as $140. Previous price movements suggest that there is significant demand concentration at the mark, as SOL bounced off it twice this week.

    The bulls will also defend the mark as it is close to the 38% Fib level. As seen last week, if the altcoin breaks the highlighted mark, it will retrace as low as the 50% Fib level at $116. Backing up the claim is MACD’s 12-day EMA. It halted its ascent in response to the most recent market trajectory.

    5. Xrp (XRP)

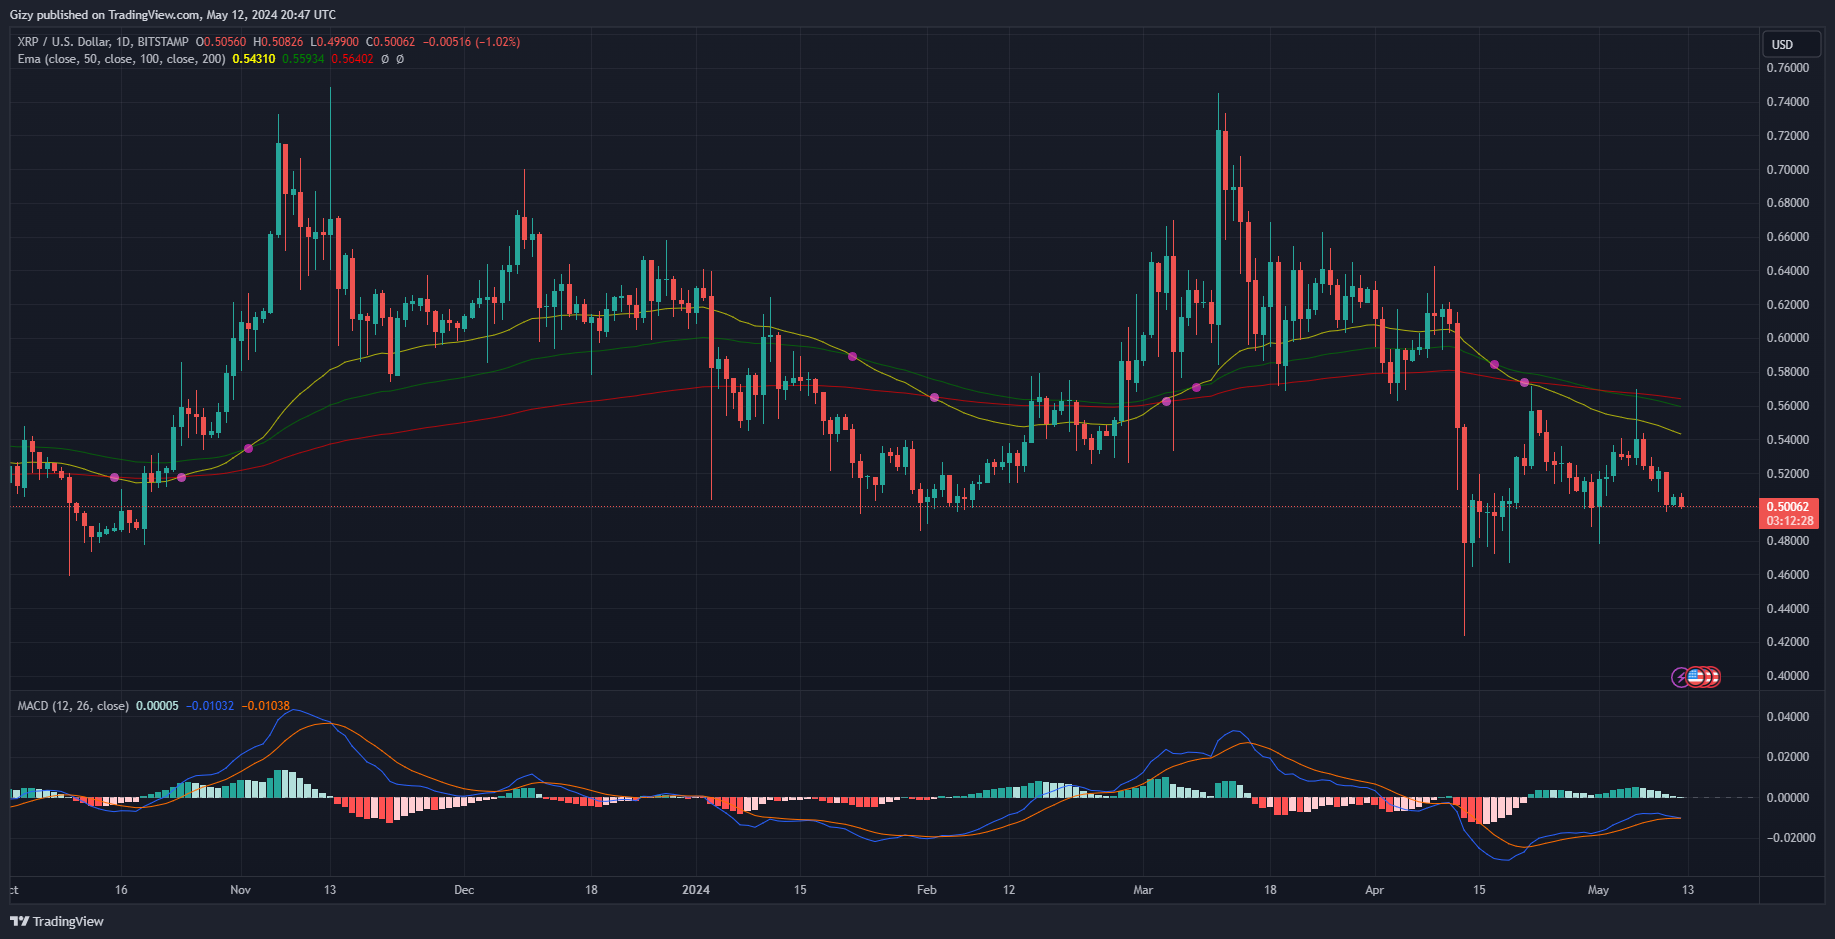
    As many await the court’s final verdict on the case of Ripple vs. SEC, a glance at prices suggests a different story. Nonetheless, XRP had a good start to the week as it surged to a high of $0.57 after it started the day at $0.52. It failed to end the day with any notable price change as it retraced to its opening price.

    A bearish close to the current seven-day period will mark the continuation of the altcoin trend of remaining range-bound between $0.46 and $0.57 on the weekly scale. Additionally, it is currently down by over 5%.

    As a result, several indicators flipped bearish and are displaying sell signals. One such is the 50-day EMA. It is below the 100-day and 200-day EMA in response to the most recent price trend. XRP is also trading all three exponential moving averages.

    The sell signal continues with MACD’s 12-day EMA intercepting the 26-day EMA. With an impending bearish divergence, the altcoin will see more decline. Nonetheless, it is holding on to the $0.50 support. Closing the week below will guarantee a drop to a low of $0.46. The bulls will also try to defend prices at $0.48.

    6. Dogecoin (DOGE)

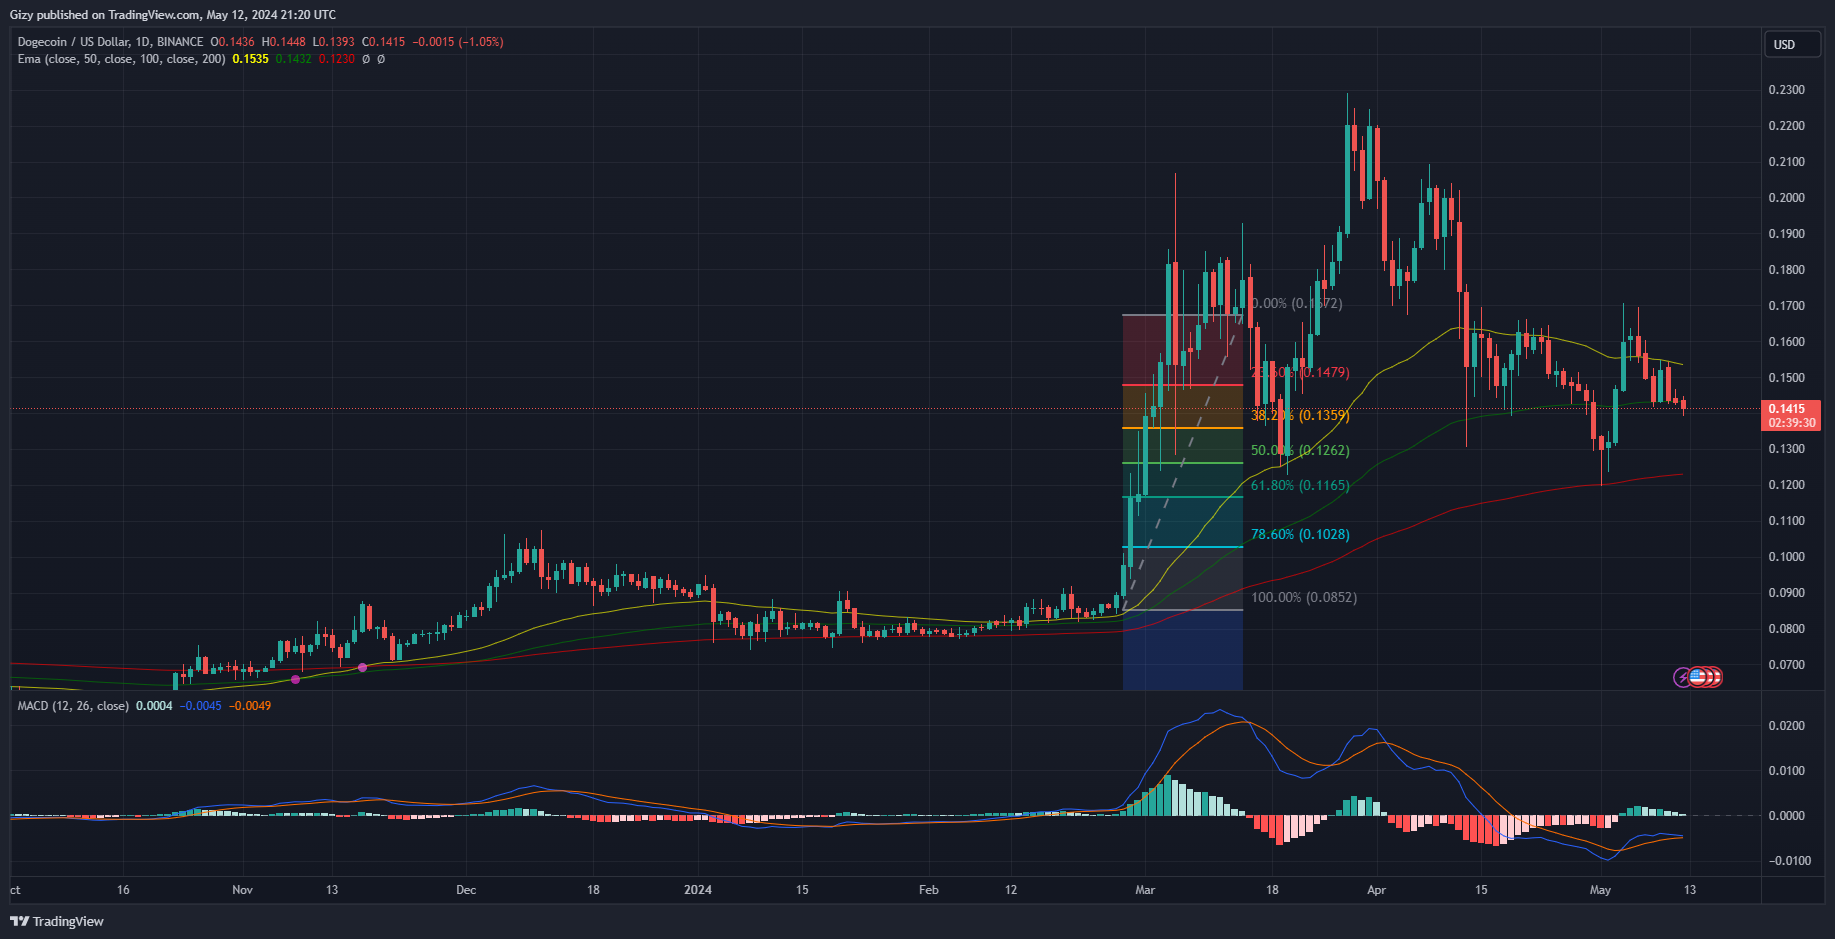
    Dogecoin lost a critical support it held throughout the week. Although the flip is not decisive, it registered a new low for the intraweek session. A close at this value will signify an over 12% loss as the coin faced massive rejection at $0.17 and has yet to recover from the decline.

    In addition to losing the critical mark, DOGE flipped its 50-day EMA a few days ago. It is trading below its 100-day EMA after going below it a few hours ago. The most recent reading puts the bears at an advantage as they anticipate further price declines.

    Adding to the impending downtrend is the moving average convergence divergence. The indicator is displaying bearish convergence. With an impending divergence, dogecoin will continue downhill. This could mean a retest of the 200-day EMA.

    The bulls will look forward to a rebound at the 38% fib level at $0.135. If it breaks it, DOGE will retest the 50% Fib at $0.12 (guaranteeing a retest of the 200-day EMA).

    Conversely, if market conditions improve, the asset will seek to regain stability above the 100-day EMA.

    7. Cardano (ADA)

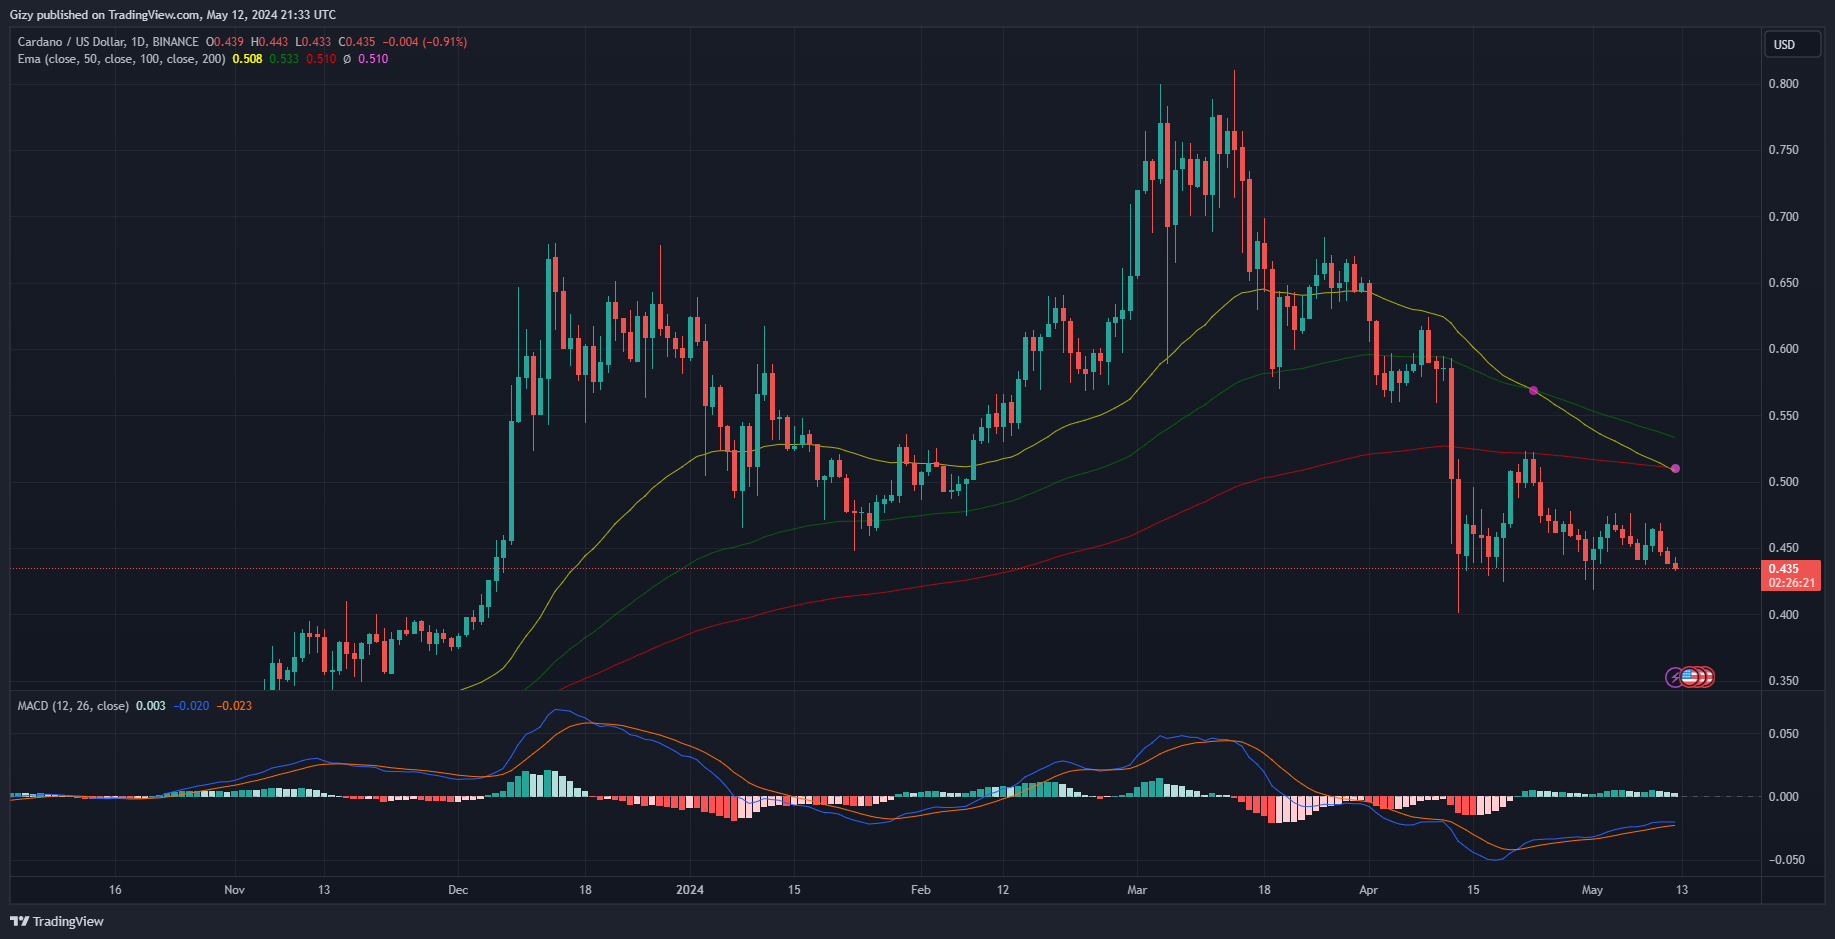
    Following Hoskinson’s announcement, ADA retested its fourteen-day high at $0.47. Nonetheless, it experienced notable corrections after peaking. This will mark an over 4% weekly price decline as the asset heads for its third consecutive week of losses.

    Amidst the price decline, the Cardano is holding on to $0.43. Having set a new low for the week, it will look to rebound at $0.42. However, the 50-day EMA points at such a situation as bleak. It is about to intercept the 200-day EMA.

    The same sell signal is going off on MACD. The 12-day EMA has halted its uptrend and started a bearish convergence in reaction to the most recent three-day price decline. A completion of this phenomenon will trigger a drop below $0.40.

  • Top Five Cryptocurrencies to Watch This Week (May 6)

    Top Five Cryptocurrencies to Watch This Week (May 6)

    Most cryptocurrencies are currently seeing a significant decrease in value. The crypto market fell victim to another wave of bearish fundamentals.

    One such is the ongoing hunt by the United States Security and Exchange Commission. The regulator sent wells notice to Robinhood’s trading platform, spreading panic among its users and other crypto assets. A few hours ago, the SEC chairman made an appearance on CNBC. He stated that most tokens are securities under the law of the land.

    The statement by the SEC chairperson forbodes other attempts by the regulators to go after other cryptocurrencies.

    Nonetheless, the crypto market saw a lot of volatility during the previous week. Over the last seven days, its worth increased by over 4%. However, it is on the decline at this time. Will it improve?

    Top Five Cryptocurrencies to Watch

    1. Bitcoin (BTC)

    Bitcoin is struggling at $63k following the statement by the SEC chairman. Nonetheless, the trend started during the previous intraday. The apex coin surged to a high of $65,500. In response, speculation of an attempt at $70k gradually gained more attention.

    However, the asset closed with losses of almost 2%. Still bearish, BTC has yet to register any significant changes in value. Nonetheless, it has crossed several metrics that point to further price declines, including the 50-day EMA. The current day marks the second consecutive day of the asset’s failure to close above it.

    This consistently places the bears at an advantage. Coupled with the growing selling pressure on the $63k support, the relative strength index has started its descent in response to the slight increase in selling volume.

    If the current level buckles under pressure, the apex coin will retest the next critical mark at $62k. If the bulls fail to defend the $62k support, BTC will retrace as low as $60k.

    On the other hand, it is worth noting that the 12-day EMA is still on an uptrend, which may mean the bulls’ impending attempt at a buyback. If this plays out, Bitcoin may reclaim $65k.

    2. Render (RNDR)

    Amidst the growing concern in the market, AI token Render is on an uptrend. Over the last week, it surged from a low of $6.88 and retested $10. Although it failed to close above it, it registered gains of over 23%.

    The token continued the uptrend and has gained stability above $10. A few hours ago, it retested $11 but fell short at $10.5 as it lost momentum. Nonetheless, the accumulation/distribution asserts that the uptrend is buoyed by pure demand as the metric rises in response to the current price movement.

    Additionally, the moving average convergence divergence maintains its positive posture. The metric displayed a bullish divergence a few days ago and shows no signs of halting. The bulls will continue the surge.

    Based on previous price movements, the bears will attempt a sell-off at $11. Nonetheless, the mark is not challenging. As a result, RNDR will look to climb as high as $12 within the next five days. However, it may fail to flip decisively.

    On the other hand, a change in price trajectory will result in the asset retracing. Previous price movements suggest a notable demand concentration at $9.

    3. Ethena (ENA)

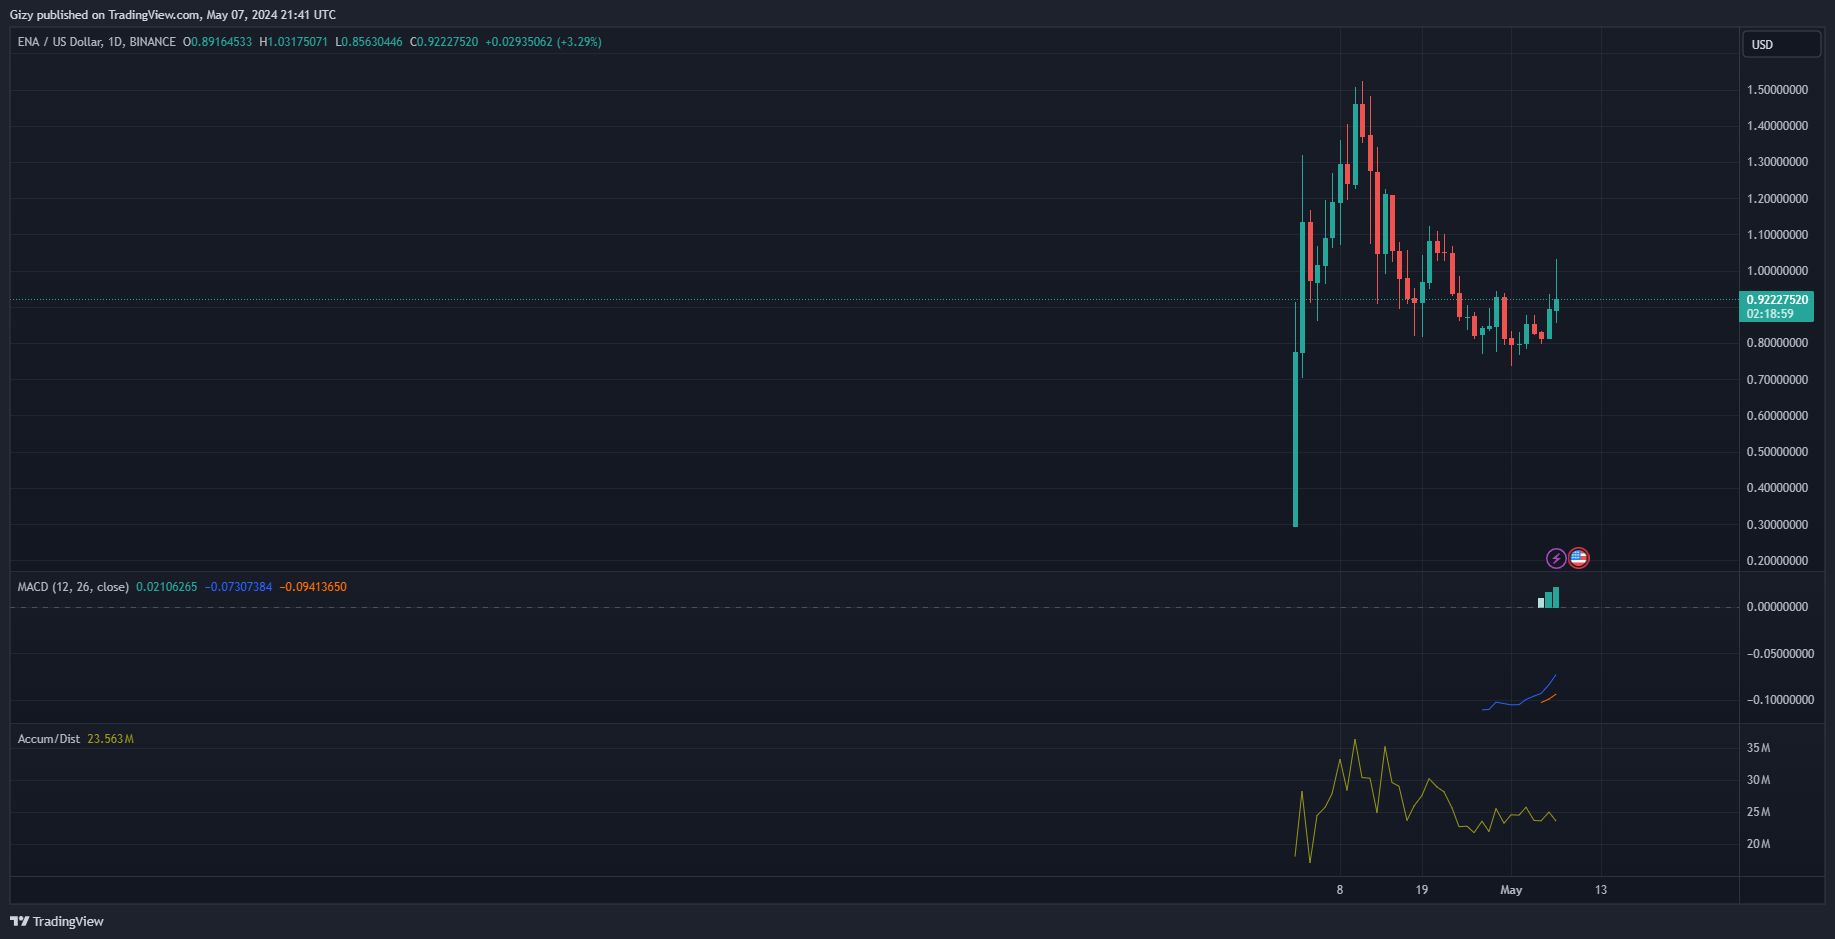
    Ethena is seeing considerable increases at the time of this writing. However, the candle it’s printing hints at an impending change in price trajectory. It started trading at the current intraday session at $0.89 and surged to a high of $1.03.

    Currently trading at $0.92, the asset lost over half its previous gains. Nonetheless, it is up by over 3%. The most recent surge continues the previous day’s trend, which saw the coin gain over 9%.

    The current price suggests that the uptrend is coming to a halt. This comes after many traders took profit at the peak. With little buyback, it is unable to return to this mark.

    In response, the accumulation/distribution is heading downhill. According to the rules governing this metric, traders should expect a price decline when it’s down, and prices are not. If this plays out, the asset may experience corrections.

    However, price movements suggest that the retracement will not be severe. This is due to the significant demand concentration at $0.80. Nonetheless, if it slips, it will rebound $0.70.

    The chart also points to another attempt at $1. If this plays out, the asset will look to retest $1.10 before the week runs out.

    4. Neo (NEO)

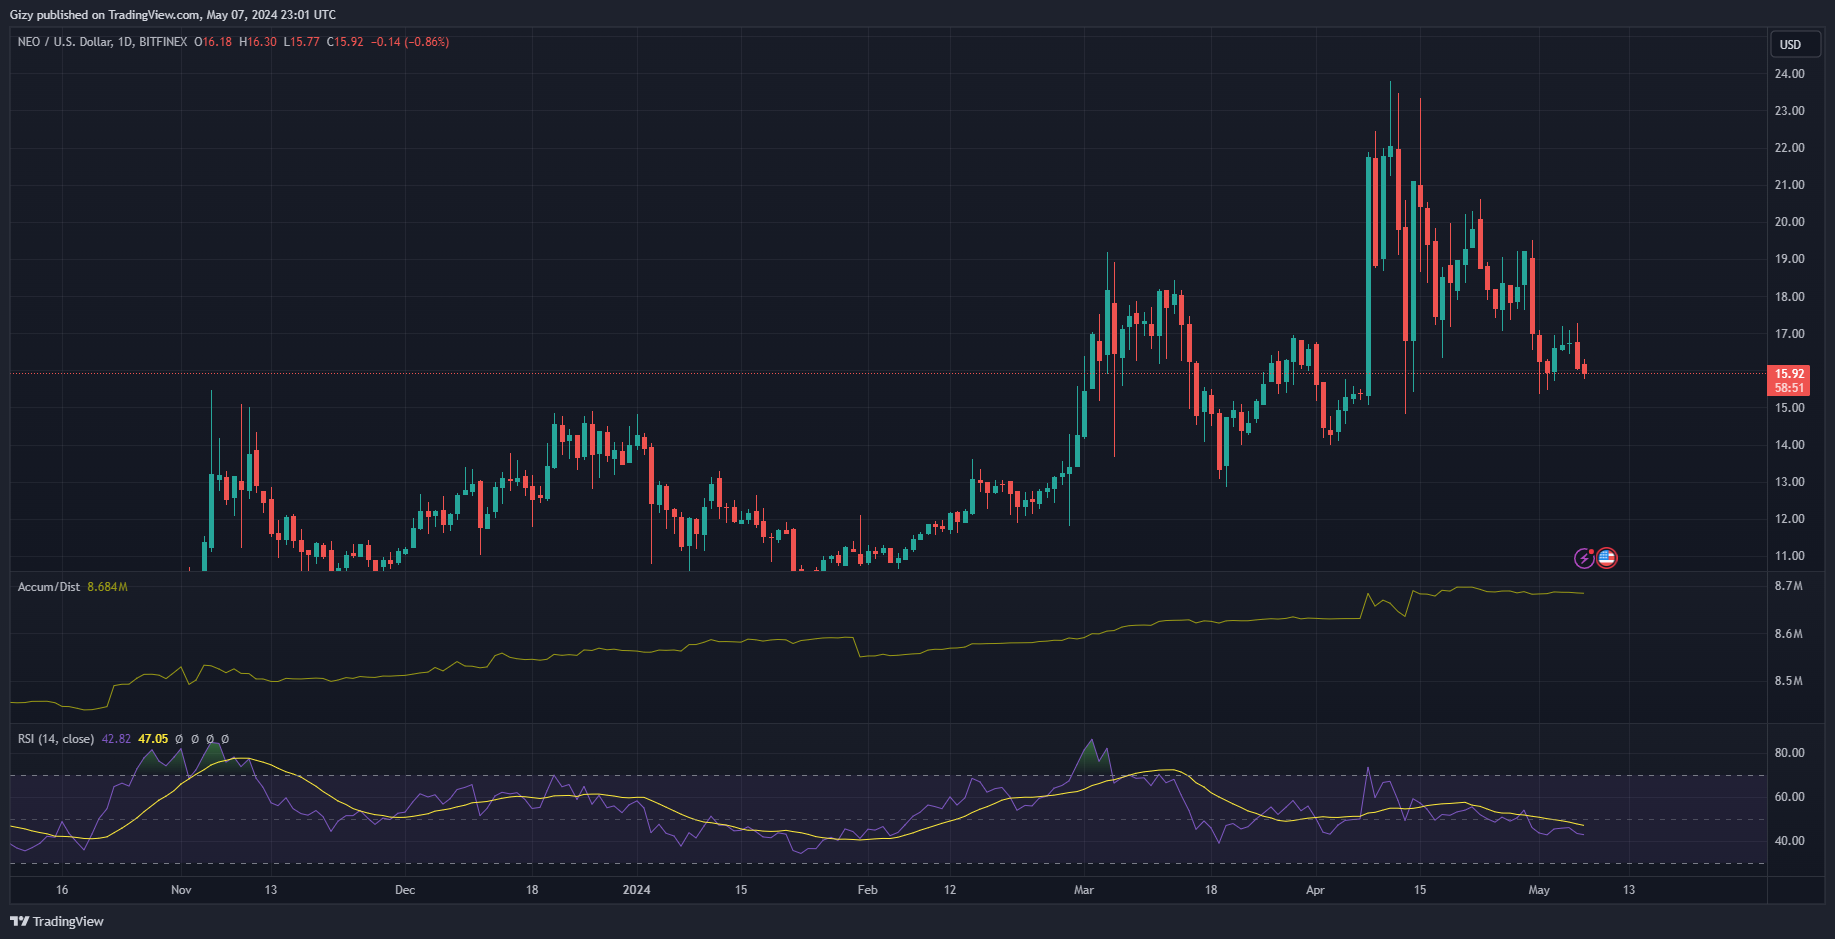
    Since the new week started, NEO has yet to register any positive change in price. It is down by over 5% as the price struggle continues. Most of the losses this week occurred during the previous intraday session when the asset started trading at $16.7 and surged to a high of $17.2.

    After attaining the high, it experienced massive corrections. Due to this, it retested the $16 support but failed to flip it. As the charts suggest, it is trading below the critical mark and is edging for more downtrends.

    In response to the growing selling pressure on the asset, the relative strength index is also on the decline. Currently, at 42, it places the bears at an advantage and hints at further downward price movement. Additionally, MACD is silent and has printed no other signals since the bearish divergence.

    If the downtrend continues, the asset will slip below its current price. The bulls must defend $15, as failure to do so will result in NEO dropping as low as $14. Nonetheless, significant demand concentration at this mark may mean a possible rebound.

    On the other hand, the red candle the asset is printing indicates an impending buyback. If that happens, it gains stability above $17.

    5. Helium (HNT)

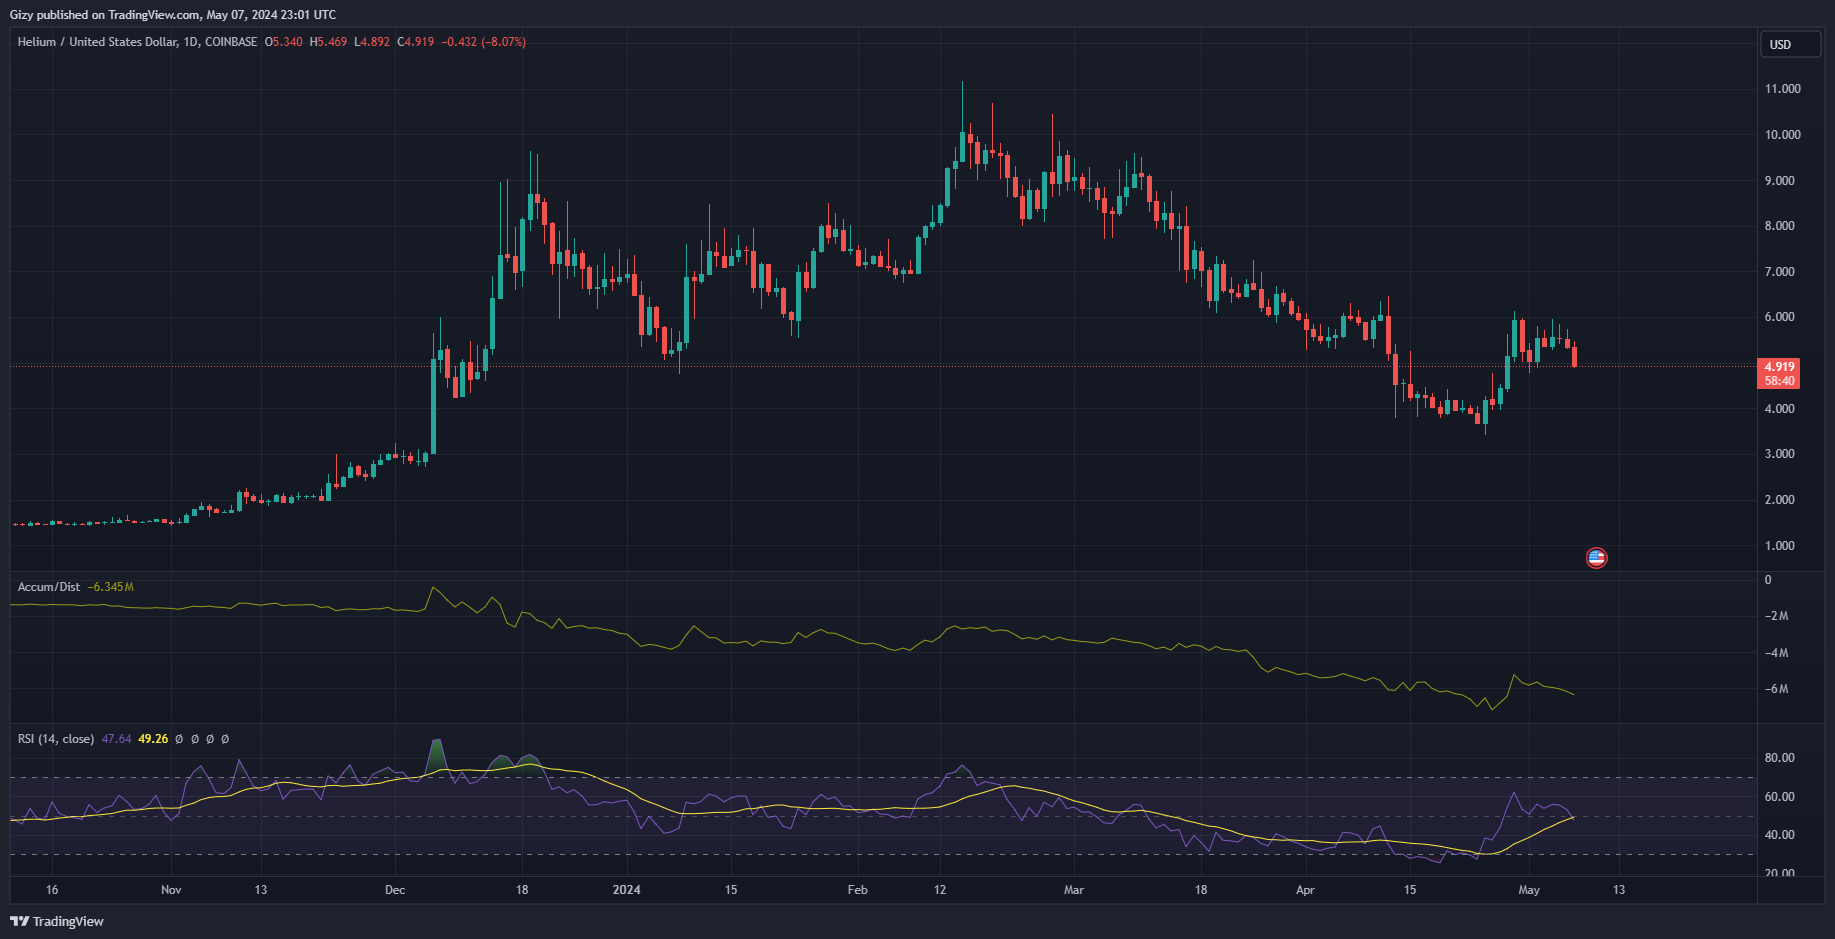
    HNT has been down by over 10% since the start of the week. It lost 3% during the previous intraday session and continued the decline with an over 8% decline during the current session.

    In response to this consistent decline, RSI is below 50, placing the bears at an advantage. Additionally, the moving average convergence divergence is also printing sell signals. This comes as the 12-day EMA is heading downhill and will intercept the 26-day EMA.

    With the bearish readings, the asset may retrace as low as $3.80. Nonetheless, there is a small demand concentration at $4.80. On the other hand, the coin may see small attempt above $5.

  • Crypto Analysis 30/04: BTC, ETH, BNB, SOL, XRP, DOGE, TON, ADA

    Crypto Analysis 30/04: BTC, ETH, BNB, SOL, XRP, DOGE, TON, ADA

    XRP parent firm Ripple continues it legal battle against the SEC. The regulators introduced fresh evidences to the case that caught the firm unaware. As a result, the defendant is pushing to oust this new proof.

    Nonetheless, the asset traded sideways during the previous intraday session as the court processions continued. Nonetheless, other events took place in the market over the last seven days. One such is Hong Kong’s launch of both Bitcoin and Ethereum ETFs.

    However, approval barely had any impact on the prices of the associated assets. Ether had small price declines, while BTC had no notable change in price. The situation is worse at the time of writing, as the crypto market is bleeding.

    Over the last seven days, the global cryptocurrency market cap lost over 10%. It dipped by almost 5% in the last 24 hours. Let’s examine how some assets in the top 10 performed.

    1. Bitcoin (BTC)

    Bitcoin had its biggest loss of the previous week on Wednesday. It lost over 3% as it failed in its bid to gain stability above $67k. after facing massive rejections at $67,000, the coin retraced to a close at $63,554.

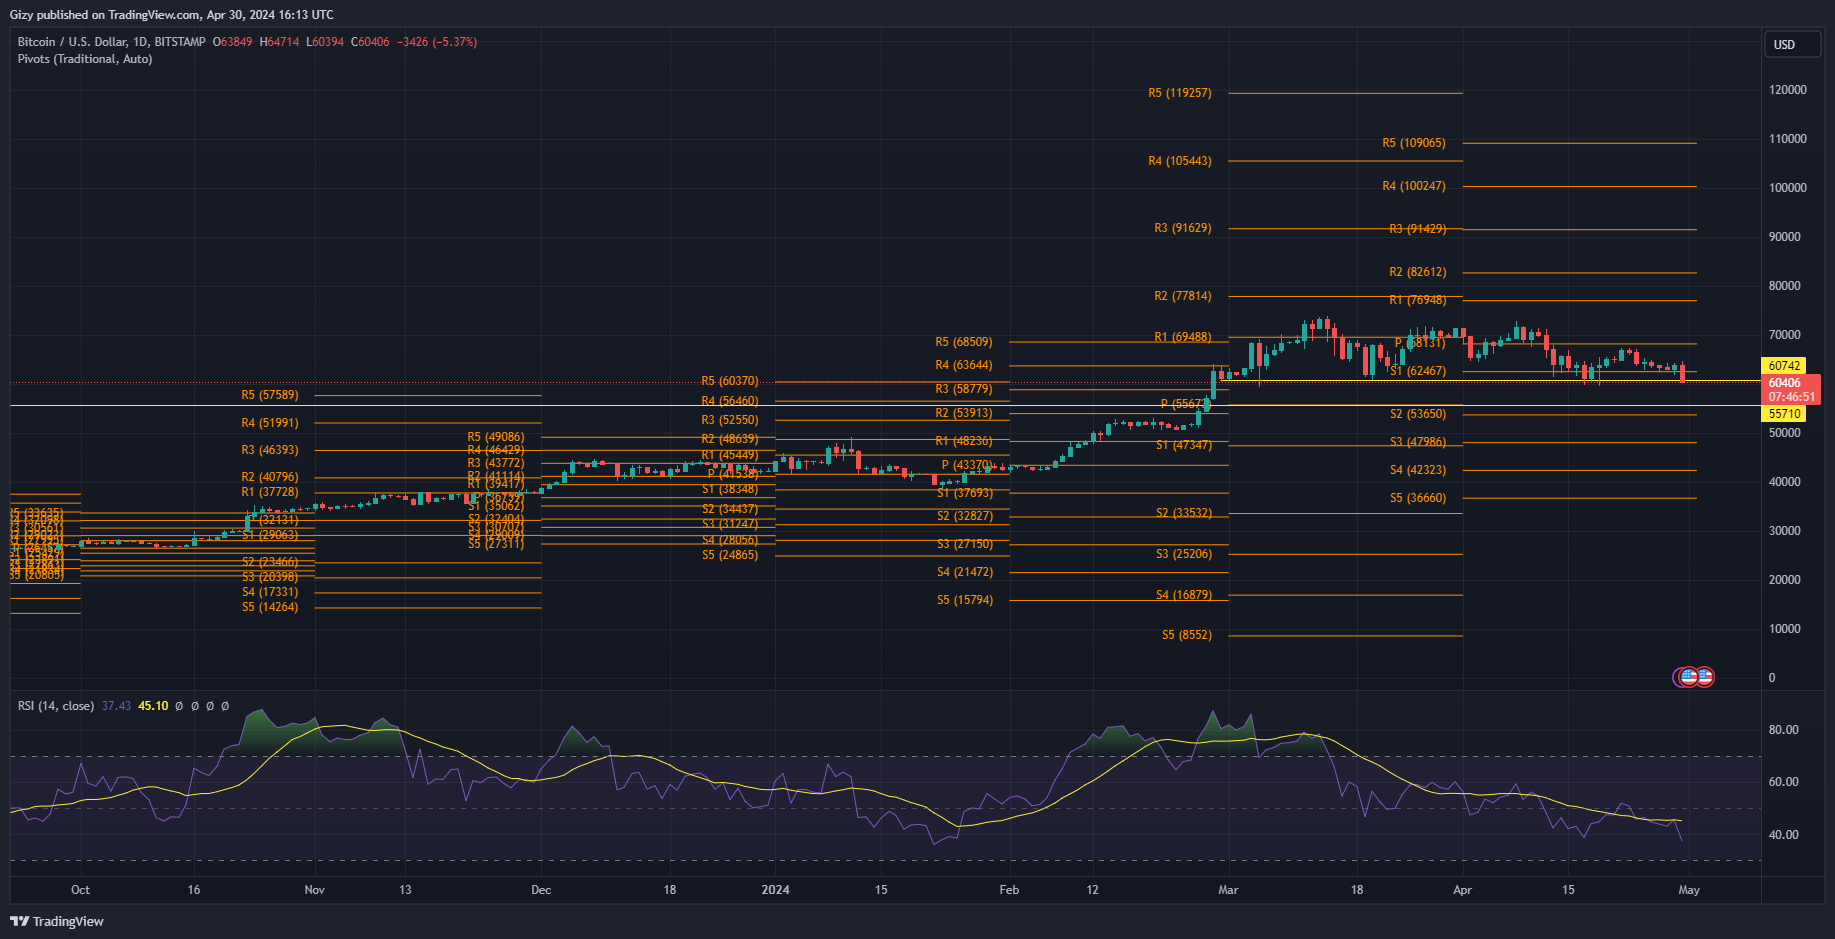
    It attempted recovery during the previous intraday session, rebounding at $61,700 and closing at $63,800. A few hours ago, the bulls tried to continue the bullish trend but failed, as the coin retraced following massive rejections at $64,700. As a result of the most recent price decline, the apex coin returned to its two-month low.

    It dropped to a low of $59k before rebounding and is currently trading at $60,700 as the bulls attempt to soak up the supply.

    Amidst the massive price decline, the apex coin had a whopping 40% increase in trading volume over the last 24 hours. However, the relative strength index suggests the bulk of the increases were from bearish traders as the metric is very close to the lowest level this year.

    Nonetheless, the current low places the bulls at an advantage as it is within a level of strong demand concentration. Additionally, BTC is trading close to its first pivot support and will attempt to reclaim it.

    ETH/USD

    During the previous intraweek session, Ether’s performance created a buzz about a potential return to $3,500.

    However, it failed to reach that level and instead peaked at $3,355. After hitting this high point, it retraced and closed at $3,263, representing an increase of more than 3%.

    Recent trading activity over the last 48 hours confirms that the uptrend has ended. The altcoin lost nearly 2% during the previous intraday session and is still declining. A few hours ago, it broke the $3k support and is now trading at $2,984.

    On-chain data indicates that the asset had a 10% increase in trading volume over the last 24 hours. However, the current price performance suggests that most of the volume came from the bears.

    As a result, the Relative Strength Index (RSI) is heading towards its three-month low at 38 as it continues its downtrend.

    A closer examination of the metric reveals that ETH always experiences buyback when it gets to 36. This trend has occurred more than three times in the last three months. If it happens again this week, this will imply a further decline before a recovery.

    The altcoin may continue to decline until it sees buyback at $2,800 (78% Fibonacci retracement level), having lost the 61% Fibonacci retracement level.

    Nonetheless, the current candle shows an extended wick, indicating that the bulls are gradually absorbing the excess supply. If this trend continues, the coin will likely reclaim its first pivot support at $3,100.

    BNB/USD

    Over the past two weeks, the native token of the exchange has been experiencing a continuous uptrend.

    However, due to the formation of a bear flag, its upward momentum was temporarily halted during the last two days of the previous week. Despite this, it managed to close with gains exceeding 3%.

    The coin is still feeling the effects of this trend, as evident from the trading actions over the last 48 hours.

    Unfortunately, BNB was unable to resist the market sentiment, resulting in one of the largest declines it has experienced this month. After reaching its peak at $605, it has retraced to $555.

    Currently, the moving average convergence divergence (MACD) is displaying bearish signals as the 12-day EMA has crossed below the 26-day EMA.

    This bearish convergence indicates further declines for the altcoin. If the current price decline continues, the RSI may drop from its current level of 45 to as low as 40.

    Despite these indicators, BNB is trading at $567 and has reclaimed its 61% Fibonacci level. The bulls are expected to push the price further and attempt to reclaim the 50% Fib at $579.

    DOGE/USD

    On the other hand, Dogecoin reached a high of $0.16 last week before retracing to $0.14. It ended the week with a loss of over 7%.

    Unfortunately, the downward trend has continued over the last 48 hours, with the asset down by over 9%. Currently trading at $0.13, the relative strength index (RSI) is displaying bearish signals with a metric reading of 34. If the market sentiment continues, the RSI will drop below 30, indicating an oversold condition for DOGE.

    The Fibonacci retracement highlights critical levels to watch, with the first pivot support at $0.14 already lost. The Pivot Point Standard points to $0.076 as the next stop.

    However, DOGE is expected to end the week above the 50% Fib at $0.12. If it fails, it may retest the 61% Fib at $0.11. Furthermore, DOGE will try to reclaim its S1 at $0.14 before the weekends.

  • Top FIve Cryptocurrencies to Watch This Week (April 30)

    Top FIve Cryptocurrencies to Watch This Week (April 30)

    Most cryptocurrencies are down considerably and have retested several essential levels. Ethereum retraced by over 5% in the most recent market and dropped below $3k.

    A few minutes ago, Binance founder Changpeng Zhao was imprisoned for four months for failing to establish adequate anti-money laundering protections. The crypto market is reacting to this news as the bleeding market has worsened in the past hour.

    In response, the global cryptocurrency market cap is down by almost 2%, bringing the total loss to over 4% on the 24-hour scale. Some of the top losers over the last 24 hours included SEI, HNT, and LDO, as they lost over 10% each.

    With the decline getting deeper, how will the market perform this week?

    Top Five Cryptocurrencies to Watch

    1. Bitcoin (BTC)

    Bitcoin is not off to a good start this week, continuing the trend it experienced last week. During the previous week, the coin closed with losses exceeding 3%. It surged to a high of $67k but dropped to a close at $63k as the bulls failed to sustain prices.

    Following a Monday marked by intense price volatility, the asset is seeing huge supply as more traders sell off their bags. As a result of the bearish action, the apex coin is currently exchanging at $60,700. The current price shows recovery, as it tested $59k but rebounded.

    Nonetheless, indicators are blaring. One such is the moving average convergence divergence. Following a close bullish convergence, the 12-day EMA continues its descent and is at its lowest level in a year. The decline will continue if the bulls fail to force price recovery in the coming days.

    The relative strength index points to a reversal in price trajectory. The metric is currently trending at its lowest mark in a year. Based on previous movements, the coin sees a buyback when the RSI hits this level.

    If that happens, the apex coin will attempt recovery. Having regained stability above the 61% Fib, the asset will look to gain strength above the 78% Fib at $66k. However, if the selloff continues, BTC will retrace as low as $56k.

    2. Toncoin (TON)

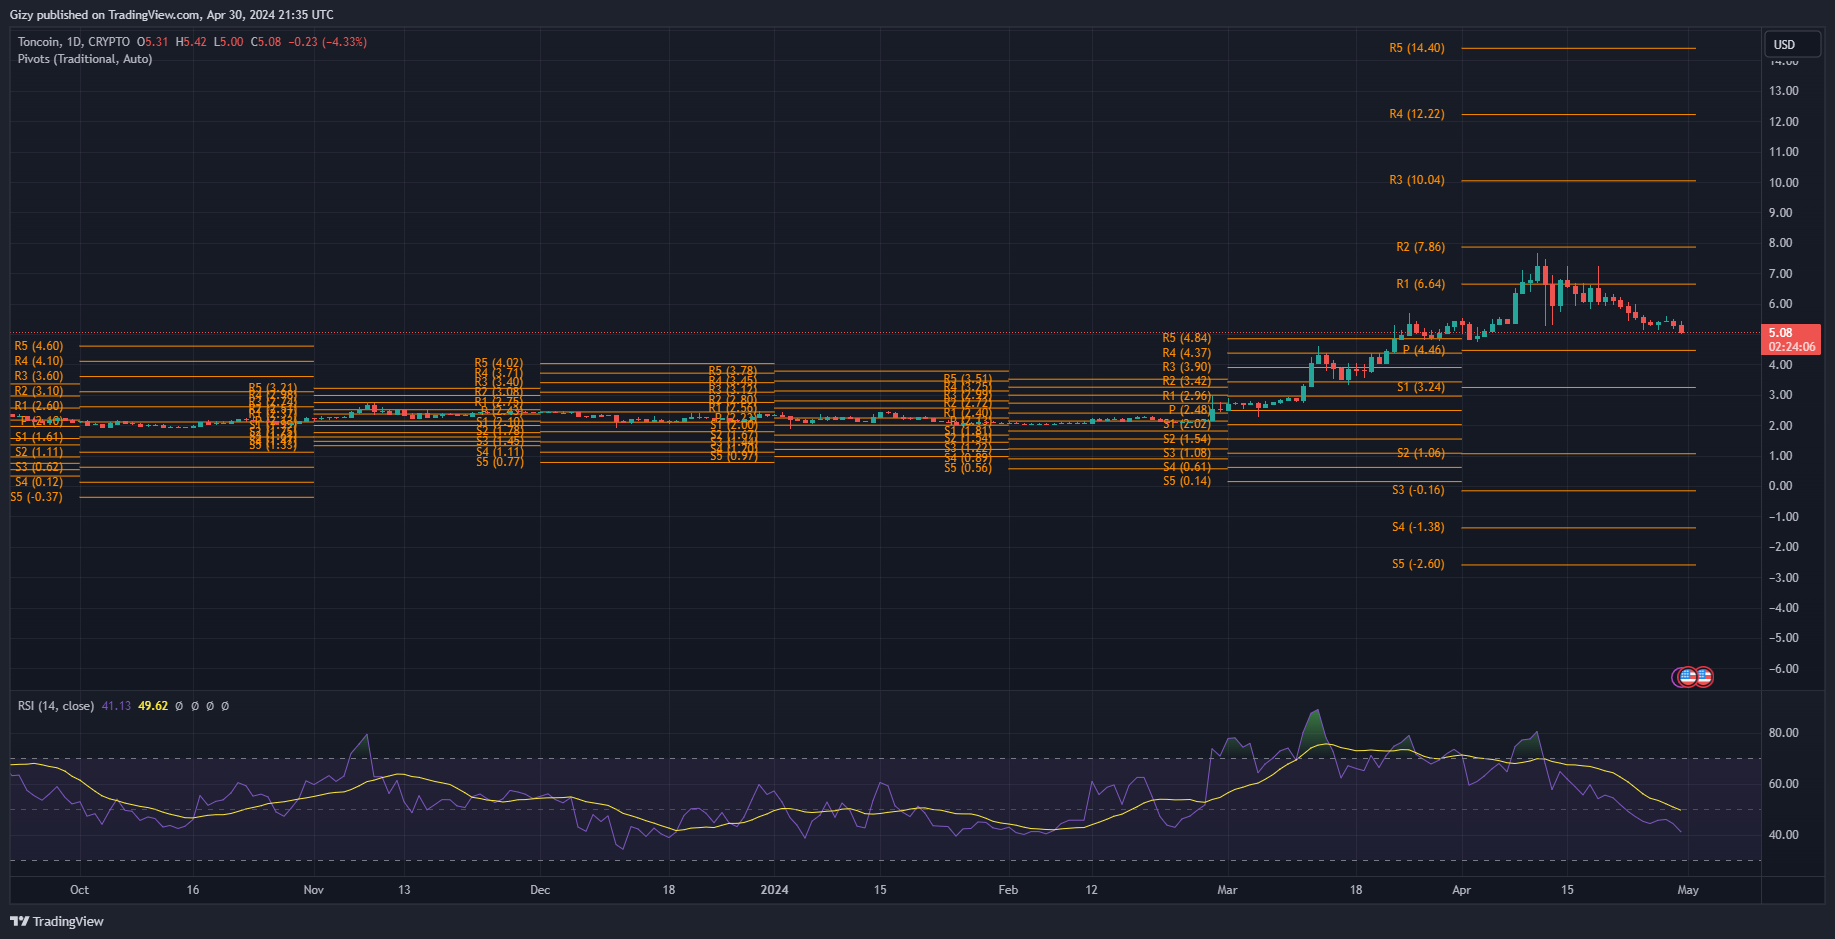
    Toncoin is yet to recover from its decline. During the previous week, it peaked at $6.23, sparking speculations of a return to its previous high. However, this never happened, as it ended the session at $5.42, with losses exceeding 11%.

    Since the new week started, the coin has lost over 6%. However, it showed signs of recovery a few hours ago, peaking at $5.42 but retracing after hitting a brick wall. Due to this, the price went downhill, and it is exchanging at five as the bulls defend the support.

    Nonetheless, the bullish action had little to no effect on indicators like RSI as it continued its downtrend—the metric places the bears at an advantage as it is currently at 41. Nonetheless, previous trends reveal that buyback is imminent as the relative strength index approaches a level the bulls have defended recently.

    If this happens, the asset will hold the $5 support for the rest of the week. It will also attempt the first pivot resistance at $6.64. To achieve this feat, the bulls must accumulate above $6.

    On the other hand hand, if the bearish trend continues, TON may slip below $5 to test its pivot point at $4.46.

    3. Tron (TRX)

    Tron experienced a lot of bullish push during the previous week as Justin Sun continued his bullish escapades. As a result, the asset gained over 9% and hit a peak of $0.12 for the first time in almost fourteen days.

    However, it failed to continue the bullish trend, as it is currently down by over 2% on the weekly scale. During the previous intraday session, it attempted $0.11 but met support and rebounded. The same is playing out during the current session. The asset rebounded at its prior low and is exchanging at its previous low.

    RSI is at the same level as the previous day in response to the most recent trend. However, MACD is hinting at further price declines. The 12-day EMA halted its ascent and will start a downtrend if the TRX has a bearish close today.

    The chart pattern is also printed as a bear flag due to the previous bullish trend. Traditionally, following the bearish pattern, the asset will experience significant declines. Based on previous price movements, the asset may retrace to as low as $0.115 this week and continue downwards. If the current selloff worsens, it may drop as low as $0.110.
    4. Hedera (HBAR)

    During the previous week, Hedera displayed a lot of volatility. This came as it enjoyed a massive push from fundamentals. Rumors of the asset getting a new use case with BlackRock made waves. According to the reports, the asset managers were going to use the project to tokenize some real-world assets.

    In response, it surged by over 73% in 24 hours. The firm refuted the claim the next day, and HBAR retracted it following the announcement.

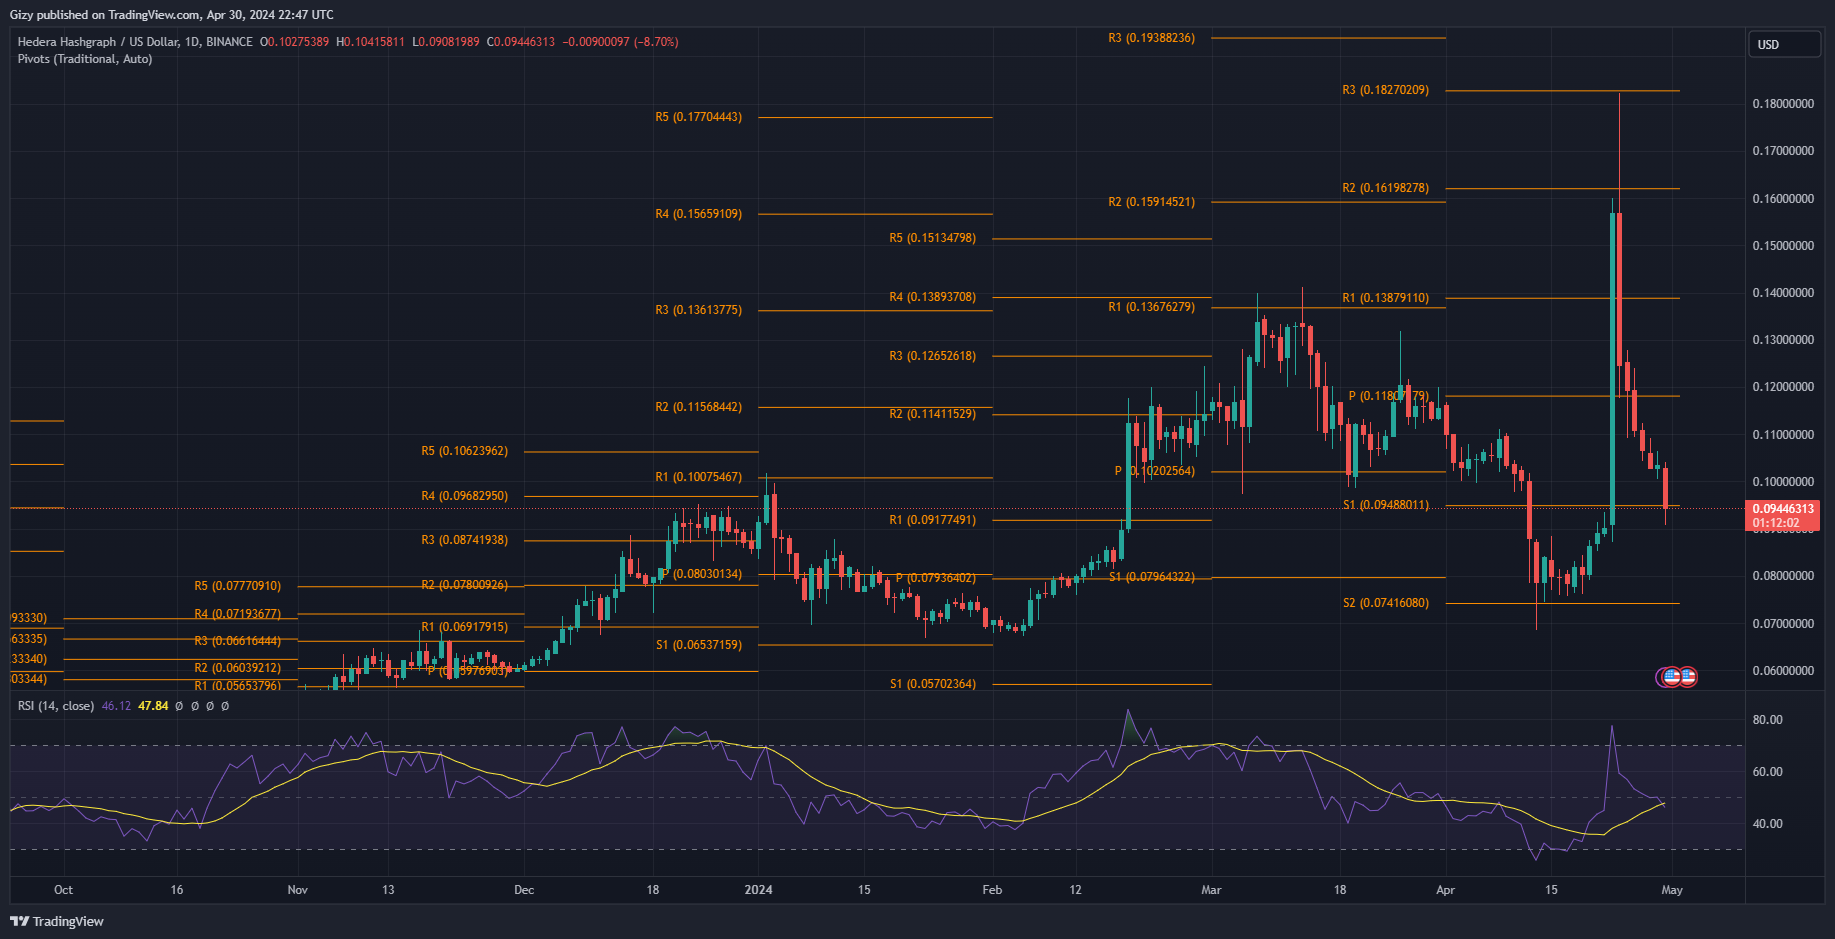
    It showed minor signs of recovery during the previous intraday session but failed to hold the uptick as prices retraced. It has not made any positive moves since the current session started, as it is seeing one of its most significant declines.

    It is currently down by over 9%, exchanging below its first pivot support at $0.94. The relative strength index suggests room for further decline as it is at 45, giving the bears an advantage. If the downtrend continues, the token will return to its previous low at $0.074.

    Nonetheless, the bulls will attempt recovery. If the market trajectory changes, they may push for a retest of $0.11 in the coming day.

    5. Bonk (BONK)

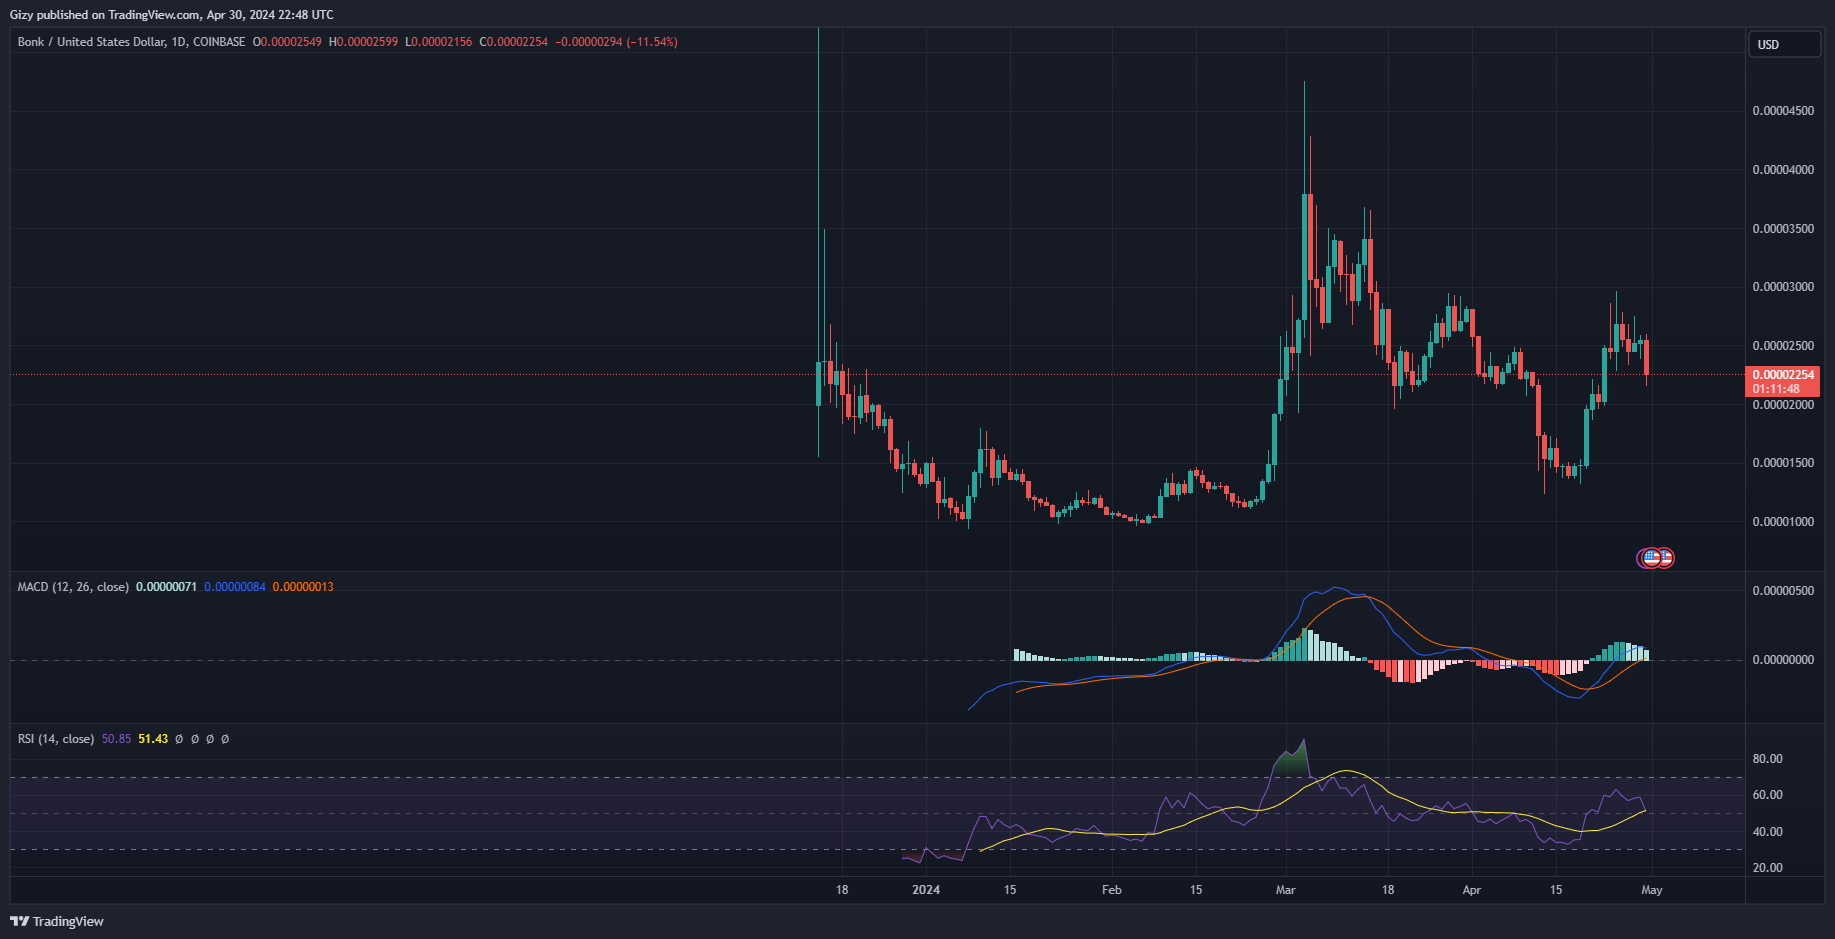
    Bonk is currently on the decline and shows no signs of recovery. The bulls attempted a buyback during the previous intraday session, as the coin retraced to a low of $0.000023 but closed at its opening price.

    Currently down by over 11%, the token rebounded from a low of $0.000021. A closer look at the moving average convergence divergence suggests a continuation of the downtrend. The 12-day EMA is heading downhill and will intercept the 26-day EMA in bearish convergence

    Nonetheless, the coin is trading above the 50-day EMA, which means it is still maintaining its bullish posture. This could spell out a possible recovery for the asset. It will return and look to climb above $0.000025.

  • Top Five Cryptocurrency to Watch This Week (Apr 22)

    Top Five Cryptocurrency to Watch This Week (Apr 22)

    With the halving over, the cryptocurrency market is picking up momentum. As a result, several cryptocurrencies are on the uptrend as they return to their fourteen-day high. One such is HBAR . The asset gained over 50% in the last seven days.

    The global cryptocurrency market cap gained over 5% during this period as it is currently worth $2.45 trillion. The industry enjoyed a lot of attention as several bullish fundamentals made the news. One such is that post-halving, Bitcoin will see a huge demand increase.
    The apex coin is consolidating gains at this time. As a result, some alts are seeing a significant boost. Will it last through the week?

    Top Five Cryptocurrencies

    1. Bitcoin (BTC)

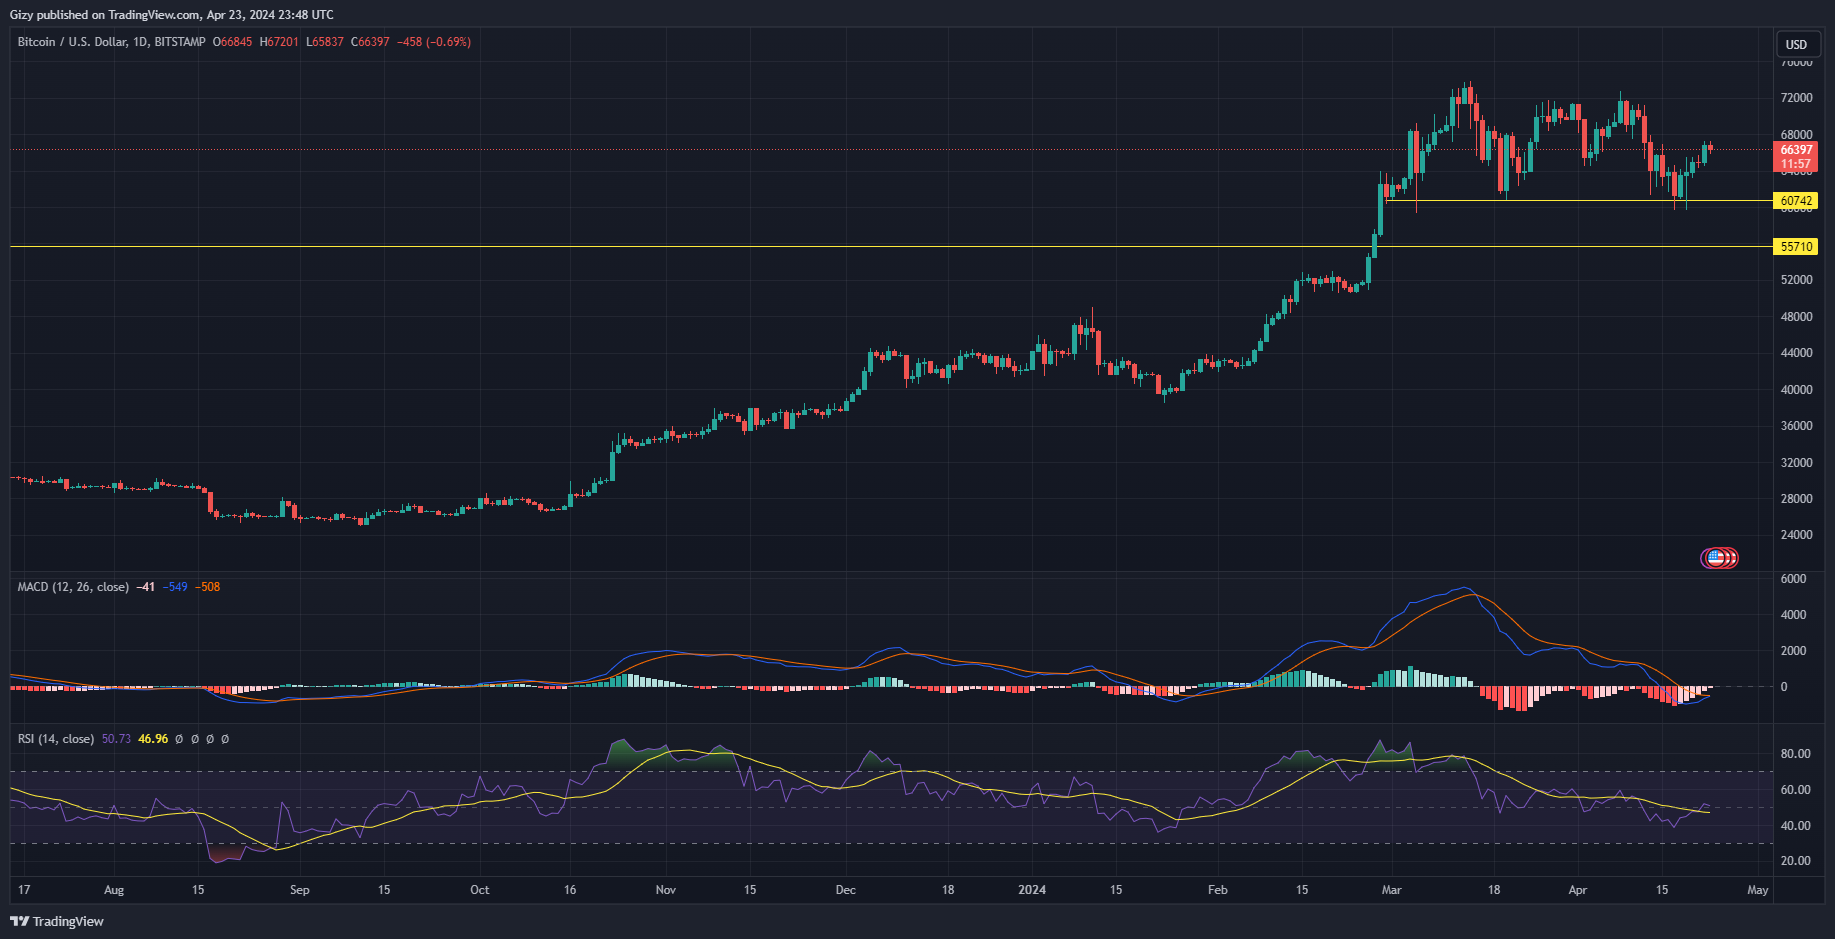
    Thursday marked the start of the current uptrend BTC is experiencing. Following small pauses, it reclaimed $66k. The coin added $1,900 which was almost 3% during the previous intraday session as it returned to the level.

    However, the previous day’s action reveals an emerging price pattern. Since the uptrend started, bitcoin had one day of little or no price changes, followed by one with notable improvement in price. If this holds, it will experience another bullish performance in the next 24 hours. The largest cryptocurrency will attempt its pivot point at $68,131.

    The moving average convergence divergence is printing bullish signals. At the time of writing, the 12-day EMA is in contact with the 26-day EMA. With an impending bullish divergence on the horizon, the coin is set for further climb. The histogram associated with matric shows that the bears have almost lost initiative on the BTC as there is almost no selling pressure.

    A few hours ago, many observers were shocked to see Grayscale only sold one bitcoin today. With one of the biggest sellers reducing its volume, the apex coin will register another notable move within the next five days.

    2. Ethereum (ETH)

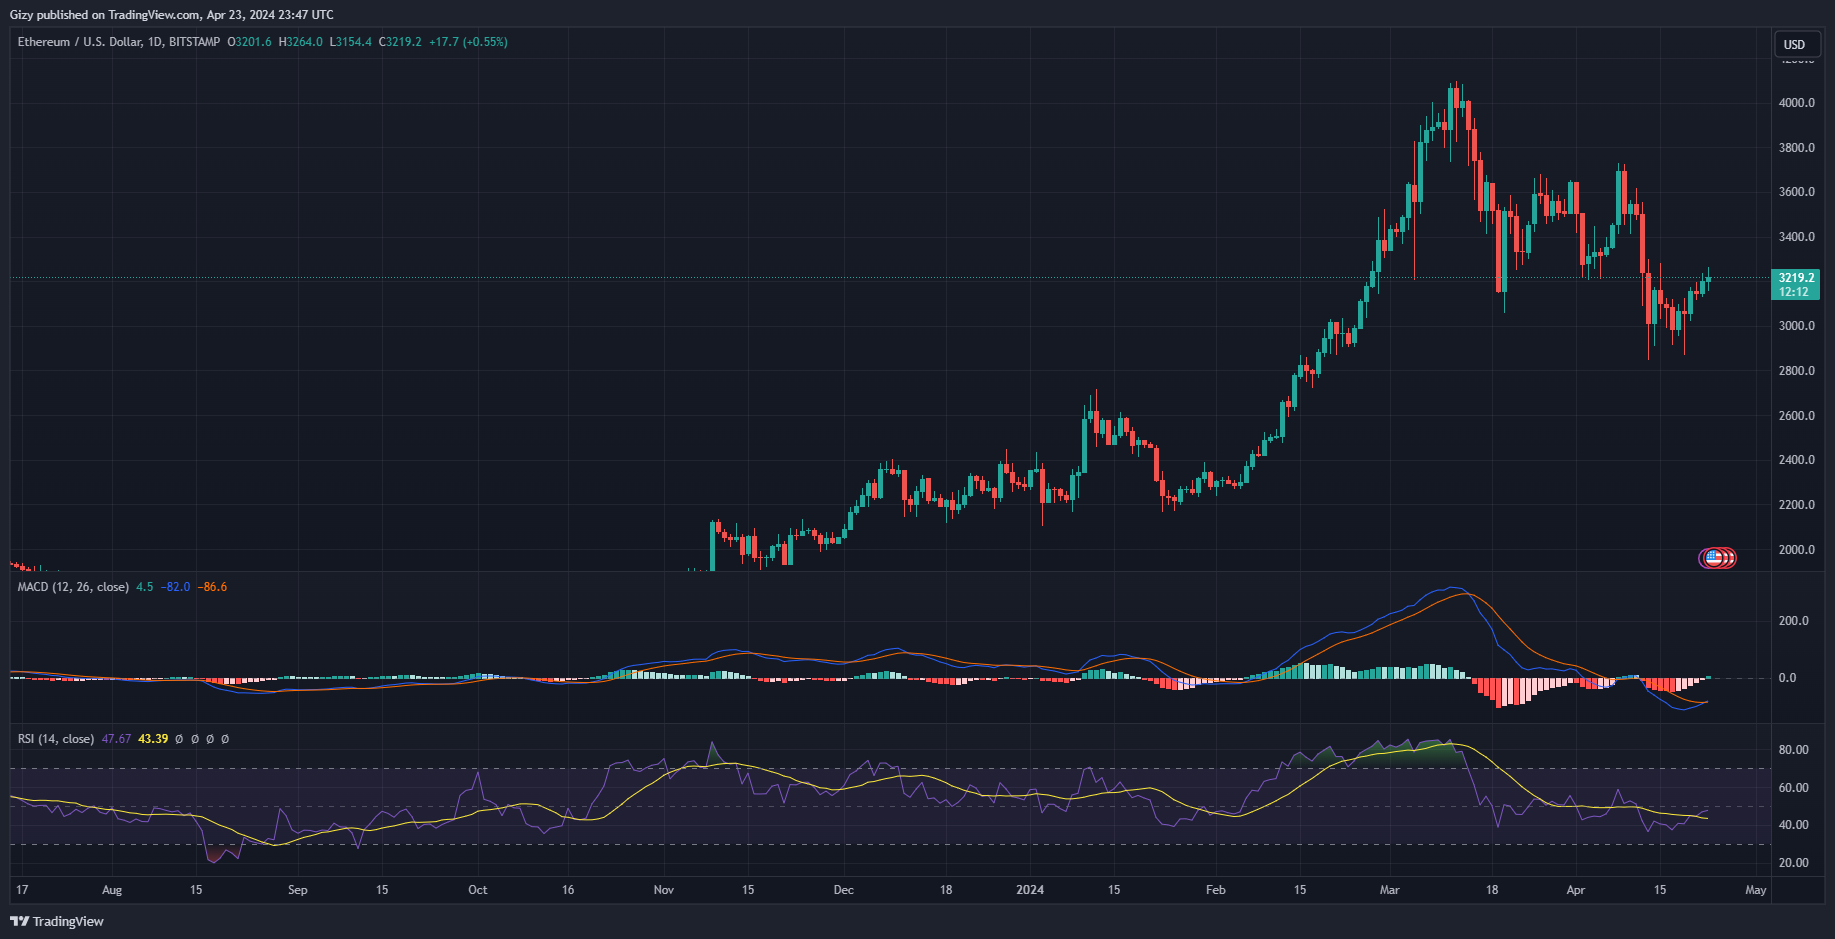
    Ethereum is printing a doji at the time of writing. It is currently struggling at $3,200 after it peaked at $3,260. The candle and price action illustrated the continuation a trend of a day with significant move and another with a doji. The trend has been in play since last Thursday and may continue as indicators are hinting further price increases.

    The doji also suggests that the altcoin is gearing up for a surge as MACD’s histogram flipped fully bullish with the first green bar in over seven days. However, ETH trading volume is down by over 7% in the last 24 hours. Nonetheless, MACD is displaying an incomplete bullish divergence which puts the bulls at an advantage.  Although below 50, RSI is also on the rise and is at 47 .in response to buying pressure

    The coin is currently trading at a critical level. The $3,200 served as a critical support where the bulls built demand concentration previously. Since losing it, the bears are staging selloff around the mark. Flipping and gaining stability above the said mark will result in an attempt at $3,400. However, there are strong indications of a small demand shock taking above $3,300.

    3. Binance Coin (BNB)

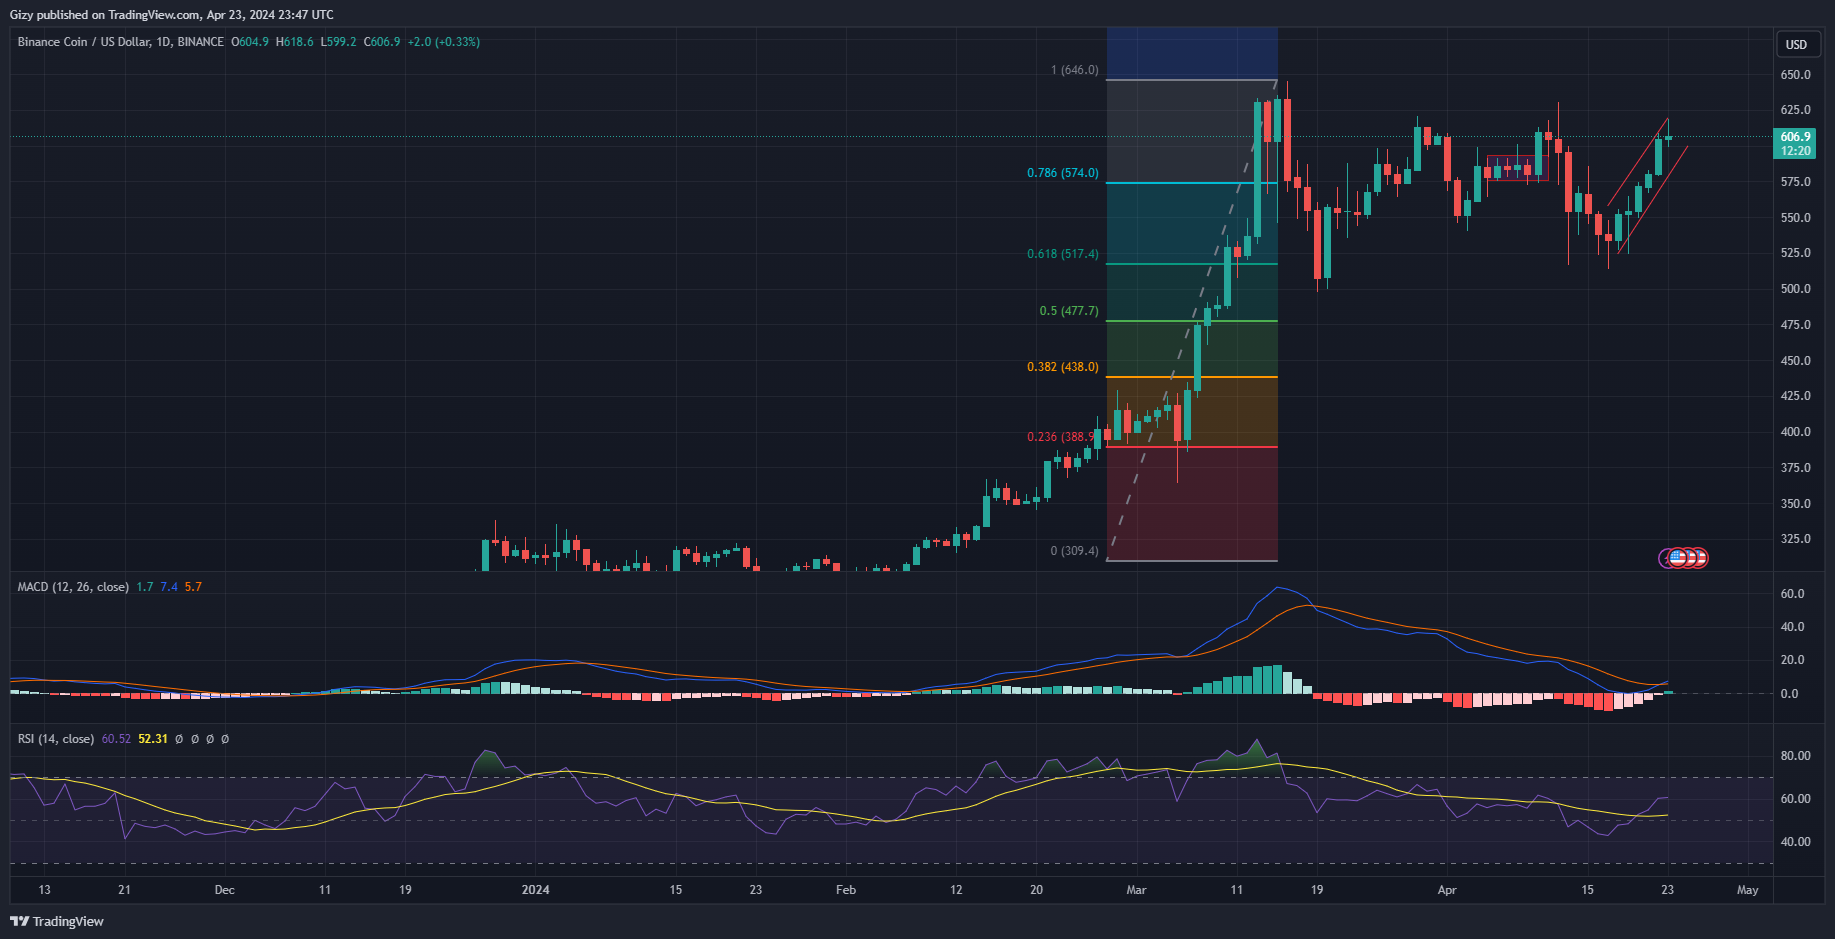
    Binance coin is on a bullish streak and has been on the uptrend since Thursday. As a result, it gained 15% over the last five days. However, it is unable to continue the uptrend despite the over 6% increase in trading volume over the last 24 hours.

    RSI points to a small increase in selling volume as the culprit for the current price action as the coin is printing a doji. The candlestick may also be an indication of an impending downtrend as the bulls agree grinding to a halt. Additionally,  the asset is printing a bear flag following its previous trend.

    The question is if the coin has peaked and if the declines will start this week. MACD is printing buy signals at this time. In response to the growing demand in the market, the histogram flipped green. Aside from MACD’s histogram, the 12-day EMA and 26-day EMA are diverging following a bullish convergence.

    These are indications of the continuation of the bullish action. Per previous price movement, BNB retraced from a resistance it flipped once in the last fourteen days. The bulls will look to flip this mark and attempt to gain stability above $625. This is another critical level where the bears stage significant selloffs. Nonetheless, breaking above this mark will guarantee a retest of $650.

    However, Fibonacci retracement is pointing to a possible recline to $574.

    4. Avalanche (AVAX)

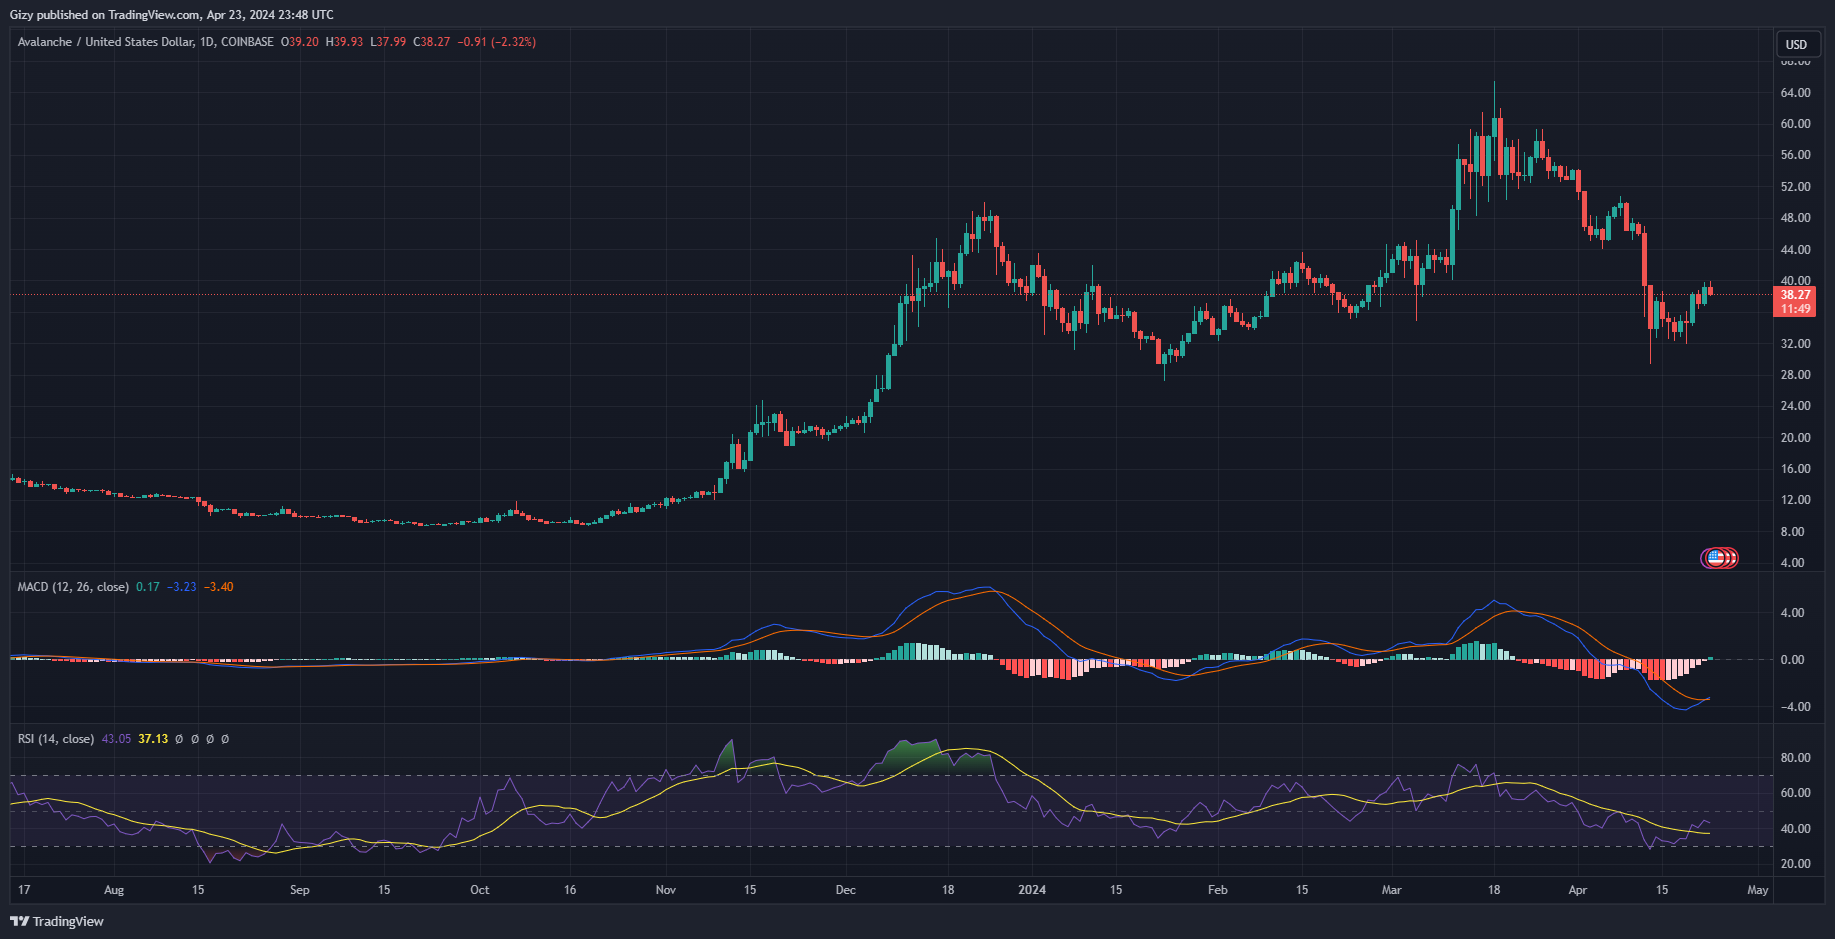
    Avalanche experienced significant price increases over the last seven days. As a result, it is up by over 15% over this period. There was no indication of fundamentals playing any significant role in the surge, which means it experienced the same bullish sentiment the crypto market saw at the time.

    With a mixed general sentiment, AVAX is printing a red candle as it is down by over 2% in the last 24 hours. Using the Fibonacci retracement to draw up support and resistance, the coin will look to gain stability above $39 and attempt $40 within the next five days. However, RSI is on the downtrend and at 43, placing the bears at an advantage and hinting at mounting selling pressure.

    Fibonacci retracement is hinting at a possible drop to $33. This will happen if the bulls fail to defend the $36 support.

    On the other hand, the moving average convergence divergence is printing buy signals at this time. The metric shows the asset had a bullish divergence which will result in further uptrends. MACD’s histogram is also on the bullish side as it is green.

    5. Pepe (PEPE)

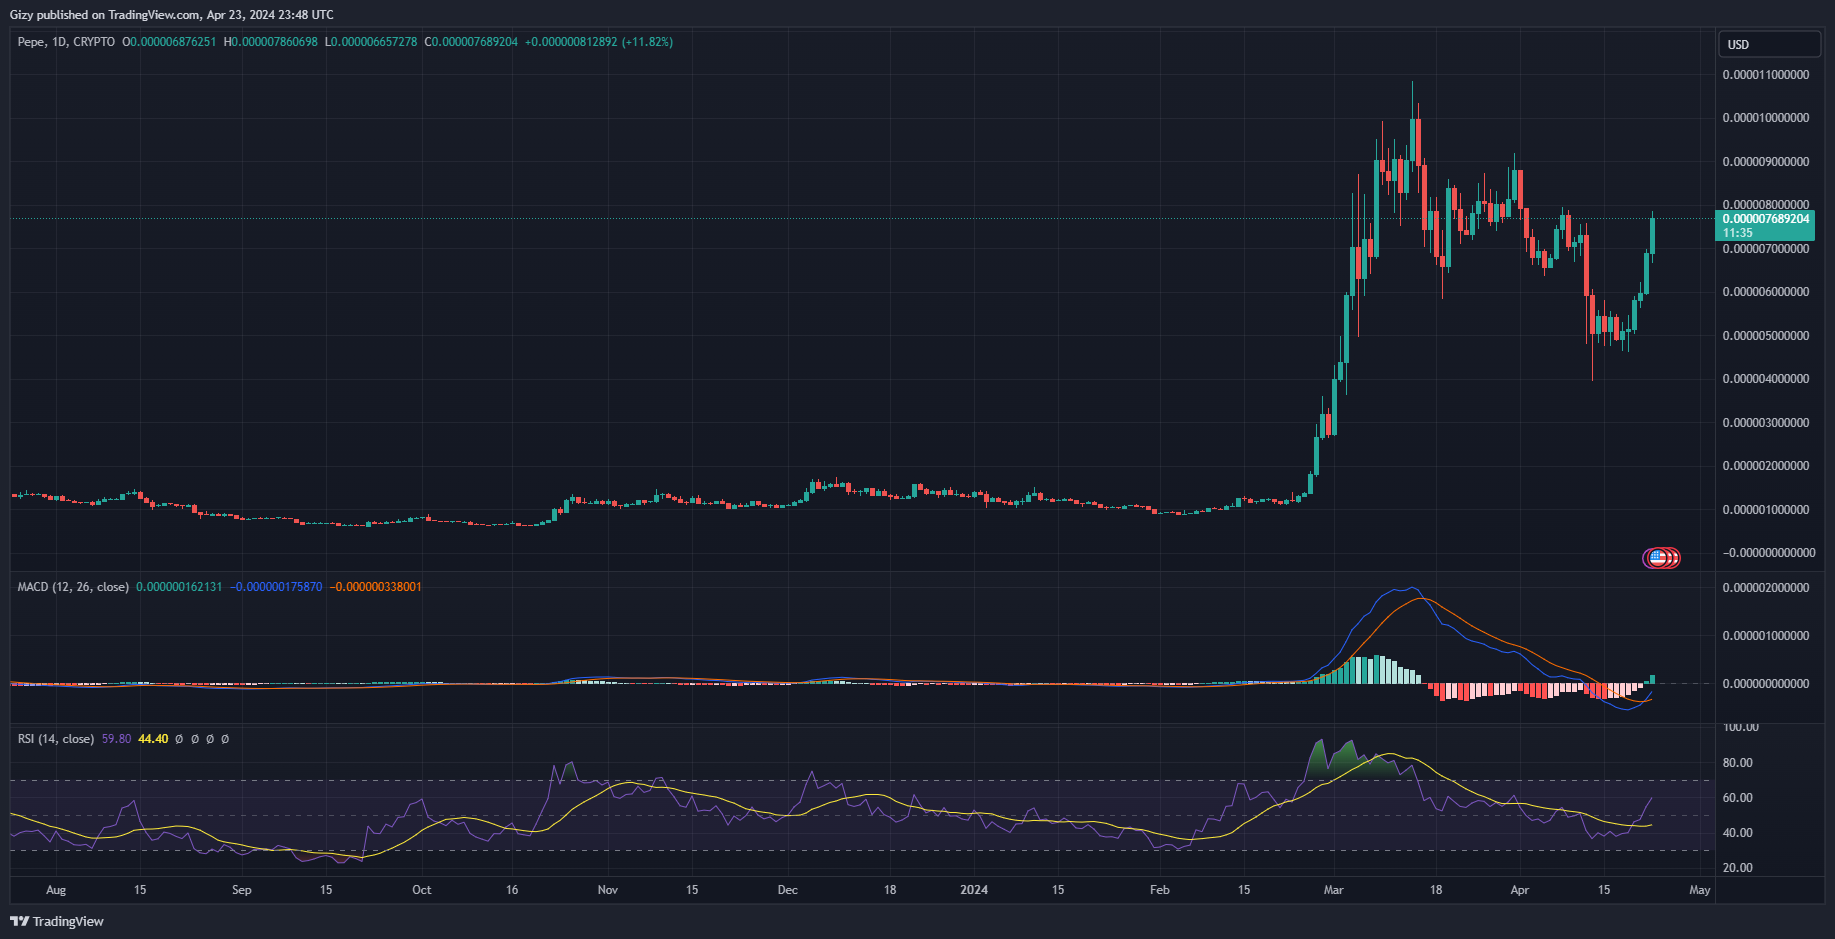
    PEPE is currently up by more than 15%. Since Thursday, it has been on an uptrend and gained over 50% in the last six days with a prospect seeing more increases. The current intraday session is a continuation of the price climb.

    The altcoin is up by over 11% following a 15% surge during the previous day. However, MACD is hinting at more increases. The indicator shows that the asset had a bullish divergence a few days ago. With RSI still on the uptrend, the bulls are gearing up for more uptrends.

    Having gained stability above the 0.0000077, the coin will to retest $0.0000090 within the next five days. However, a change in market trajectory will send it trading as low as $0.0000066.

  • Crypto Analysis 21/04: BTC, ETH, BNB, SOL, XRP, DOGE, TON

    Crypto Analysis 21/04: BTC, ETH, BNB, SOL, XRP, DOGE, TON

    BTC prices over the last seven days was filled with a lot of volatility. During this period, the asset remained range-bound and failed to breakout. Nonetheless, it saw small changes in prices.

    This trend closely mimics that of the global cryptocurrency market cap. Currently at $2.38 trillion, there was no notable change in value over the last 24 hours.

    The much anticipated Bitcoin halving took place and is gradually coming to an end. Many BTC proponents were dissatisfied with how prices went and took to X to express themselves. They faulted ETFs as one of the reasons for the slow surge in prices.

    The news on Solana also gained momentum. The project issued a new version for general use to reduce network congestion.

    Other events with regard to prices took place. Let’s see how some assets in the top 10 performed.

    1. Bitcoin (BTC)

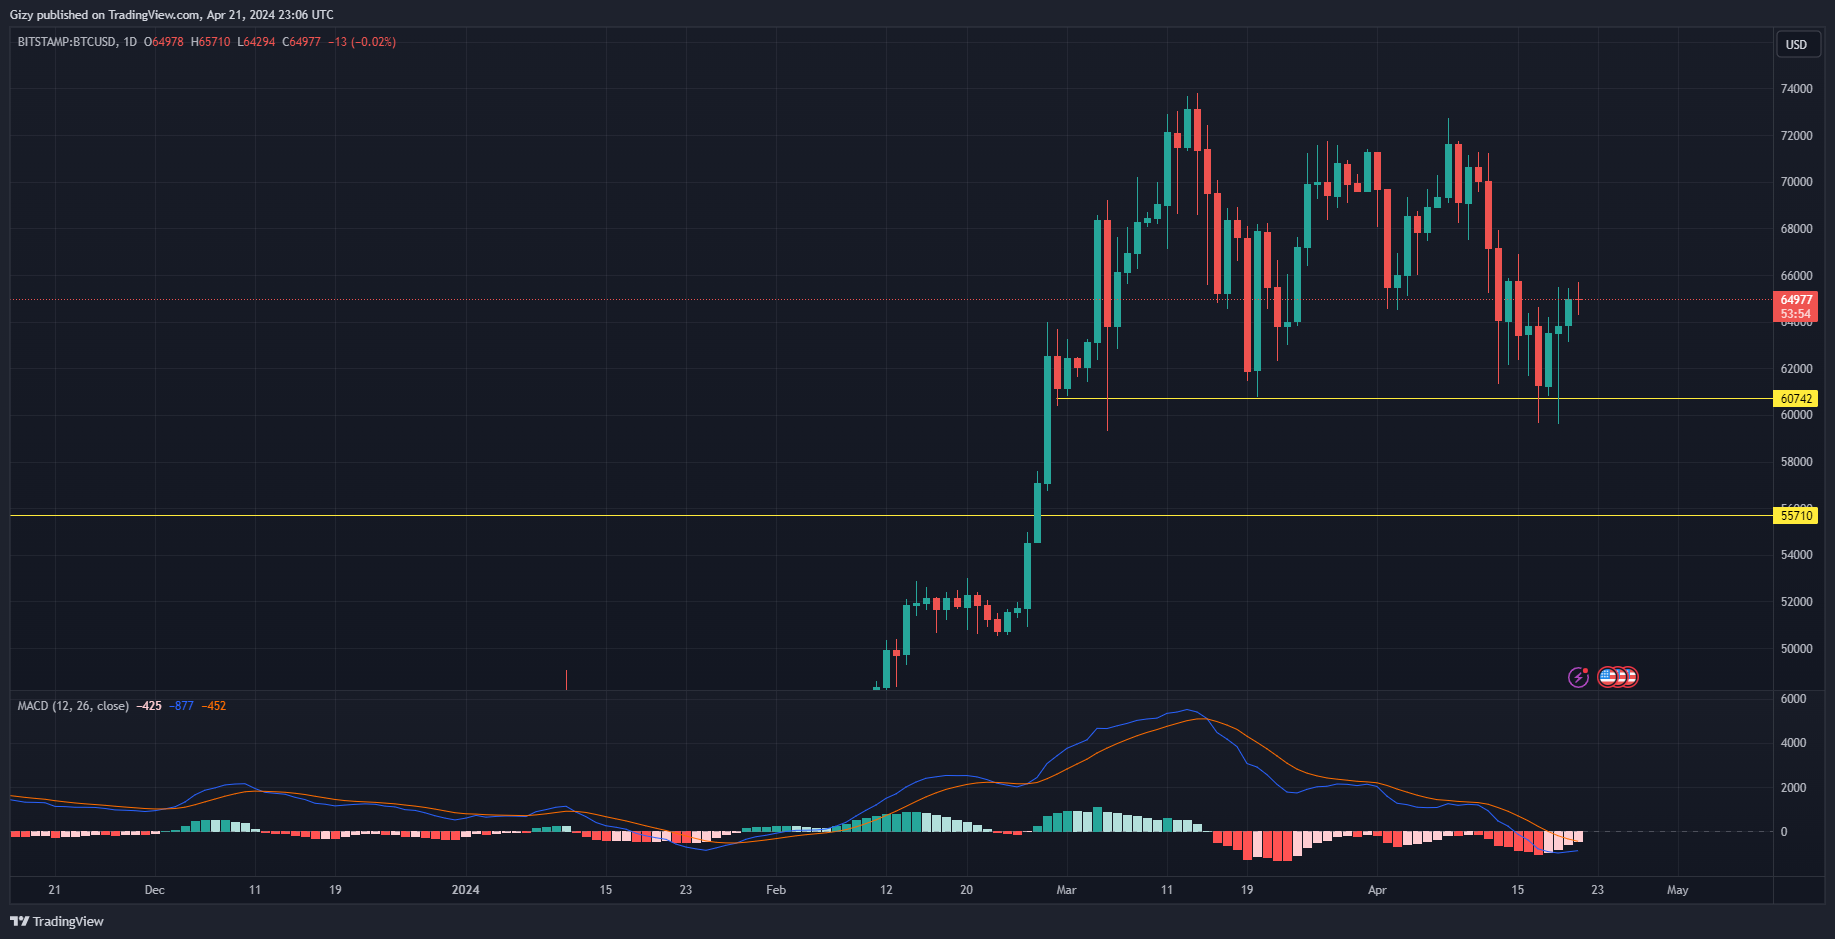
    Bitcoin saw three consecutive greens as the anticipation for the halving grew. During this period, it gained over 5% as it climbed to a high of $65,600. Regardless of the small bullish moments it saw, it will end the current with losses of almost 2%.

    Currently printing a red candle, the apex coin is experiencing a small selloff following the notable gains it had. The decline came after it surged to a high of $65,710 and retraced due to small rejections. While the market is largely silent about the most recent moves, indicators are hinting at the resumption of the uptrend.

    The moving average convergence divergence is printing buy signals at this time. The 12-day EMA is trending flat. However, the 26-day EMA is on a downtrend and will intercept its counterpart in a bullish convergence. Additionally, RSI readings show that in light of the small price decline, the apex coin is seeing a healthy amount of buying pressure.

    A close above $65k today will offer the bulls more leverage to stir clear off $62k. Nonetheless, the previous price movement points to a possible correction below $64k. The buyers will look to flip BTC’s seven-day high at $66k to trigger a breakout.

    2. Ethereum (ETH)

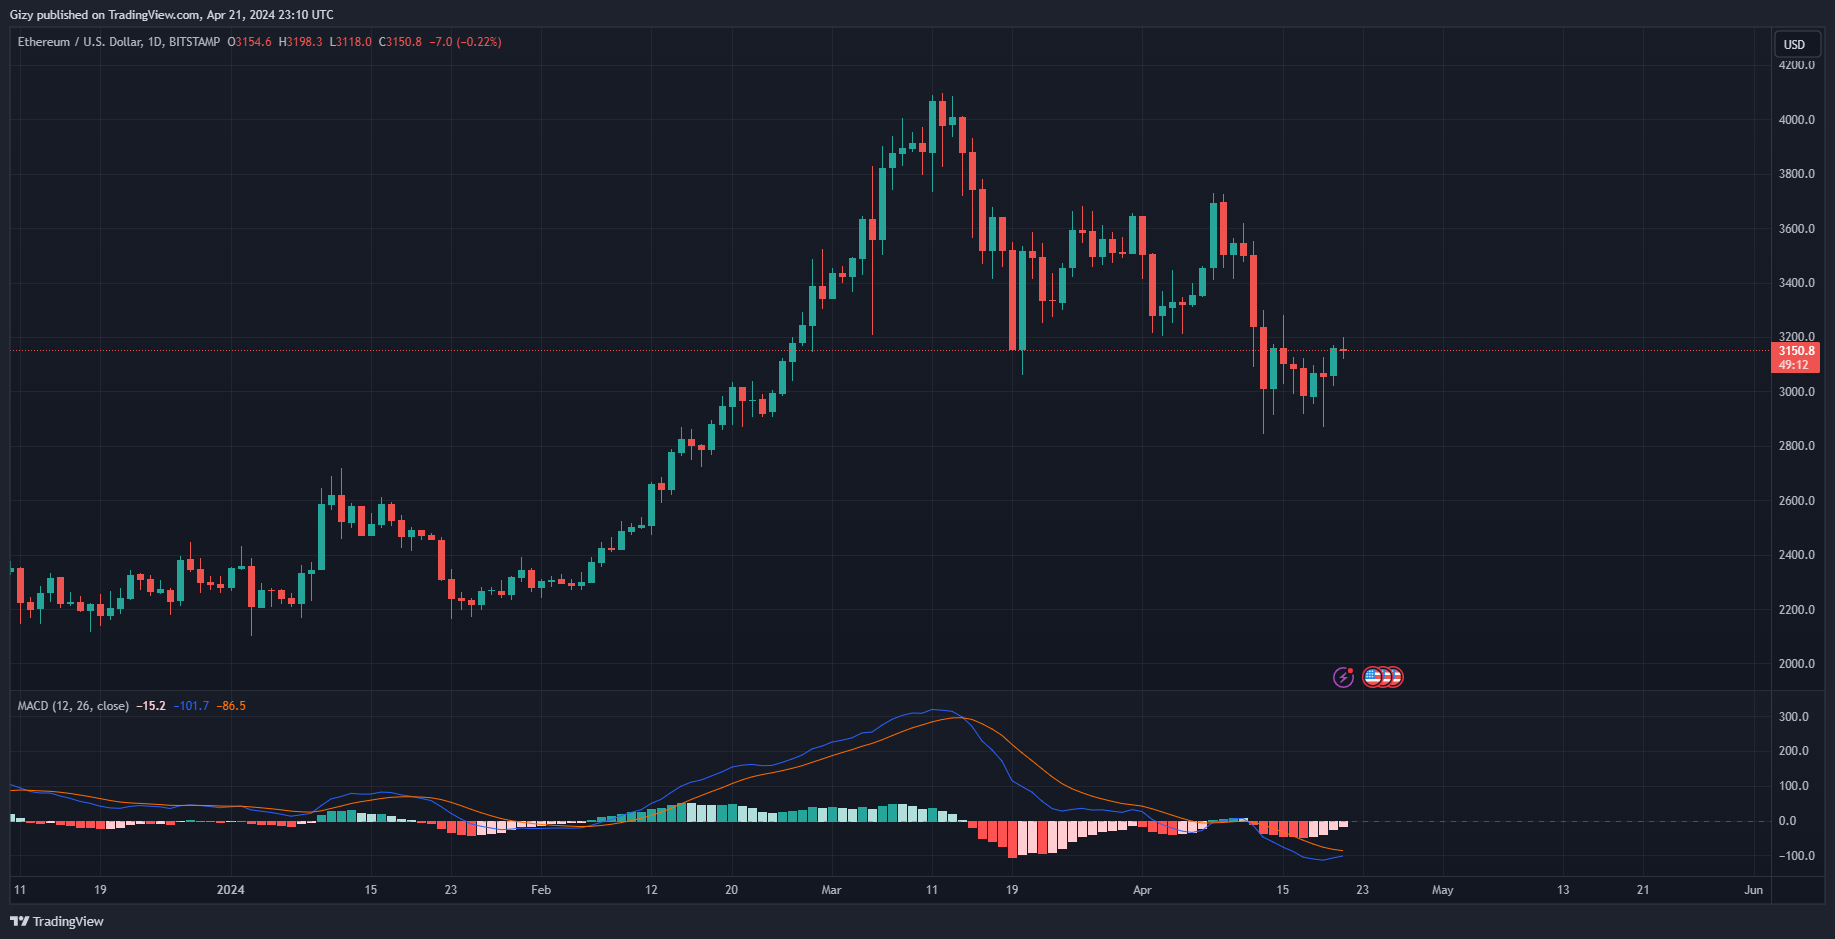
    Ether is struggling with a small price decline after a failed attempt at $3,200. Currently printing a doji, the coin is yet to register any significant changes in value at this time. This is also the same candlestick it is printing on the weekly scale as it surged to a high of $3,280 and dropped to a low of $2,867 and is still trading close to its opening price.

    Nonetheless, indicators like MACD and RSI are hinting at an impending breakout. In the last three days, the coin gained almost 6%. Due to this, the 12-day EMA is on an uptrend. The metric is near the 26-day EMA which indicates an impending bullish divergence within the next 48 hours. The relative strength index also maintained it bullish posture.

    With ETH experiencing notable buying pressure, the bulls will look to sustain the current pressure. A close at the current price will offer them an advantage to break the $3,200 resistance and attempt $3,400.

    However, the bears will look to continue the previous trend and stage a selloff at $3,200. Previous price movement also points to another price struggle after ether flips $3,300

    3.  Binance Coin (BNB)

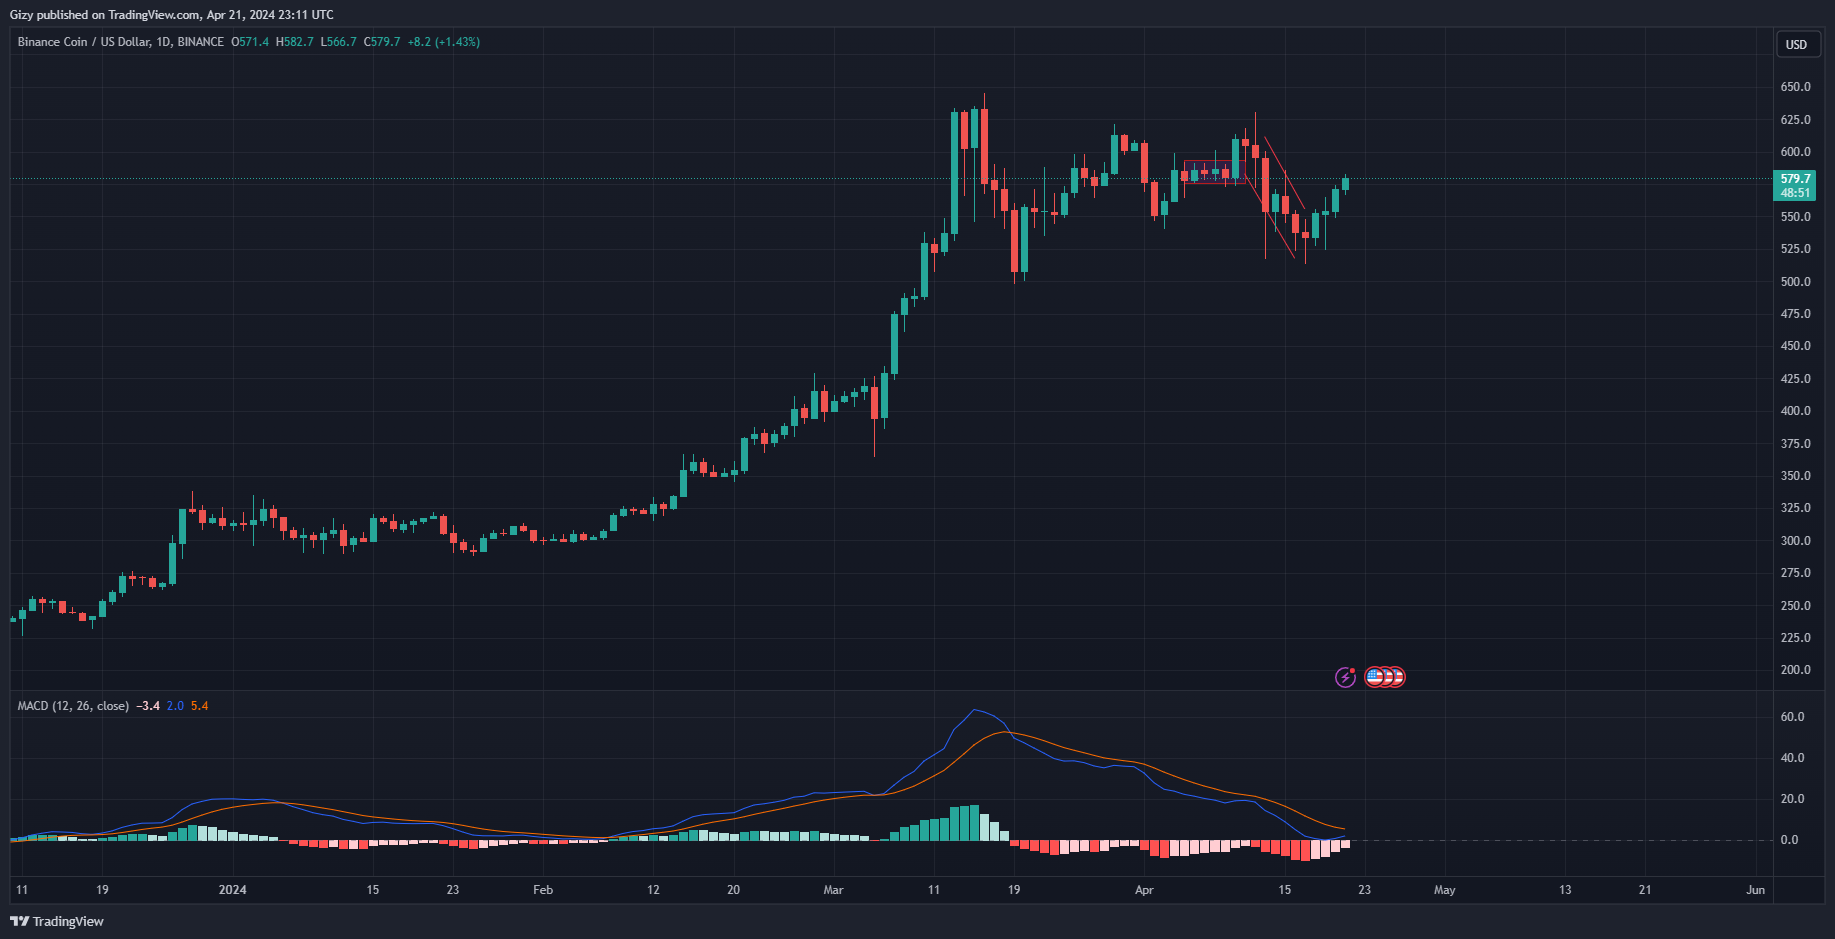
    A green close during the current intraday session will mark the fourth consecutive for the asset. It’s been on an uptrend since Thursday as BTC and the rest of the crypto market picked up momentum. As a result, on the weekly scale, it is printing gains of over 2%.

    With the huge volatility the asset enjoyed in the last seven days, indicators are moving accordingly. For example, MACD is printing buy signals at this time. The histogram associated with it is showing a reduction in selling pressure as the volume gradually reduces. This is the same reading on RSI as it goes above 50 for the first time in last seven days.

    Additionally, the 12-day EMA and 26-day EMA are gradually bridging the gap between them. In the ongoing bullish convergence, both EMAs will intercept within the next 48 hours if the bulls keep up the current buying pressure.

    However, the bears will attempt to stage a selloff at $600. This will place BNB in its previous trend of trading within the $579 and $600. Nonetheless, the readings from indicators put the bulls at an advantage as they are gearing to flip this trend. They will attempt to build enough demand concentration at $580 before a breakout.

    4. Solana (SOL)

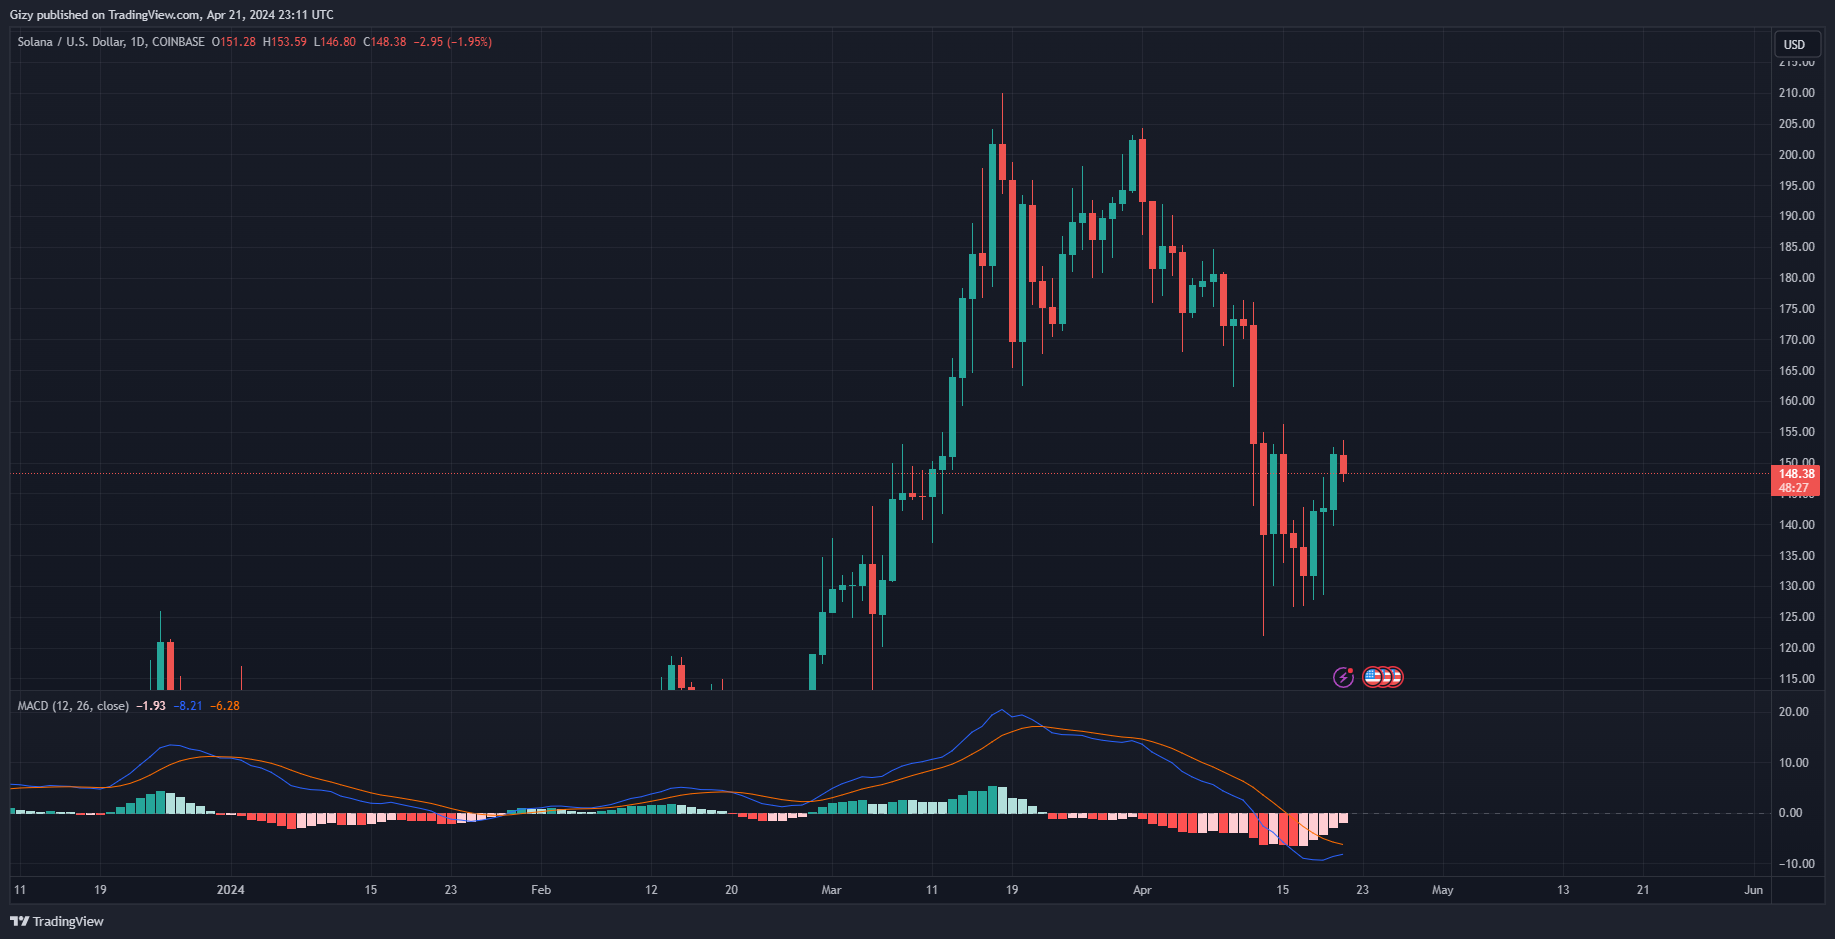
    Solana experienced an almost 8% increase on Thursday following the announcement of a possible fix to it congestion issues. Trading volume surged by over 20% in response and the asset ended the day above $140. However, due to the three-day decline at the start of the week, it is yet to register any notable price improvement on the weekly scale.

    Currently struggling at $150, it is printing a red candle which may mean more price decline in the coming hour. The Accumulation and Distribution chart also depicts a possible decline in buying pressure and an equal price correlation.

    However, the moving average convergence divergence hints at a change in price trajectory. With the histogram turning pink showing a gradual decline in selling pressure, it also shows a steady rise in buying volume. The result is the small uptrend the 12-day EMA is seeing. In the coming week, SOL will see a bullish divergence.

    In response, it will attempt to break $152. The current price decrease indicates that the bulls are gradually building demand concentration at $148. Sustaining prices within this region will offer the needed momentum to break $160.

    It is also worth noting that the candlesticks pattern suggests that the asset had a bull flag and the the coin will see the effect in the coming days.

    5. XRP

    XRP spent the last seven days recovering from the previous week’s price decline. A notable trend during this period is the number of doji as it attempted to hold prices at a level. Following several drops to $0.46, it recovered and ended the day close to $0.49.

    The previous day depicts a change in the altcoin movement. It gained over 5% as it returned $0.53. Nonetheless, the chart suggests that it is seeing small increase in selling pressure as it is struggling to keep prices above $0.52. It is worth noting that the current price is the first pivot support. Due to this, the coin must build momentum before testing the next critical mark.

    RSI points a gradual decrease in buying pressure as it places the bears at an advantage. Still below 50, the metric is resuming its downtrend. However, MACD shows that XRP is maintaining its bullish trajectory. With both EMAs closing the gap between them, a bullish convergence is underway. Charts predict a divergence in the next 24 hours.

    If this happens, the asset will bounce off $0.52 to reclaim $0.55. Based on previous price movements, there are no strong resistances until $0.57.

    6. Dogecoin (DOGE)

    DOGE joins the list of assets printing a red candle as it saw small losses. It failed to breakout from its seven-day high at $0.16. Nonetheless, before the current price struggles, it experienced a three-day hike that saw it over 7%. However, on the weekly scale, the asset is down by over 2%.

    The bulls are accumulating around $0.16. Aside from price lingering around this mark, MACD suggests an impending uptrend in the coming days. The 12-day EMA is currently trending flat as the 26-day EMA continues its descent. With the ongoing bullish convergence, the coin must maintain the buying pressure it’s seeing to prevent further downtrends.

    This is also what RSI hints as it is below 50 which places the bears at an advantage. The metric halted its uptrend due to the most recent change in trajectory. Nonetheless, MACD’s histogram points at a gradual decrease in selling volume which may explain the most recent slight decrease.

    The bulls will look to continue accumulation in anticipation of a trigger. Following the introduction of the expected catalyst, the coin will flip $0.17. However, the bears staged selloffs around the mark more than once in the last seven days.

    7. Toncoin (TON)

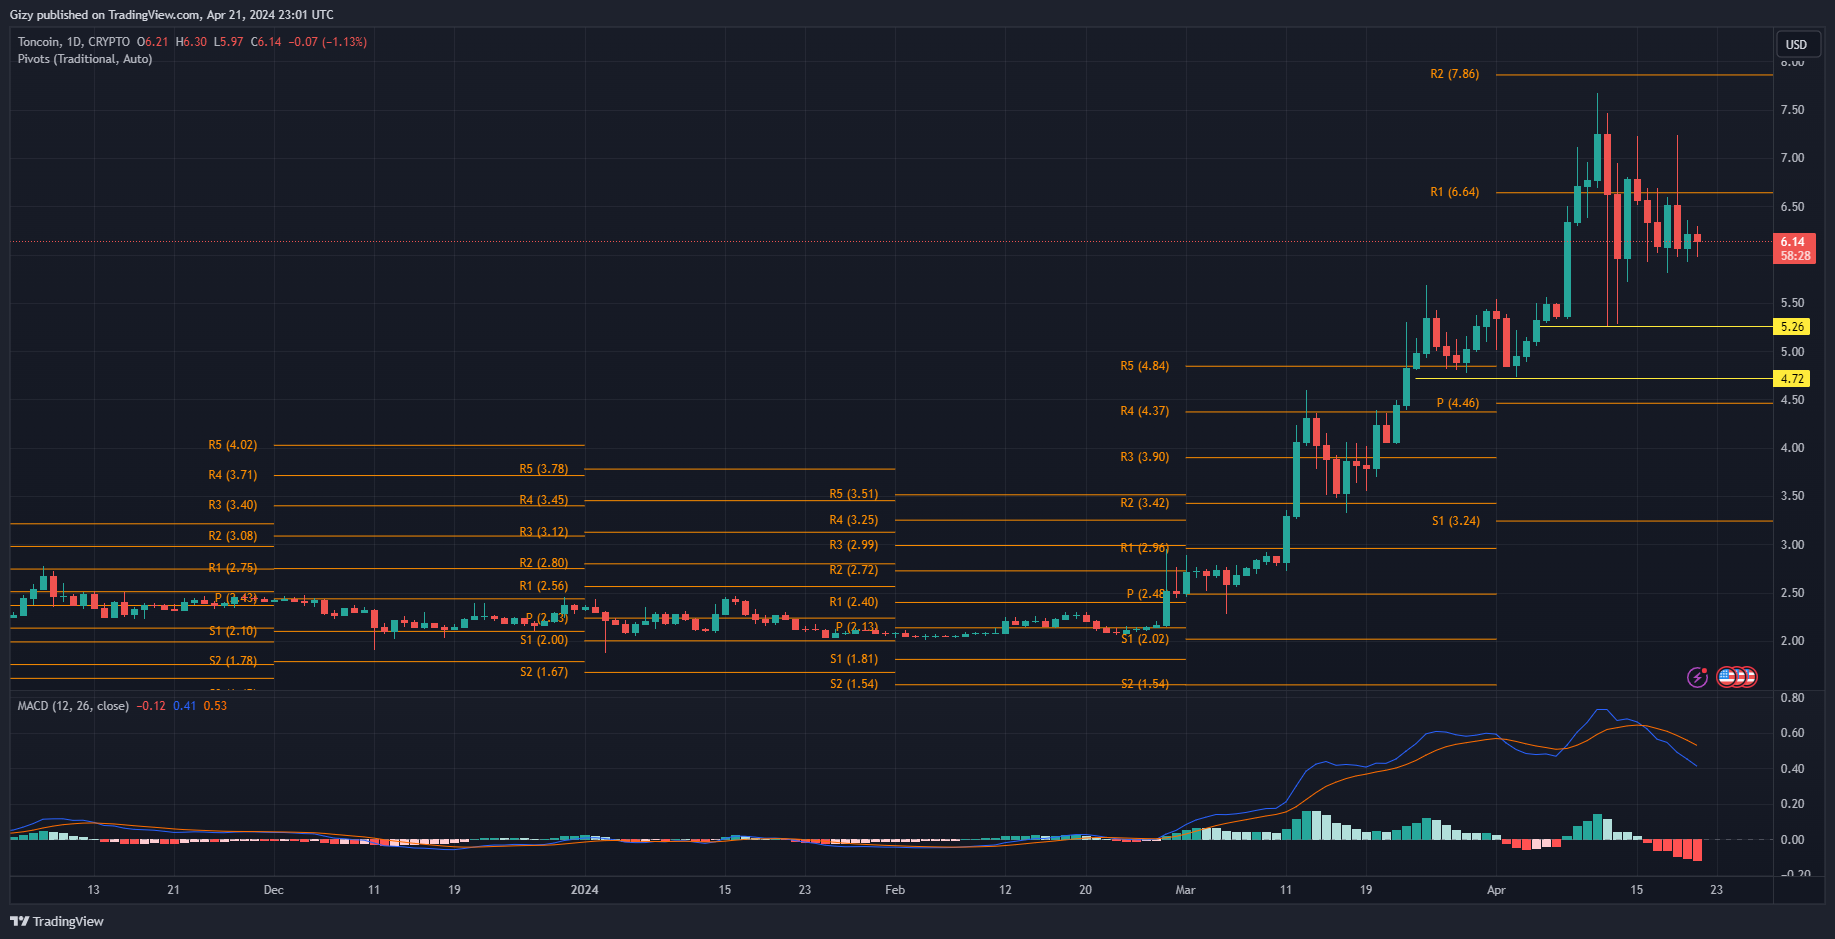
    Toncoin continues price struggle at $6.14. It is down by over 9% on the weekly scale and indicators are hinting at further price decline.

    The moving average convergence divergence is on the downtrend and showing no signs of recovering selling pressure increases. This is the same reading on RSI as it goes lower and is at 53 in response to the growing bearish actions.

    With indicators putting the bears at an advantage, they may continue the selloff and send TON as low as $5.26. On the other hand, the bulls will attempt to stage a buyback at the said mark.

  • Top Five Cryptocurrencies to Watch This Week (April 15)

    Top Five Cryptocurrencies to Watch This Week (April 15)

    Most cryptocurrencies are grappling the effect of the largest price decline they suffered last week. While some are attempting recovery, others are yet to make such attempts.

    This trend also reflected in the global cryptocurrency market cap as it is down by almost 5%. Currently worth $2.31 trillion, the market lost almost 10% over the last seven days. The main catalysts were two events that rocked not just the crypto market but traditional stocks as well.

    The first major decline took place after JPMorgan announced its decline in net profit during the first quarter. Stocks like S&P saw a more than 2% decline following this announcement. It also spewed into the crypto market.

    The Iranian-Israeli conflict also spread panic among traders as many feared WW3. From all indications, most cryptocurrencies are yet to recover from the effects of these events. How will they perform this week?

    Top Five Cryptocurrencies to Watch

    1. Bitcoin (BTC)

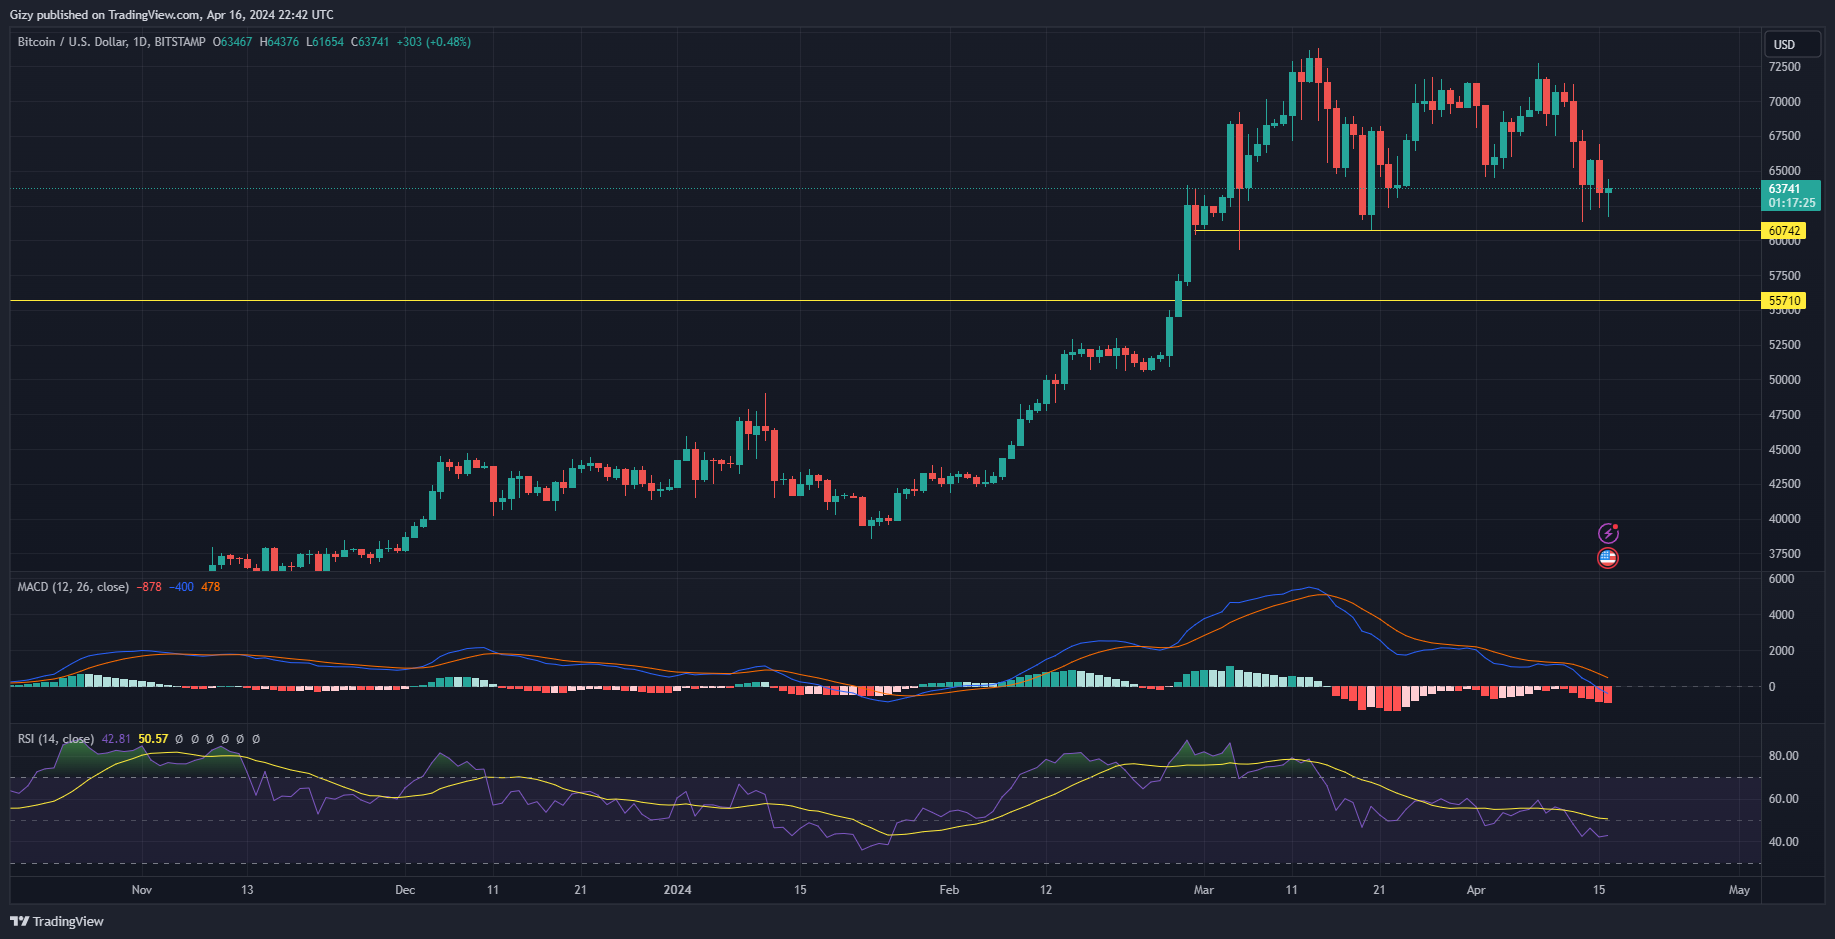
    Bitcoin lost over 5% during the previous week. It dropped to a low of $61,308 as the downtrend bit harder. It also briefly broke the $71,500 resistance and sparked hopes of a return to a new ATH. All this faded following the two-day decline.

    Currently printing a green candle, the apex coin is seeing notable buybacks. This comes after it retraced to a low of $61,654 some hours ago. A close with a hammer candlestick may result in the top coin seeing significant price increases within the next five days. It will also mean a retest of the $67,500 resistance.

    The Relative Strength Index is hinting at a bullish outcome this week. A closer shows a gradual hike in the metric as it is 42, a little above its previous day’s reading. This shows the asset is seeing significant buying pressure which may enable the p=above predictions.

    However, the Moving Average Convergence Divergence is showing no signs of a trend reversal as the 12-EMA continues downwards. It is currently below 0 suggesting a further price decline such as the level BTC experienced mid-January.

    If this happens the apex coin is bound to retest $60,500. A flip could send it to sub-$60k within the next five days.

    2. Solana (SOL)

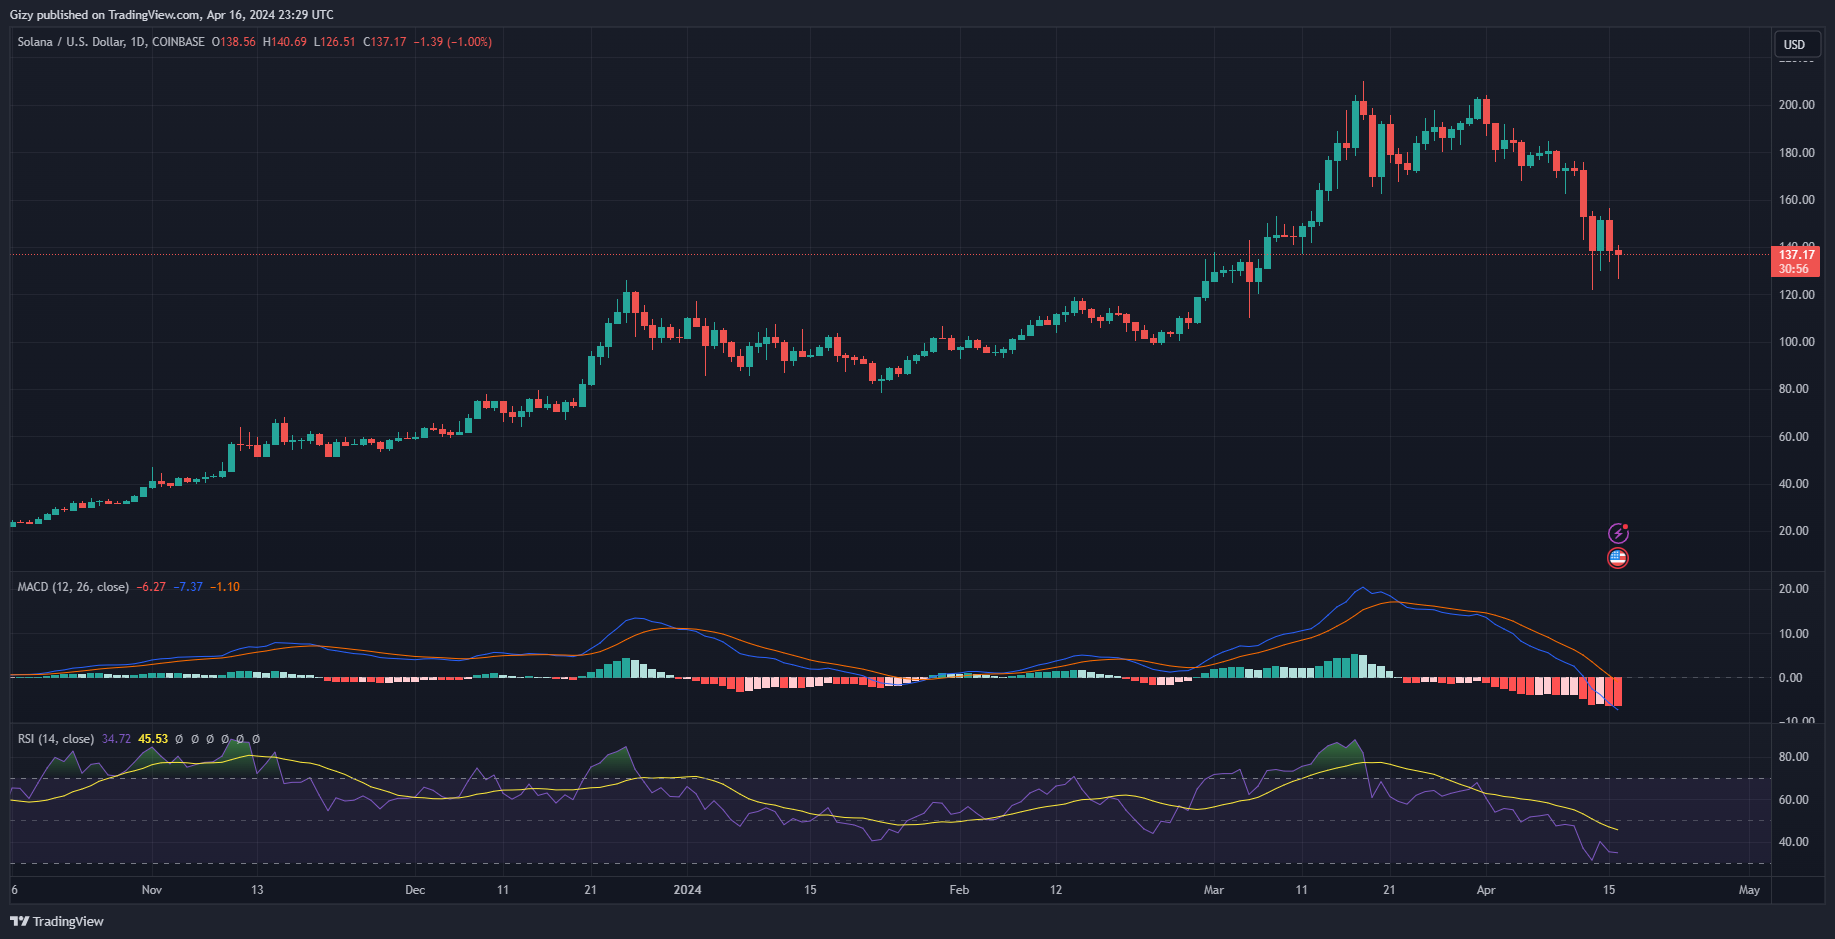
    Solana was one of the worst-hit coins from the previous dips. It lost 20% during this period as it retraced to levels it left in March. For example, on Saturday, it retraced to a low of $121 before rebounding and closing at $138.

    Since the event, the coin has not gained much leverage from the low as it edged to retest it a few hours ago. It dropped to a low of $126 but is showing signs of recovery. At the time of writing, its trading at $136 which indicates the coin is printing a hammer candlestick. If the current day ends with this pattern, it may result in notable increases in the coming days.

    The bulls will plot a return to $160 but faced massive rejections at $150 as observed in recent times. However, indicators do not support claims of further price increases. For example, MACD is on a downtrend and showing no signs of halting the trend. RSI is also below 40 which puts the bears at an advantage.

    With possible bearish action taking over SOL in the coming days, it will retest last week’s low. Nonetheless, the bulls will stage buybacks at $125. If it fails, the coin could close the week in the sub-$120.

    3. Toncoin (TON)

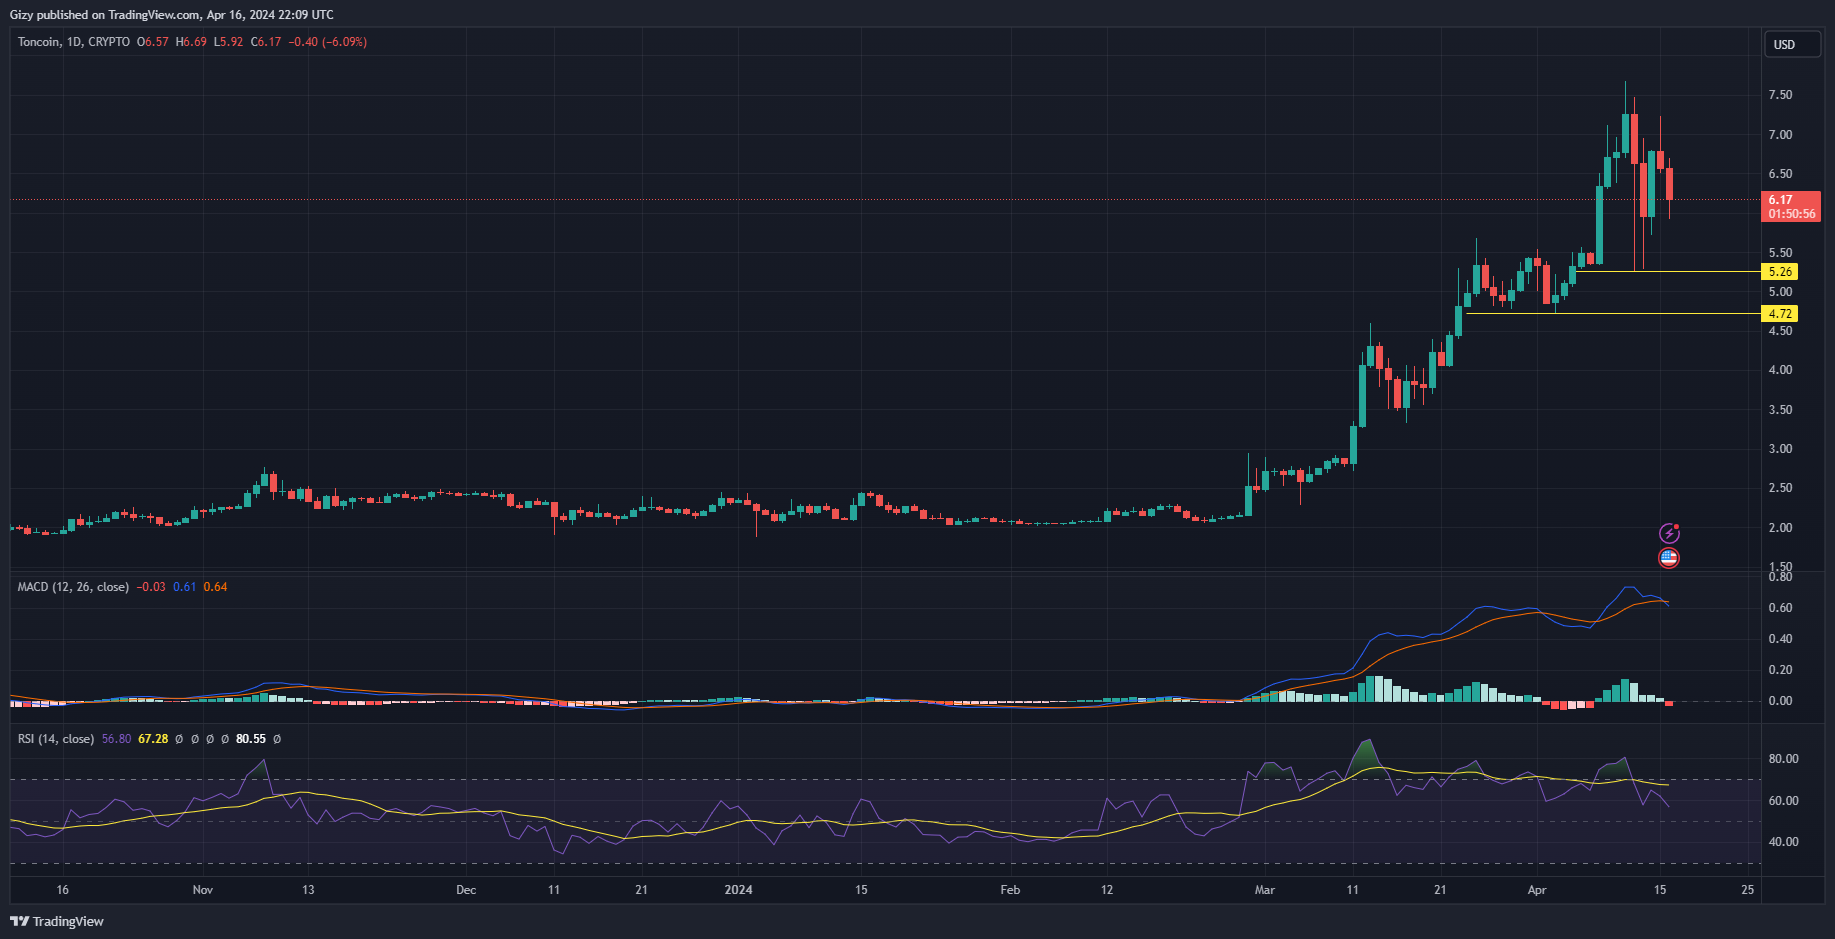
    Toncoin price action Friday spotlights the resilience of the bulls. It saw buyback following a decline to $5.26 from $7.47. This led to a rebound and the asset closing with losses of more than 8%. The buying pressure gradually reduced on Saturday following its over 10% decline.

    Currently, the coin is seeing small buying pressure after its dip to $5.92. As a result, the chart is printing a candlestick with close semblance with a hammer. Traditionally, this means that the cryptocurrency is set to start a notable price uptrend. If this happens, it will retest $7 within the next seven days.

    However, MACD is showing a possibility of further price decline. The 12-day EMA intercepted the 26-day EMA indicating a bearish divergence. With the threat of further downtrends looming, the bulls will attempt staging massive demand concentration at $6. If it fails, it will retrace to a low of $5.26.

    RSI also hints at a possible price decline to a low of $4.72. While this mark is not feasible this week, fundamentals speed up the process.

    4. Polygon (MATIC)

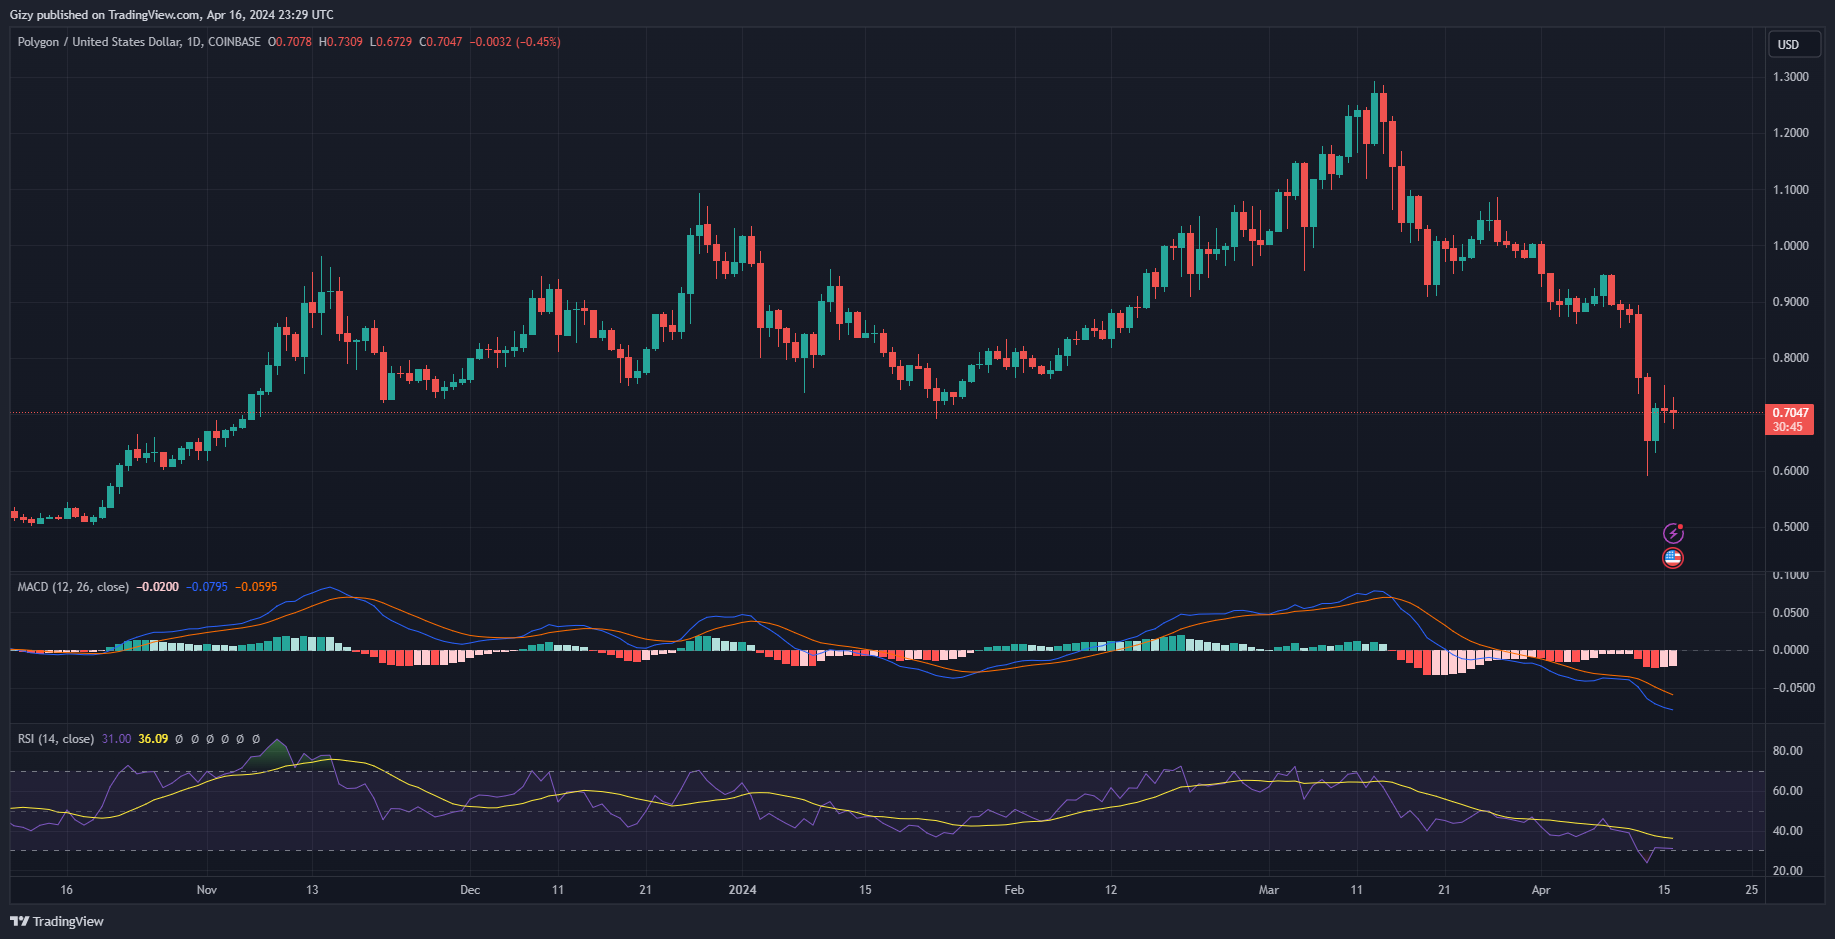
    MATIC retraced to a low of $0.59 during the previous week. The dip took place on Saturday when it had one of its biggest declines. It lost 14% on that day after previously losing 12% the day before. Attempts at recovery on Sunday were almost insignificant the coin lost over 20% on the weekly scale.

    Since the new week, MATIC has experienced notable price struggles. The candles suggest almost equal control of the market as there is almost equal pressure from the sellers and buyers. As a result, it is printed a doji on April 15 and is currently printing another.

    RSI is at 31 which suggests that the coin is almost oversold. A slip below 30 will trigger a buyback. However, this will happen between 20 and 30 which leaves room for more price declines. MACD is also hinting at further price decreases as both EMAs dropped below -0.05.

    A return to last week’s low is inevitable. Nonetheless, for the remainder of the current intraweek session, MATIC will see small declines that will ensure it breaks $0.65. A massive decline not on the horizon at the time of writing which means a slim fighting chance for the bulls. They will attempt a return to $0.75.

    5. Uniswap (UNI)

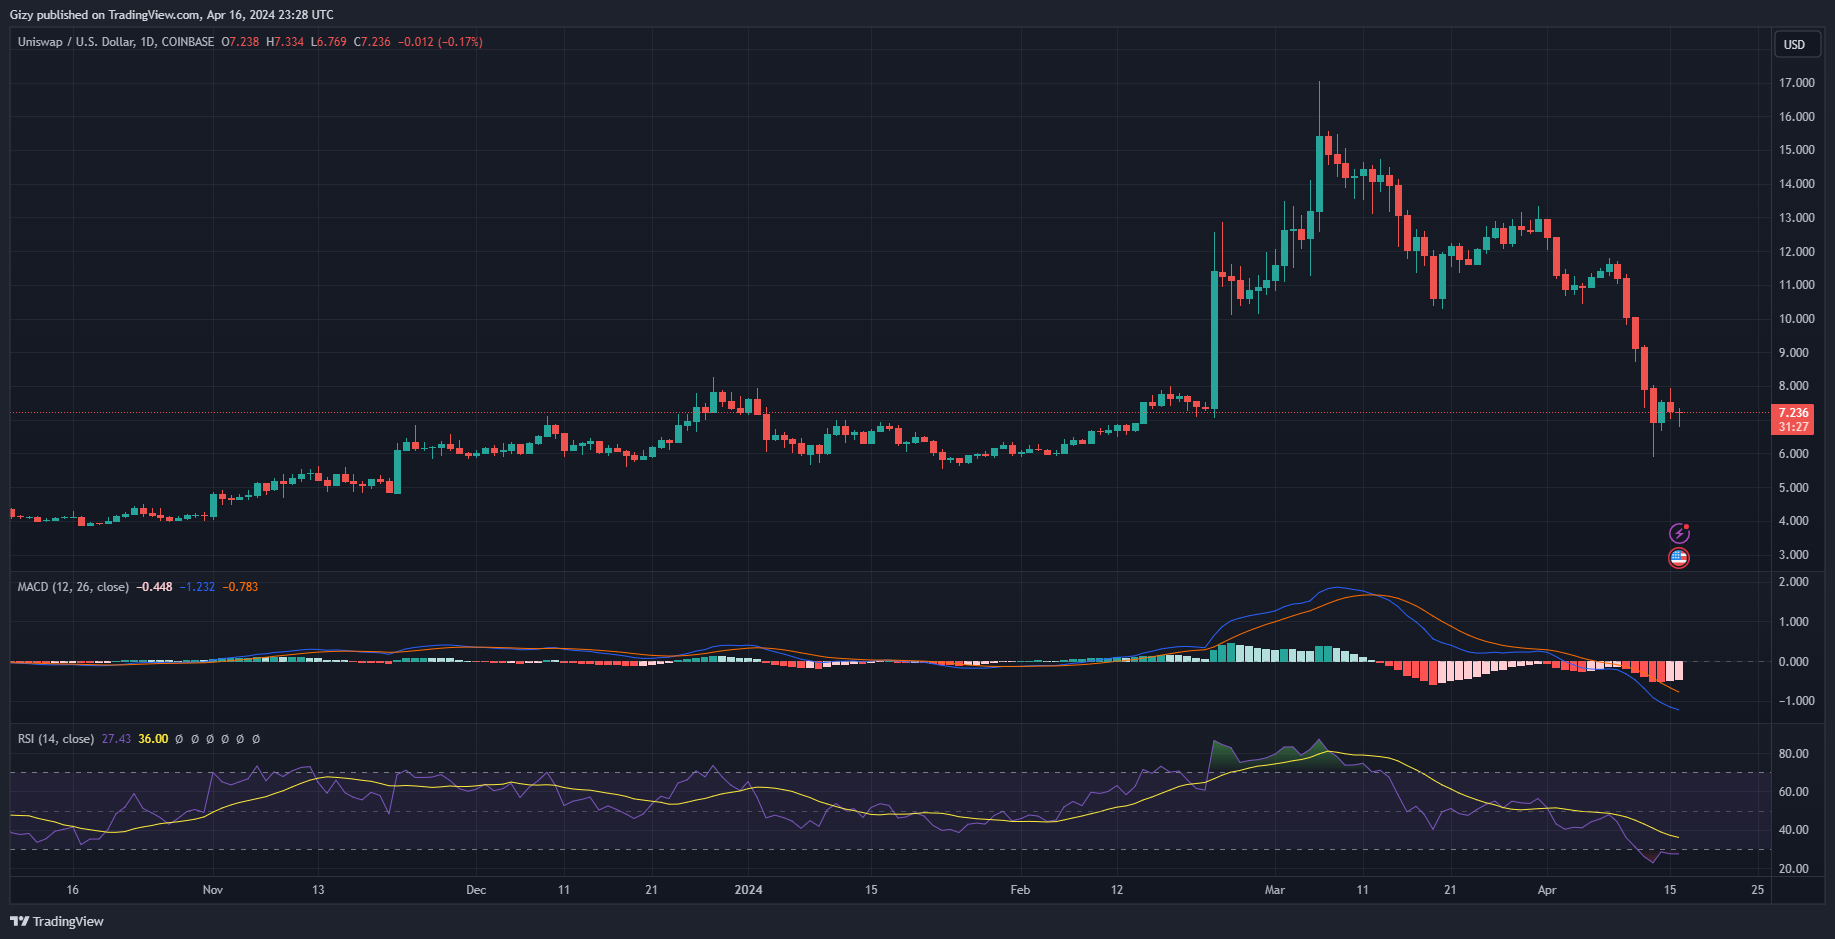
    Uniswap downtrend slows after almost a full week of consistent price declines. It started on Tuesday and the asset failed to find support until Sunday. As a result, it lost over 30% on the weekly scale and dropped to a low of $5.90 before a rebound and a close at $7.53.

    UNI is still experiencing significant decreases at this time. This comes after a more than 3% drop yesterday. Currently printing a doji, the asset is yet to register any notable positive change in value. Nonetheless, following the previous week’s events, the reduction in lost value could mean the bears are getting exhausted.

    The Relative Strength Index points to a reason to believe the above statement. The coin is currently oversold. This will mean it is due for an uptrend. However, the bulls are showing no signs of soaking up the excess supply at this time.

    This trend may result in further price decline and UNI dipping to $6. On the other hand, the reduction in volatility may continue over the next five days.


  • Cryptocurrency Analysis 12/04: BTC, ETH, BNB, SOL, XRP, DOGE, TON, ADA

    Cryptocurrency Analysis 12/04: BTC, ETH, BNB, SOL, XRP, DOGE, TON, ADA

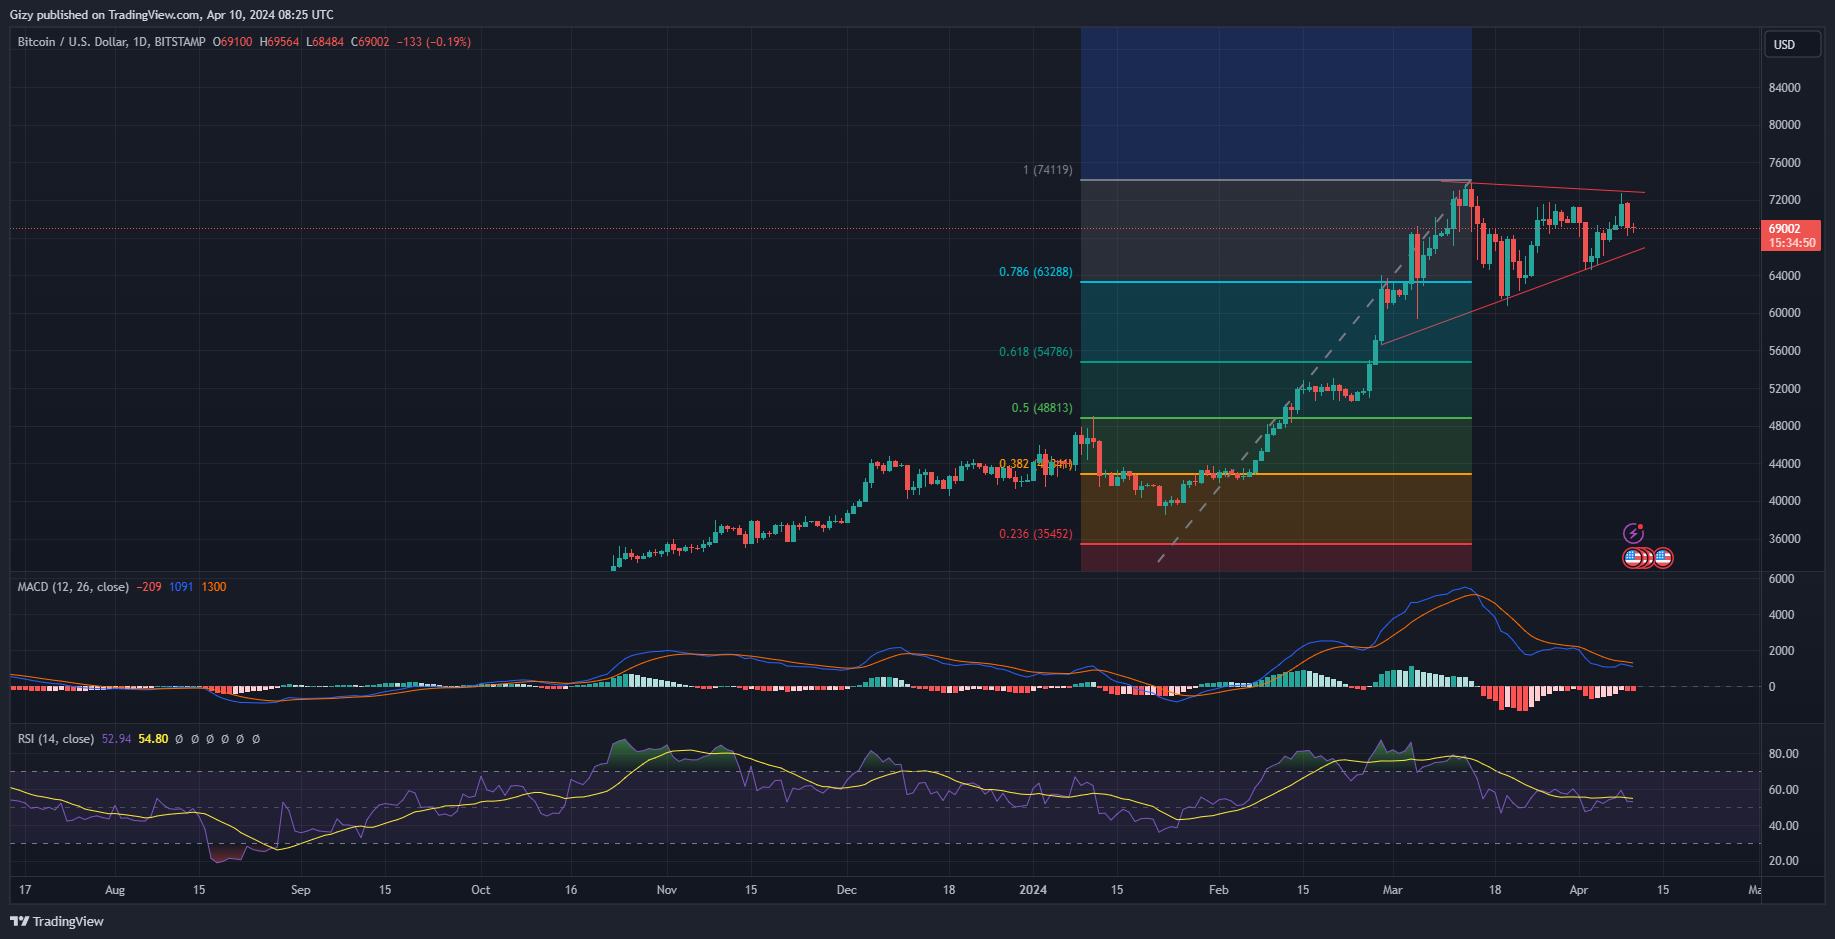
    BTC is currently seeing notable price declines. This comes after a previous intraday session of significant price increases.

    The apex coin continues struggling to hold on to $69k as bears rampage on. it dipped to a low $68k a few hours ago as it continues to grapple with selling pressure.

    In light of the increase in selling volume, Grayscale continues to move more Bitcoin to Coinbase. Many speculate that this is in a bid to sell. In addition to Grayscale’s actions, on-chain indicators also suggest that miners are selling at a moderate level.

    Nonetheless, it is worth noting that the struggle for dominance rages as BTC sees considerable increases in funding rates, giving the bulls an almost non-existing edge. This is in addition to the small decrease in exchange reserves.

    With both the bulls and bears having notable influence at this time, will bitcoin continue downwards or upwards? Will this also affect major altcoins? Let’s see what the chart says

    Bitcoin Price Analysis

    BTC continues trading within a symmetric triangle. This means it is due for a breakout. As the triangle closes, the coin will see less volatility until its breakout. The decrease in price movements will owe to massive uncertainty as the halving draws closer.

    It is worth noting that some traders believe that the apex coin will not register a new ATH until after the said event. Indicators like the Relative Strength index agree with this speculation. A closer look at it shows it trending with 50-55 which suggests an almost equal dominance between the buyers and sellers.

    Additionally, the Moving Average Convergence Divergence adds to the uncertainty in the next price action. The 12-day EMA continues to trend below the 26-day EMA. With both EMAs so close, it is a clear indication of an impending breakout.

    A breakout to the top may guarantee a retest of the $72k resistance. The Fibonacci retracement also suggests a possible attempt at $74k. On the other hand, if the downtrend continues, BTC will retest $63k. Breaking it will result in an attempt at $60k.

    Ether Price Analysis

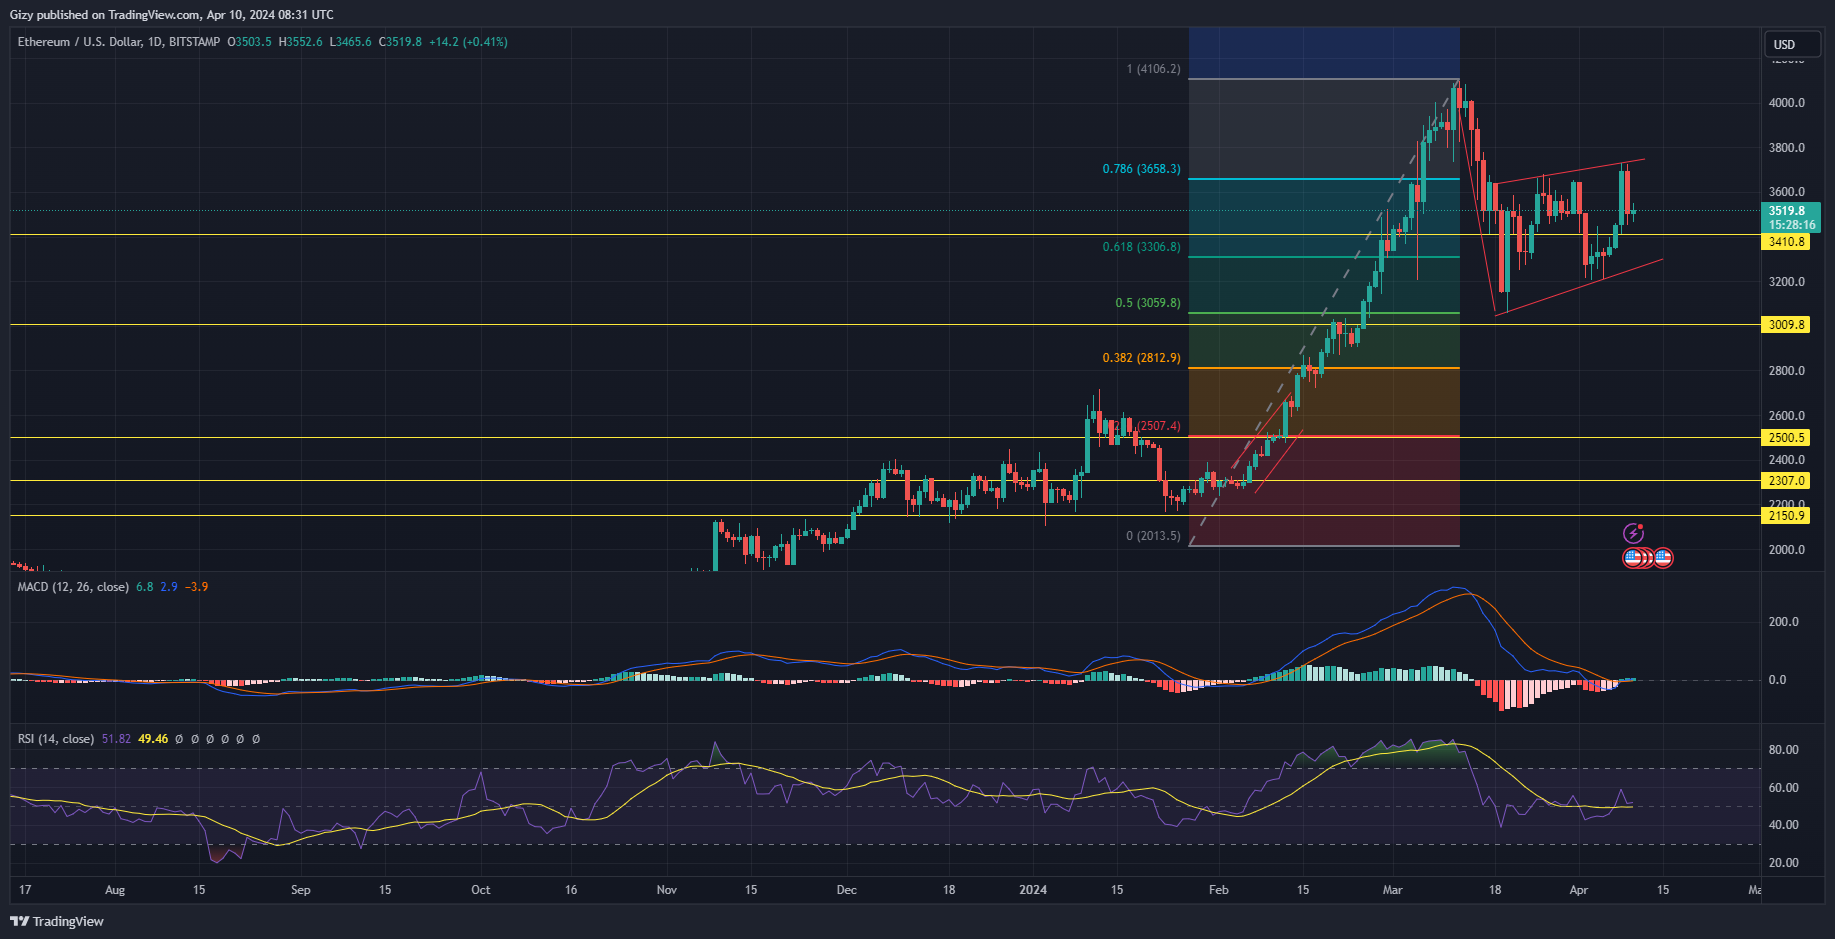
    Ether is currently trading within no glaring pattern. However, a closer look at the chart suggests that the coin is forming a bearish flag. As this pattern is slowly unfolding, the largest altcoin will register new highs and higher lows.

    To this effect, MACD is printing bullish signals. The 12-day EMA intercepted the 26-day from below after the previous cross took place mid-March. As a momentum indicator, the reading indicates that ETH is seeing notable increases in value. This comes after it gained over 10% in three days.

    However, RSI suggests that the most recent reading from MACD may hold little significance. The Relative Strength Index is currently at 51 which offers no clear advantage to either the bulls or bears.

    As uncertainty in price rages, the Fibonacci retracement suggests possible levels. With the current price at $3,520, ETH will look to retest $3,700 in continuation of the bearish flag. With the forecast of higher highs and lows, the altcoin will hover around $3,460 (the closest support). If it fails, it’ll mean the buyers are still struggling to absorb the supply.

    It may open the $3,300 support for a retest. Nonetheless, a rebound at this level will guarantee the continuation of the chart pattern.

    BNB Price Analysis

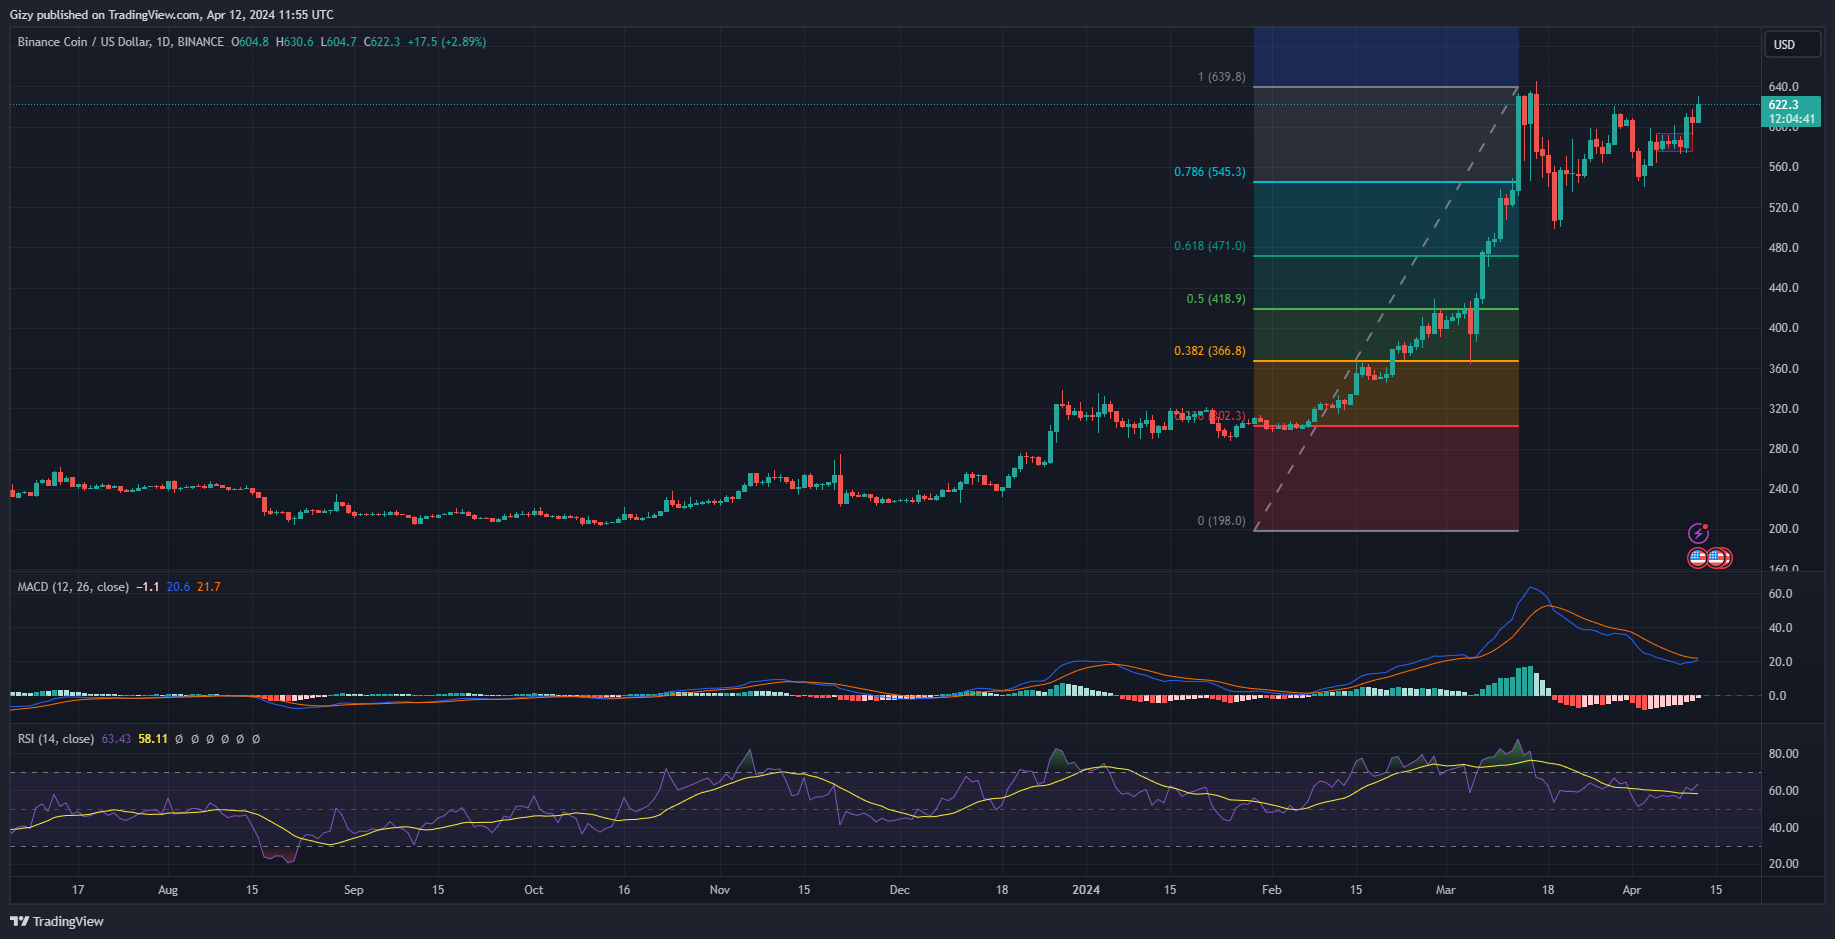
    Binance coin continues to trade within the $575 and $593 channel. It’s a clear indication of the struggle for dominance with both the bulls and bears scoring small breakouts. However, RSI is hinting the buyers have more advantage in this contest as slowly edges to 65, indicating a small increase in buying volume.

    However, MACD is also reacting to the decrease in selling volume. The 12-day EMA is gradually surging upwards and in contact with the 26-day EMA. With the bullish convergence underway, BNB is bound to see more price increases.

    The fibonacci retracement hints at the asset retesting its previous high at $640. As seen in previous times, a flip of the said resistance could open the coin for an attempt at $700. However, there are no huge market fundamentals disputing this speculation.

    On the flip side, the coin is susceptible to small downtrends as the market continues to grapple with the incoming bitcoin halving. The highlighted chart drawing points to a retracement to $545. Nonetheless, before this attempt takes place, the $575 support is another tough mark.

    Solana Price Analysis

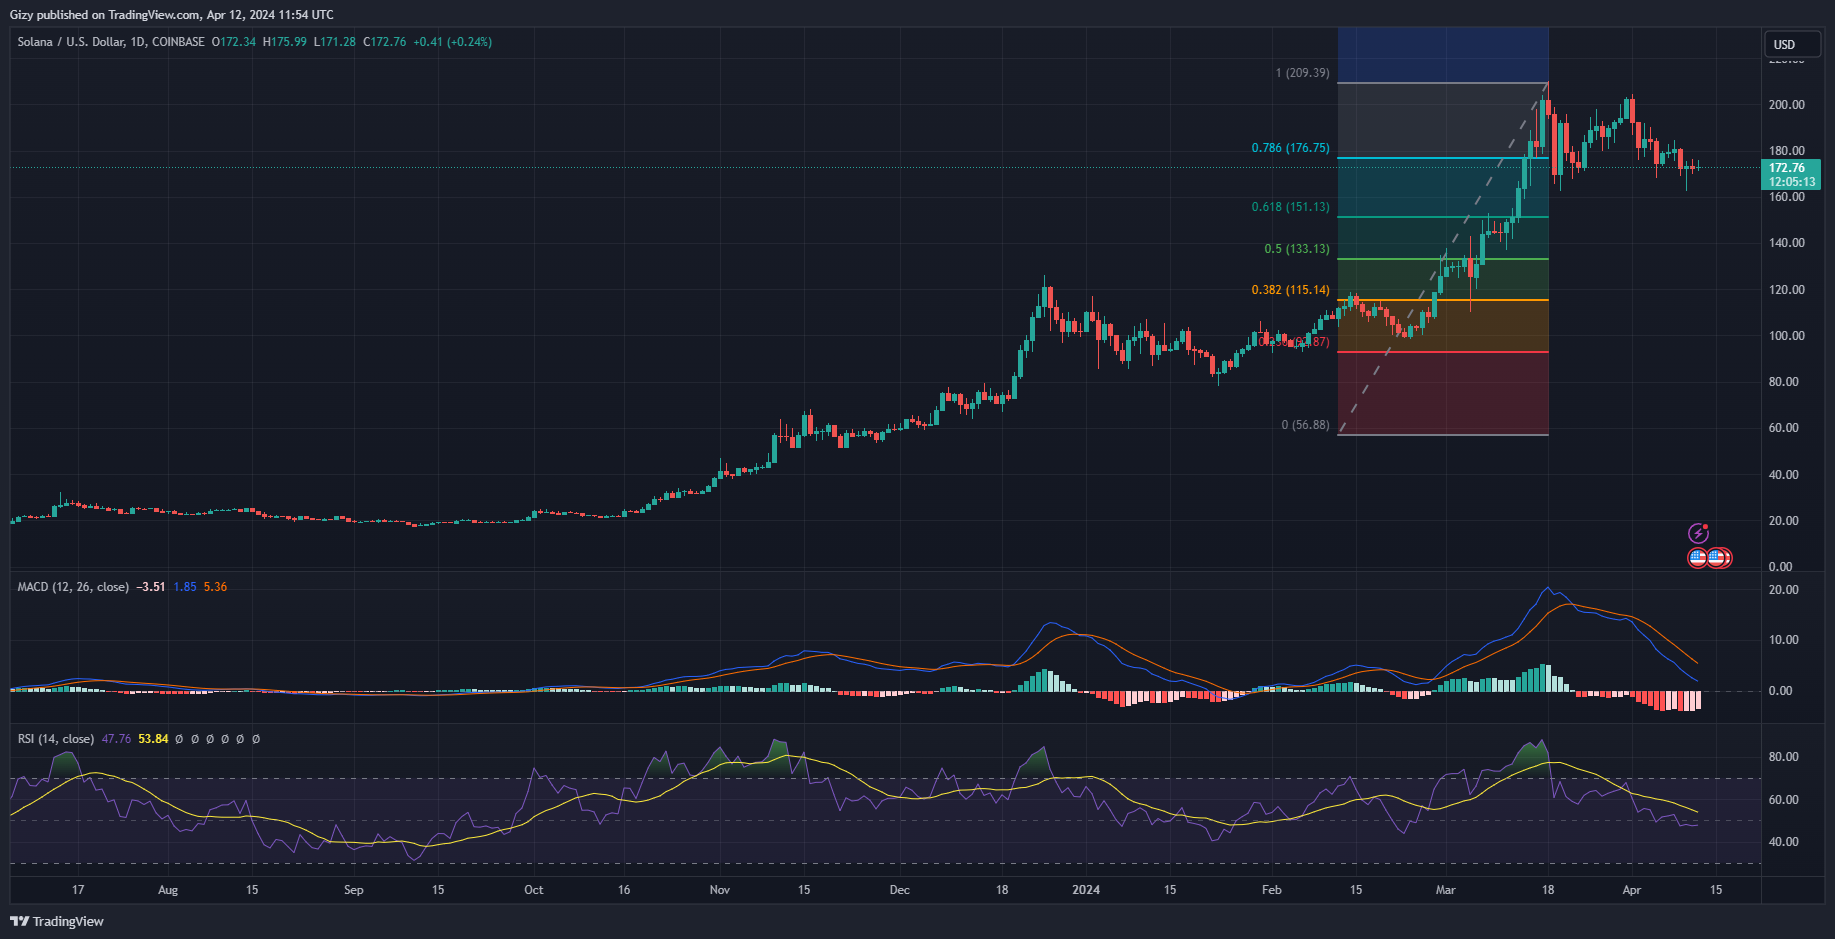
    The SOL/USD pair traded almost flat over the last three days. Wednesday gave many traders a jump scare as it retraced to $162. However, the buyers quickly soaked up the supply spike and the coin returned to its starting price.

    Since the decline, SOL recovered and has since traded flat. In response, RSI is is gradually taking a plunge as the asset continues to experience low volatility. However, its below 50 which shows the sellers are gradually edging in this contest.

    MACD also offers the same insight. The 12-day EMA is on a downtrend as well as its counterpart. A closer look at the indicator shows no signs of any recovery.

    As per the fibonacci retracement, it is important for the altcoin to continue the current trend, holding on to its support at $170. While the previous day suggests the bulls ability to absorb supply increases, a massive change in market sentiment will send SOL as low as $151.

    Nonetheless, the same chart drawing rightly designate $176 as a tough resistance as the coin failed to flip it in the last three days. Breaking this psychological barrier will move the next price struggles to $186. The metric also suggested a return to $181.

    Ripple Price Analysis

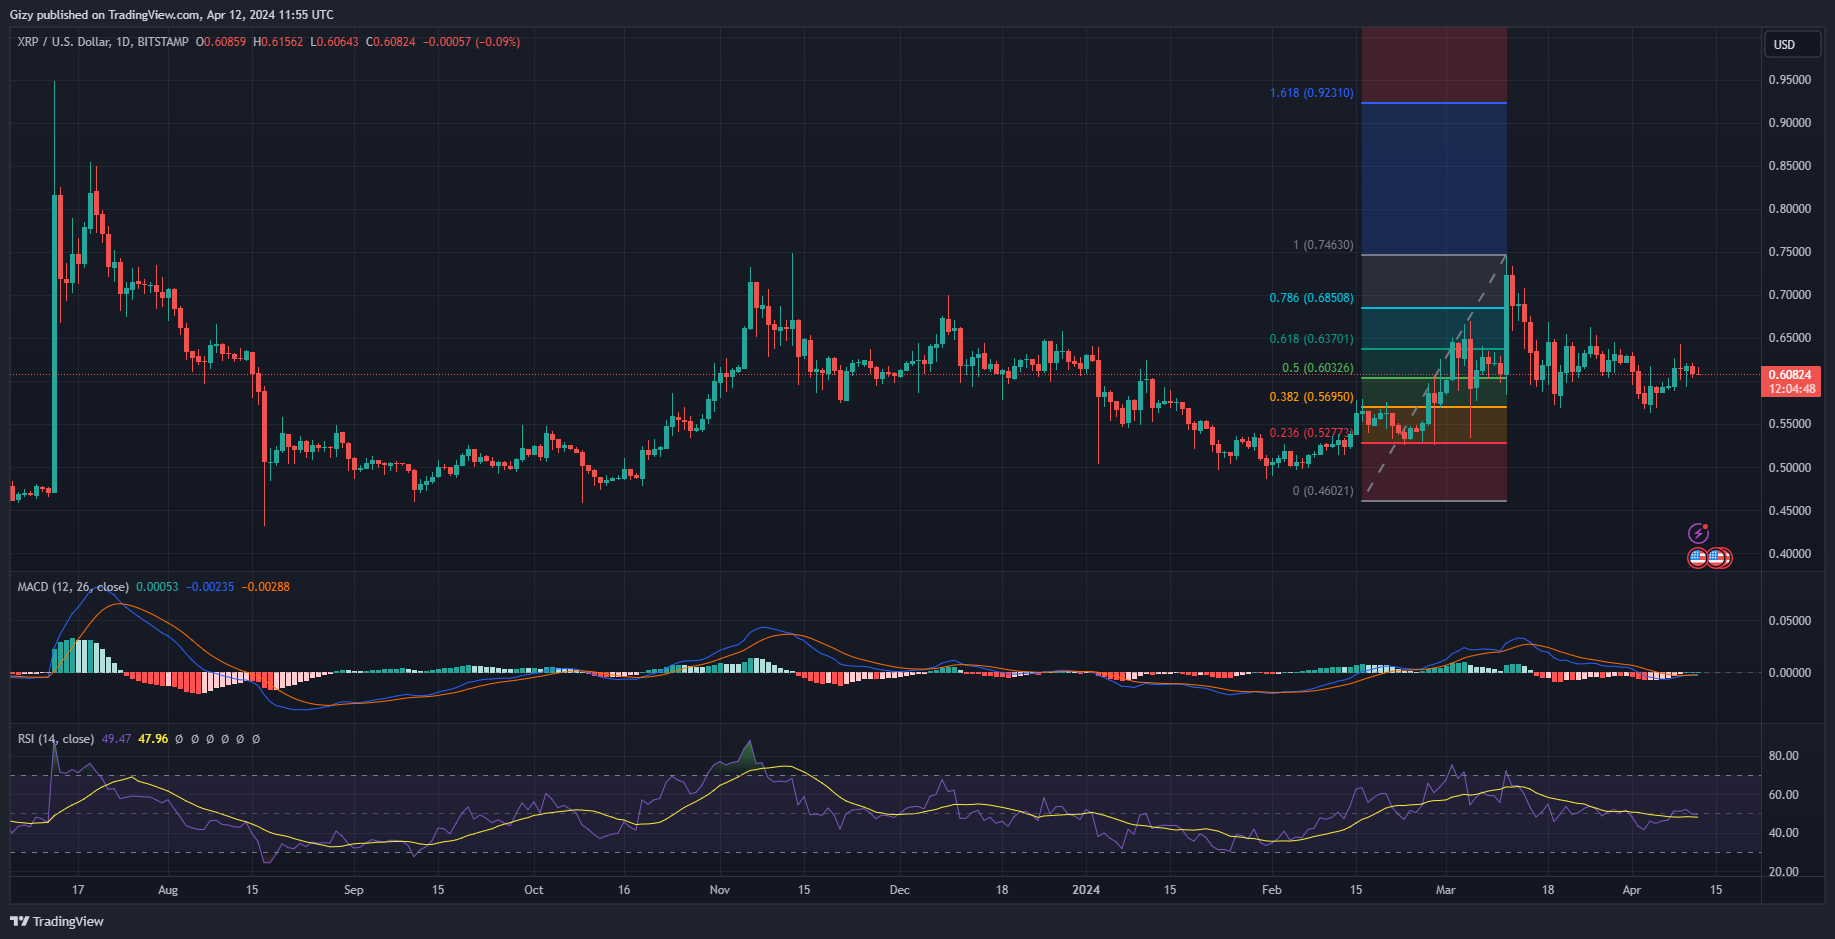
    XRP continues to exhibit significant volatility until the current intraday session. It joined the list of altcoin that suffered a sudden spike in selling volume on Wednesday. Due to this, it retraced to a low of $0.59 but recivered as the bulls absorbed the excess supply. It ended the session at its opening price.

    The decline came barely 24 hours after the altcoin retested $0.64. With that in the rearview, the coin has seen no significant improvement in prices. RSI offers no advantage to the buyers or sellers as its at 50. It depicts a notable decline in traders’ interest. Coinmmarketcap shows a 20% decline in trading volume over the last 24 hours.

    However, per MACD, XRP may see more price increases. It showed a bullish divergence on Wednesday. Currently, the 12-day EMA is on a small uptrend, reflecting the small increase in price.

    If the trend continues, the altcoin will attempt $0.63 and try break out from its fourteen-day high. However, the asset’s current price is shy of a critical support. Further slip will see it test $0.60. Failure to keep price at this level will result in the coin retracing as low as $0.56.

    Dogecoin Price Analysis

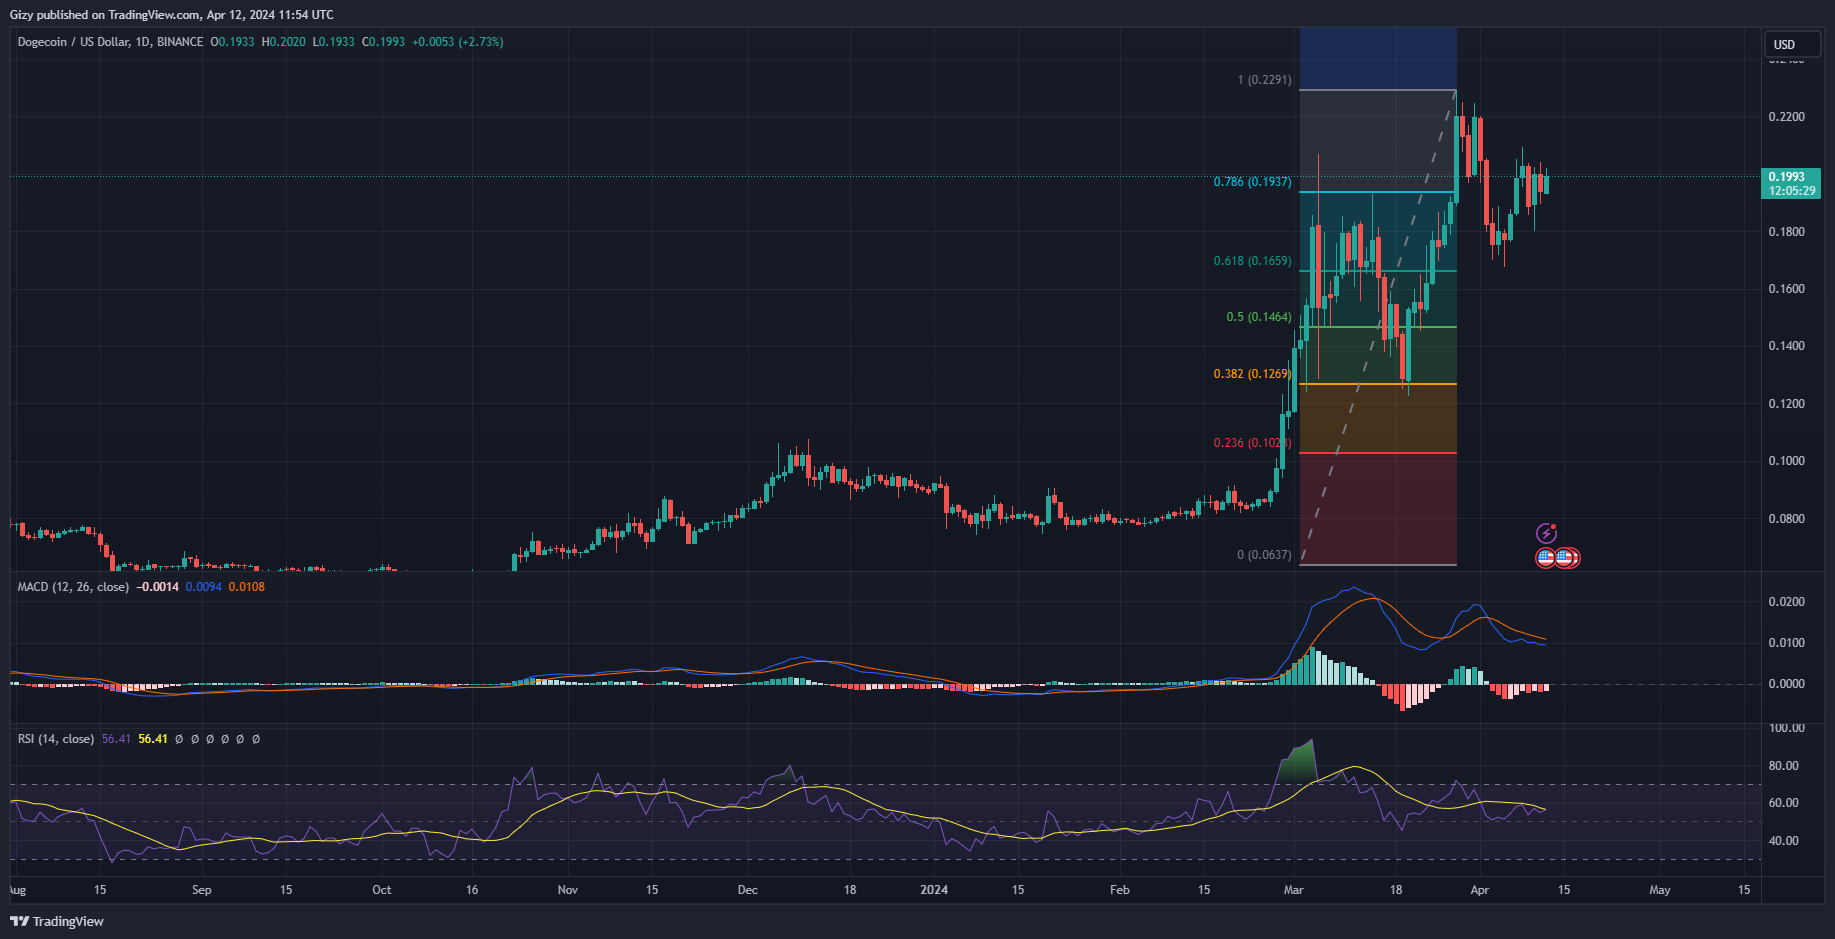
    For the past four days, the DOGE/USD pair exchanged between $0.18 and $0.20. It broke this barrier on a few occasions. However, the last 48 hours suggest that the channel is tinning. Nonetheless, of the highlighted period, Wednesday came off as the most volatile. Doge tested the $0.18 but rebounded. The day ended with the asset gaining more than 5%.

    The decrease in trading volume explains the dwindling movement in price. Over the last 24 hours, dogecoin trading volume dropped by more than 20%. Nonetheless, the bulls are pushing prices as RSI suggests a small increase in buying volume. It is currently at 56.

    However, MACD remains unfazed by this increase. The 12-day EMA continues gradual decline with no hint of stopping. The 26-day EMA is also experiencing the same trajectory. This comes as the bearish divergence continues.

    At the current price, the asset is trading close to 0.78 Fibonacci which is at $0.193. In recent times, it bounced off $0.16. DOGE may repeat this trend as it is struggling at $0.19. Nonetheless, breaking its current trend will result in retest of the $0.22 resistance. On the other hand, if the coin flips $0.16, it will drop to $0.14 before rebound.

    Toncoin Price Analysis

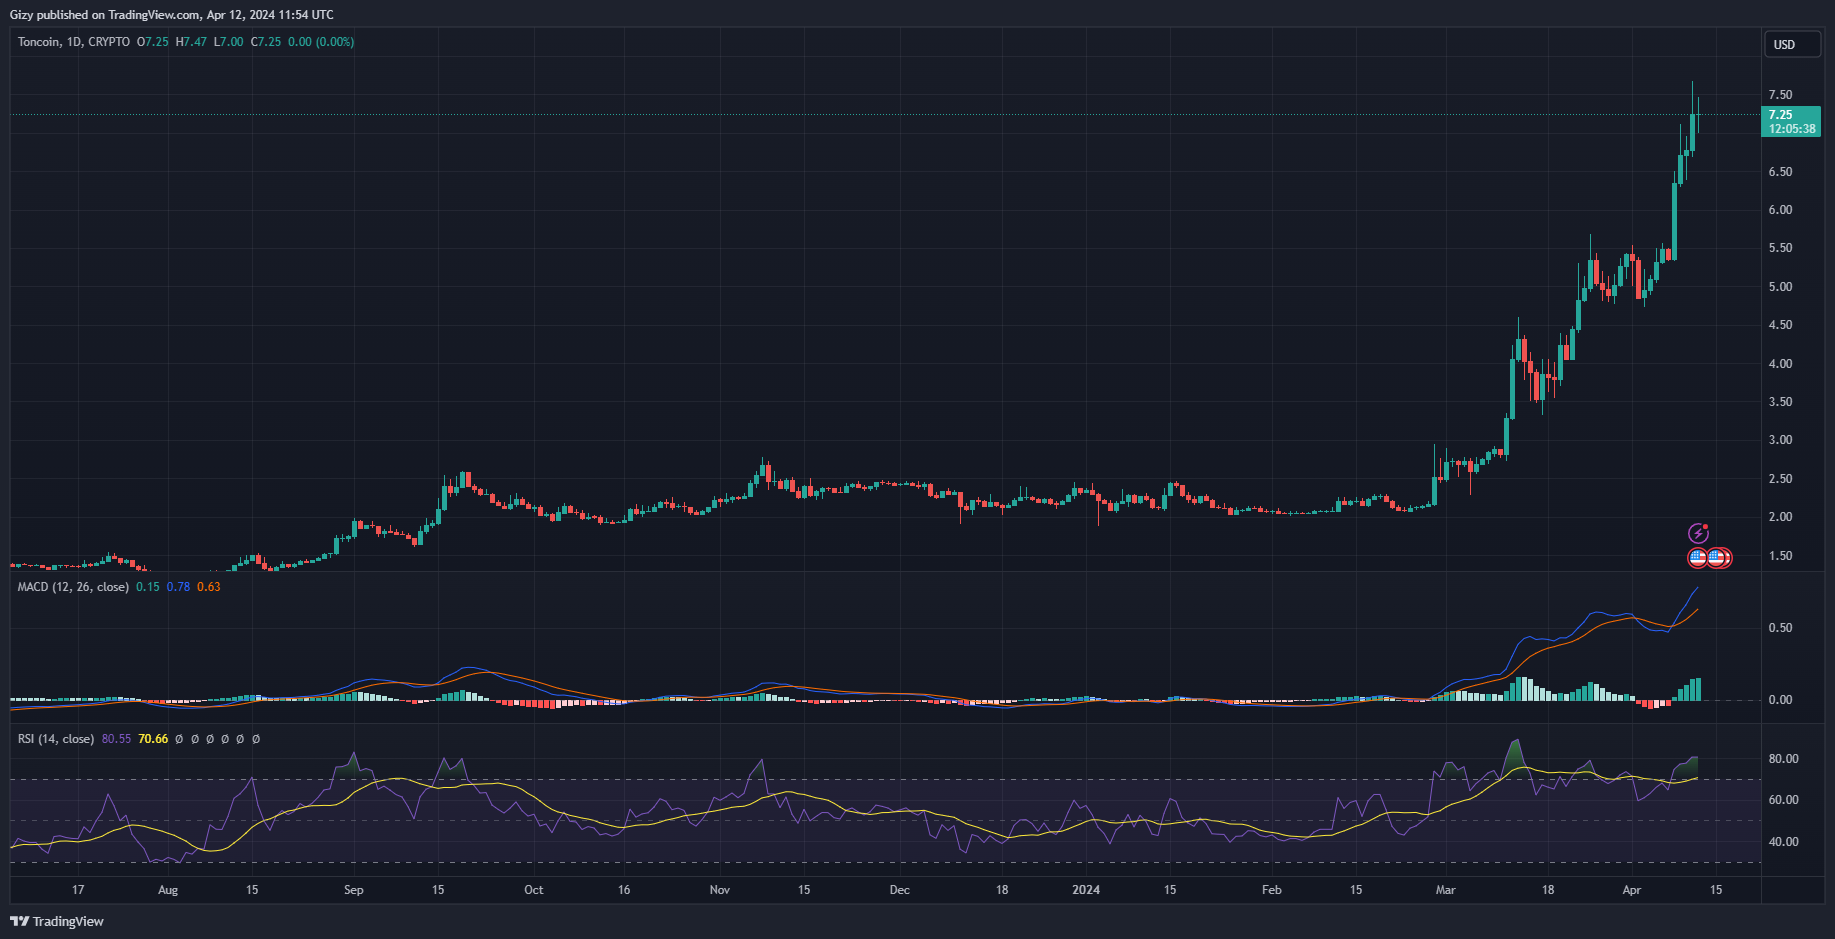
    Toncoin has steadily climbed over the last seven days. During this period, it gained over 30%. The daily chart shows that it had one of its biggest surges on Monday as it tested $6.50 but failed to break it. Nonetheless, it registered gains of over 18% at the time.

    The current intraday session shows that the bulls are gradually running out of momentum. At the time of writing, a doji stands as the representation of the current action. Additionally, with traders’ interest dwindling, so too is trading volume. Over the last 24 hours, TON exchange value dropped by over 32% resulting a 2% decline in market cap.

    RSI suggests that the coin will see more downtrends. One of the key levels to watch is the $6.35 support.