

ETH has been the center of attention in the last seven days. Following several months of uncertainty, the US Security and Exchange Commission finally approved a spot ETF.
In the days leading up to the approval, the regulators quelled the uncertainties by contacting filers to update their request, increasing odds from 25% to 75%. The market responded with massive surges as several assets reclaimed their 2024 highs. It also gained almost 5% in 24 hours.
Ethereum products like PEPE and FLOKI surged to their peak as the first registered a new all-time high. Aside from these ETH products, BONK gained a whopping 20% as it surged past its two-month high.
The past seven days were some of the most profitable for the crypto market. Let’s see how the top 10s performed
Table of Contents
BTC/USD
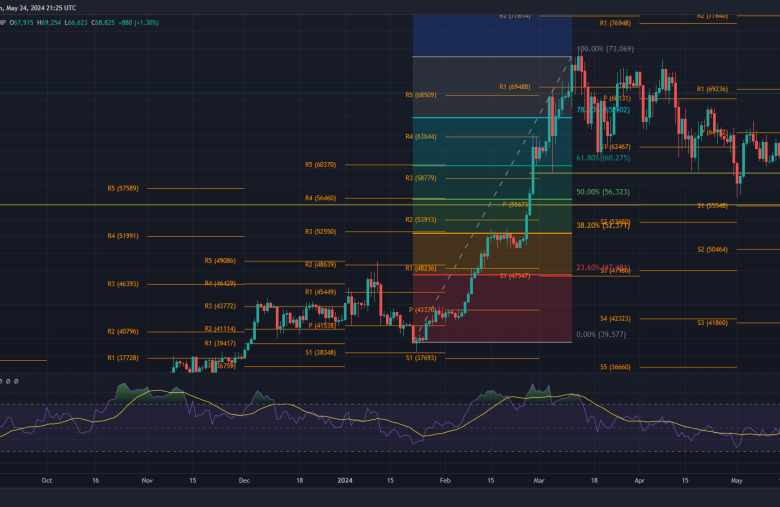
Bitcoin is up by over 2% in the last seven days. The apex coin is experiencing significant downtrends the massive surge it had on May 20. It peaked at $71,500 after starting the day at $66,255. It also ended the session with gains exceeding 7%.
Currently printing green candle, this is the first such cand as it registered significant declines over the last three days. During this period, the coin lost almost 5% as it gradually lost levels it attained during the previous hike. It dropped to the lowest mark on May 23 as it rebounded at $66,600.
A few hours ago, the asset dropped to this level again. Nonetheless, as with the previous day, it rebounded and is edging towards $69k.
The $67k mark is losing its value as many analysts previously predicted that it was critical for an attempt at $70k. However, the $66k support has remained instrumental in maintaining the momentum to retest the highlighted resistance.
The Fibonacci retracement points to the continuation of the two-day trend as the highlighted support is close to the 78% Fib level. This means there is notable demand concentration there.
Nonetheless, BTC is trading at $68,921, which shows it is edging towards its first pivot resistance at $69,200. A decisive flip will see the cryptocurrency surge above $70k before the week ends.
ETH/USD
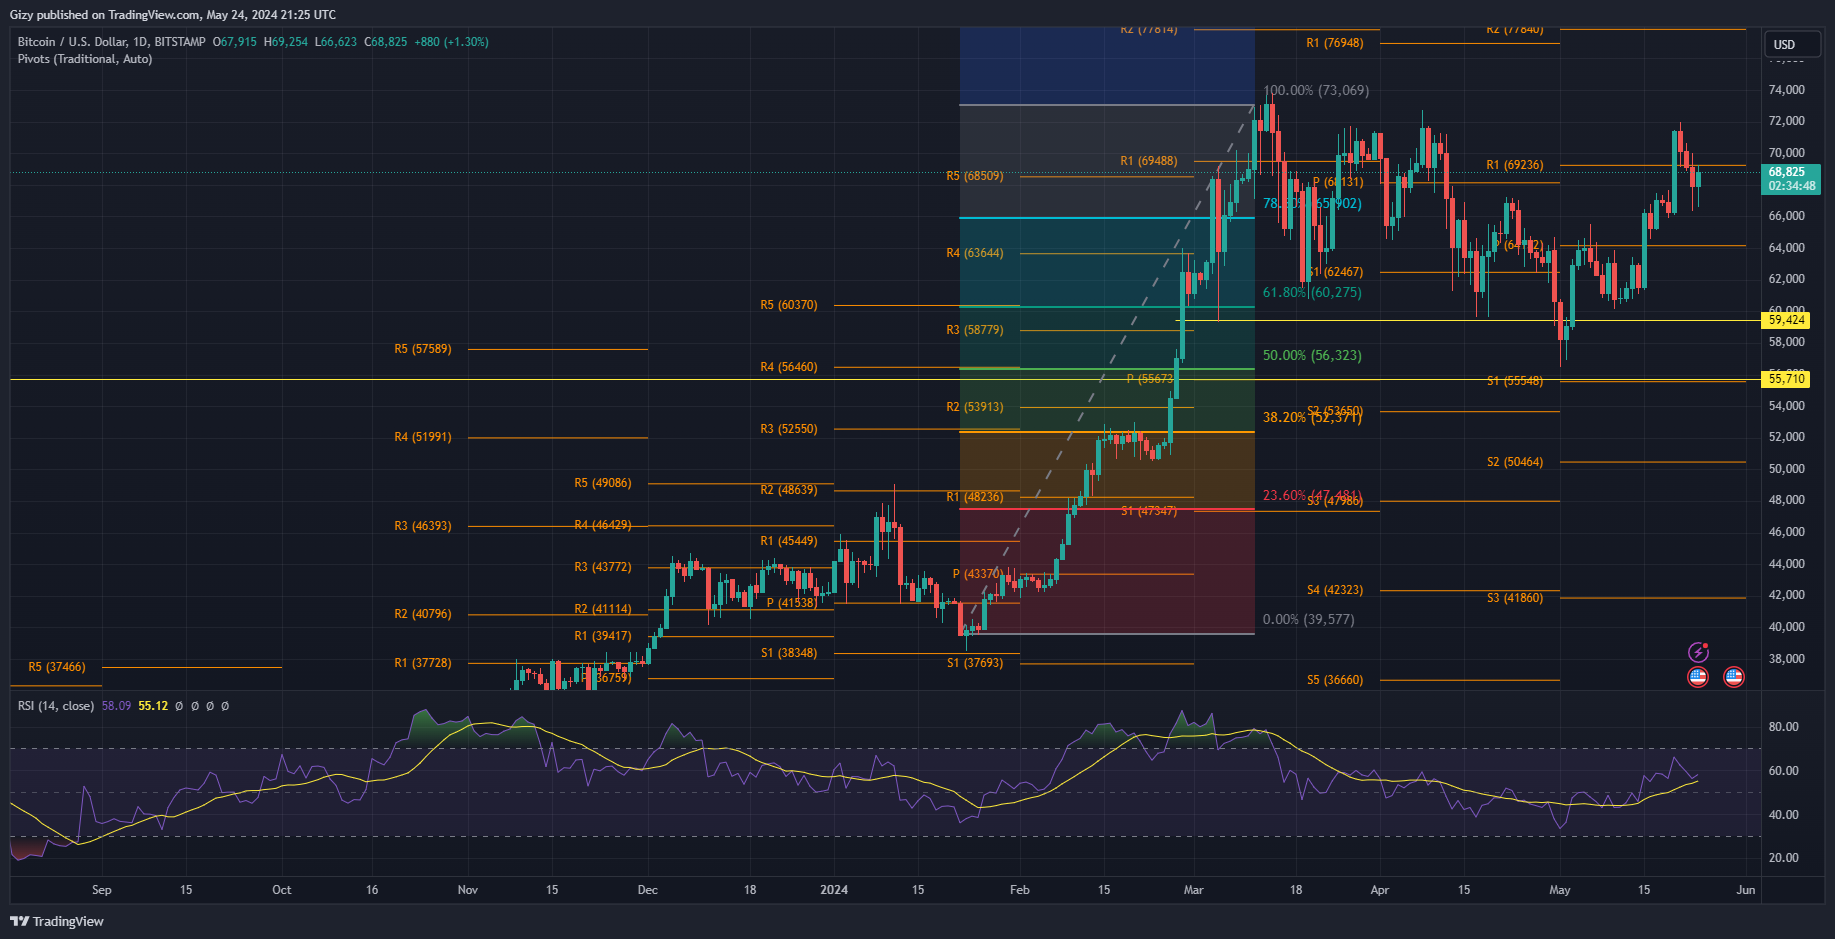
May 20 saw Ethereum attempt its 2024 high. In a massive surge, it gained a whopping 19% as it climbed from $3,070 to a high of $3,695. During the rally, it climbed above several pivot levels. One such is the pivot point, which served as resistance for over fourteen days before the hike. The first pivot resistance is another critical level that broke.
Since climbing above these levels, the coin has maintained trading above them. Nonetheless, during the previous intraday session, it slipped below them. Following its failed attempt at $k, it dropped to $3,521 and peaked at $3,947.
Currently printing a red candle, the asset is recovering from a drop to $3,700 and is yet to fully achieve this bid. However, the most recent trend is the opposite of what many expected, as the ETH ETF got its approval during the previous intraday session. The surges they anticipated never came as the altcoin is struggling to gain stability above $3,800.
Nonetheless, the relative strength index suggests further price declines. At 68, it is falling below 70 for the first time in almost four days. This will mean a drop below $3,500 may take place in the coming days.
BNB/USD
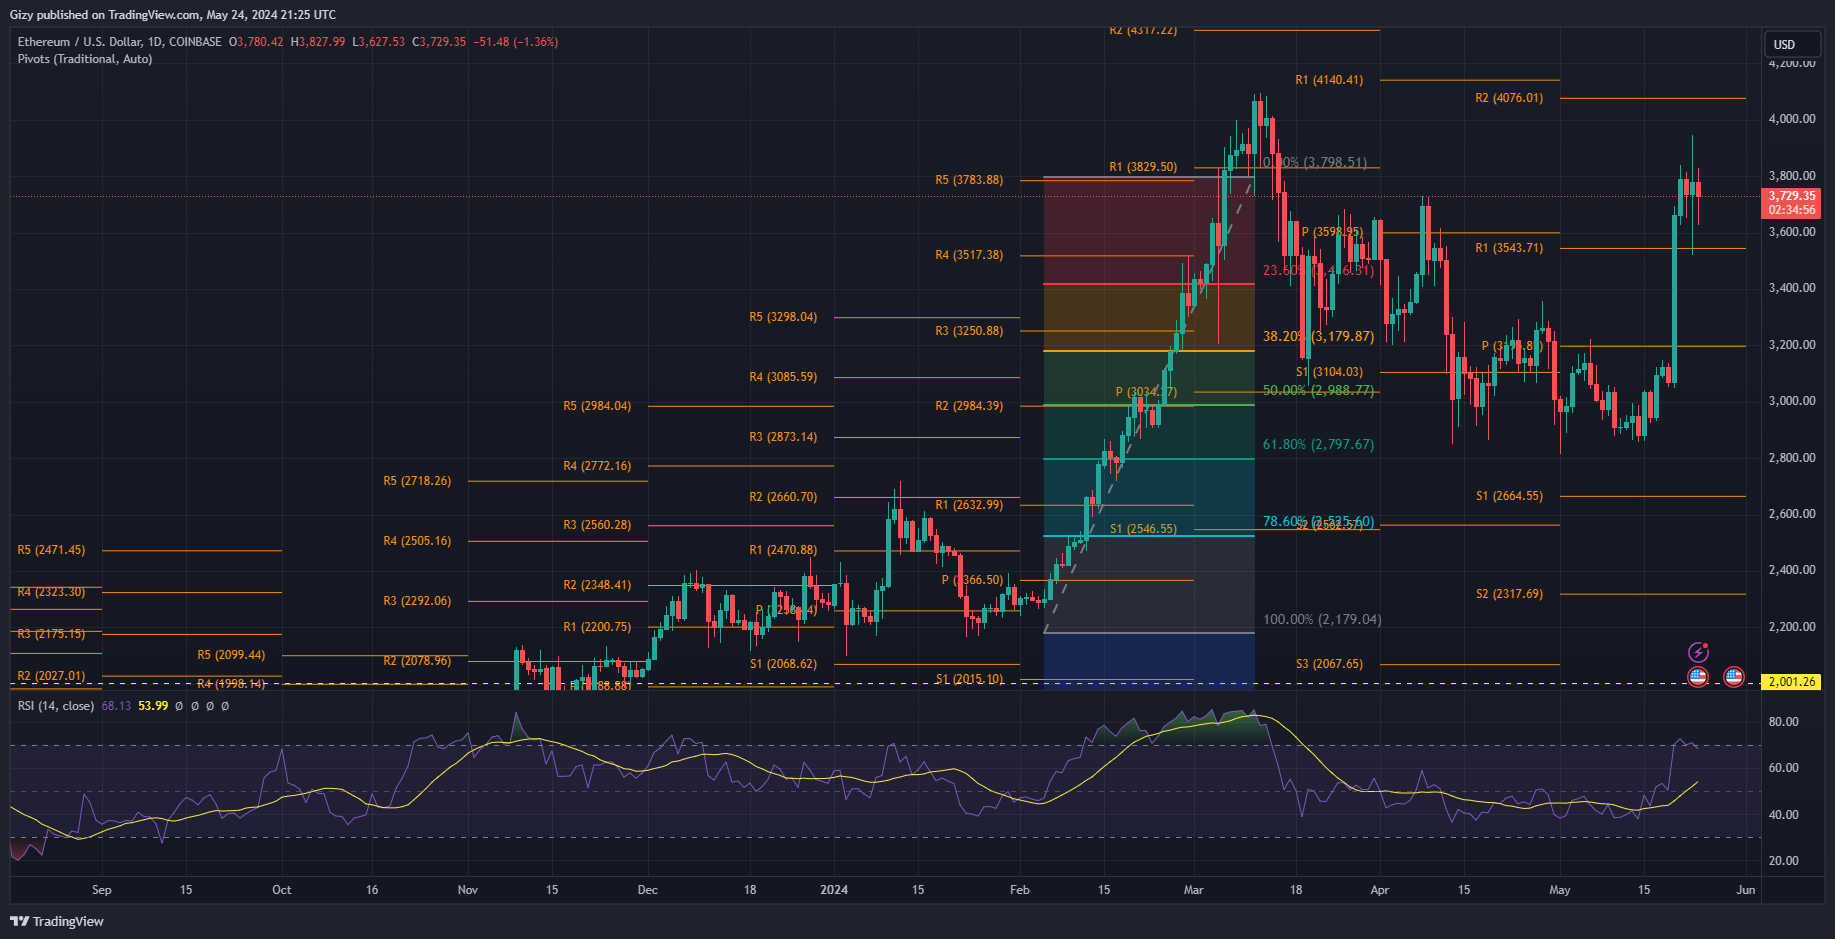
Binance coin is on the downtrend and has yet to recover. Nonetheless, May 20 and 21 were some of the most bullish periods of the last seven days. It gained over 7% as it peaked at $631 after bouncing off its pivot point at $574.
It edged close to retesting this level during the previous intraday session. It dropped to a low of $580 but recovered and closed at $599, recording losses of over 2%. It is currently printing a doji as the bulls attempt to halt the downtrend it experienced during the last two days.
Nonetheless, price movements suggest a retest of the pivot point in the coming days. This comes as price movements remain flat in the past 24 hours. Additionally, the relative strength index halted its descent and is currently trending in an almost straight line. This illustrated an equal pressure between the buying and selling pressure.
The 12-day EMA is also moving in the same pattern as RSI. Additionally, the 26-day EMA is on an uptrend which suggests an impending bearish convergence if the trend continues. This may lead to BNB retesting its 50-day exponential moving average.
SOL/USD
The current candle shows that Solana bulls are staging a buyback. However, it appears unsuccessful as it has yet to register any significant price improvement. As a result, it is printing a doji. Additionally, RSI halted its decline in response to the latest attempt.
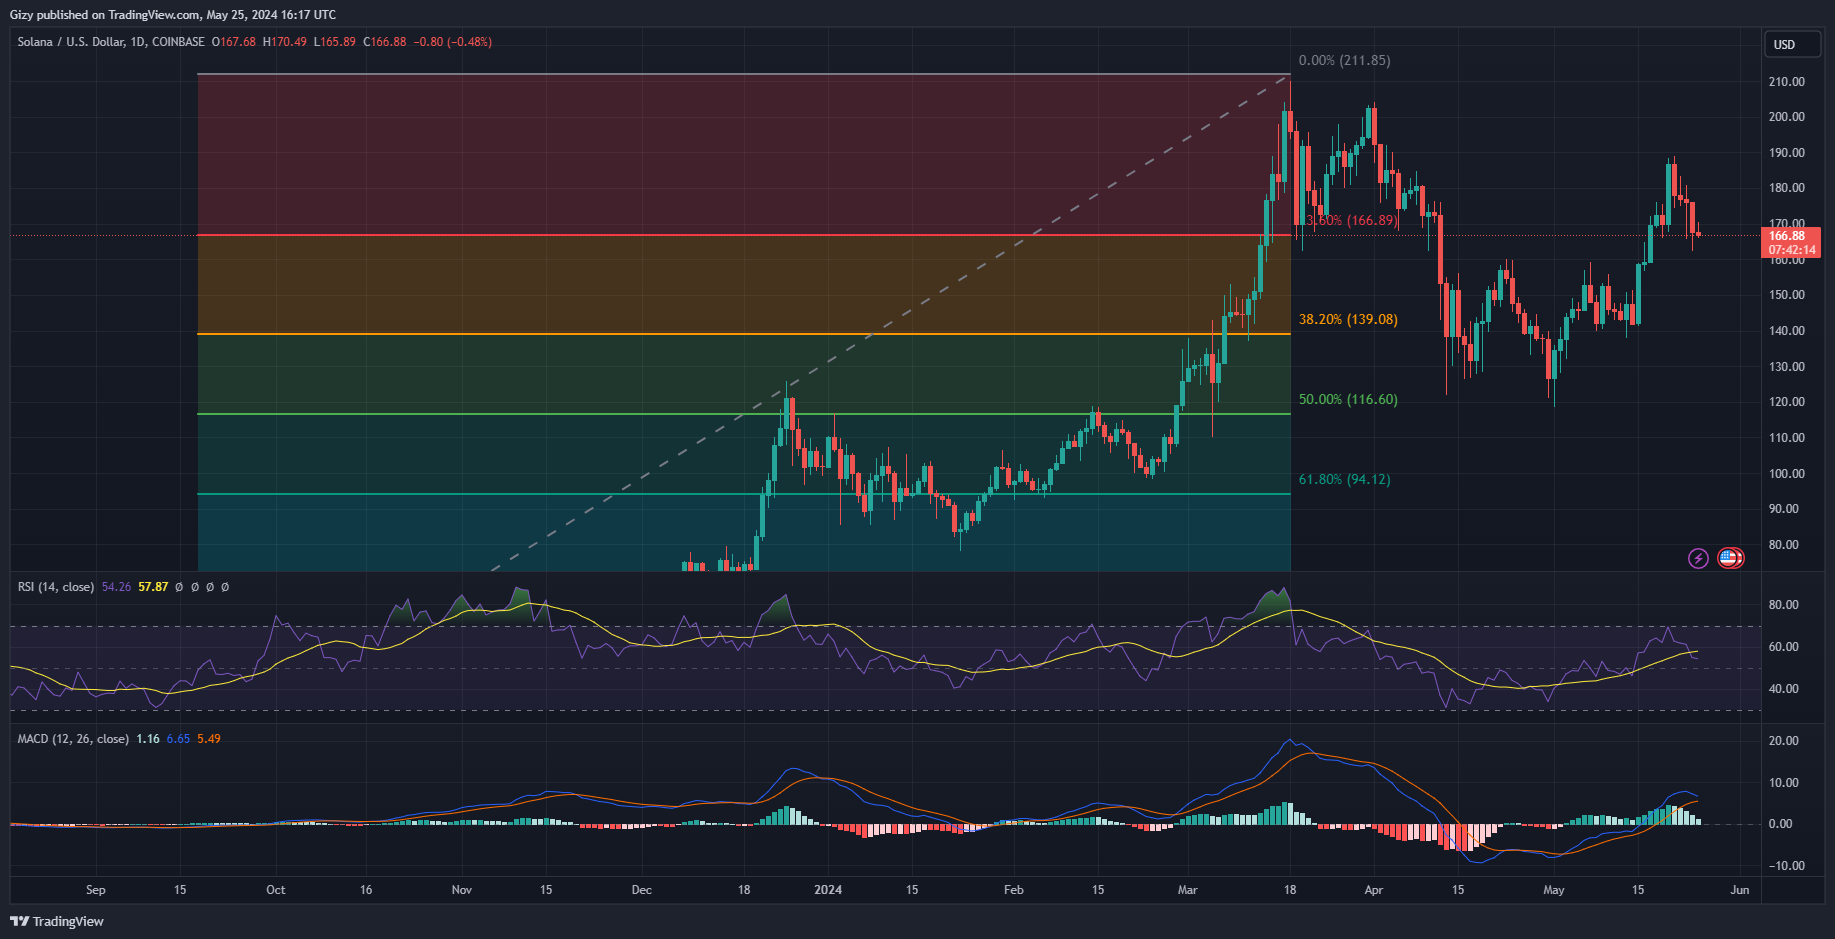
The most recent price movement is an improvement from the last four days as the asset will likely register its first green. The previous intraday session was the worst of the period as it registered one of its biggest dips. It lost almost 5% as it retraced to a low of $162.
The move brought it close to breaking the $160 support and testing the 50-day EMA at $157. Nonetheless, RSI points to the possible reasons for the latest decline. A few days ago, the metric surged to 70 which meant it was seeing maximum buying pressure. Further uptrends would make the asset overbought. It also meant that the asset was due for corrections.
The moving average convergence divergence indicates further downtrends. The 12-day EMA is on the decline and will intercept the 26-day EMA in bearish convergence. This will mean a drop below the 50-day EMA is almost inevitable.
Currently trading close to the 23% Fib level, it will lose the mark. The next critical level to watch is the 38% Fib mark at $140.
XRP/USD
XRP is looking to continue its growing uptrend. A green close on May 25 will mark the third consecutive day with minute price improvement. Currently displaying one of the tiniest candles on the chart, the asset is holding on to $0.53.
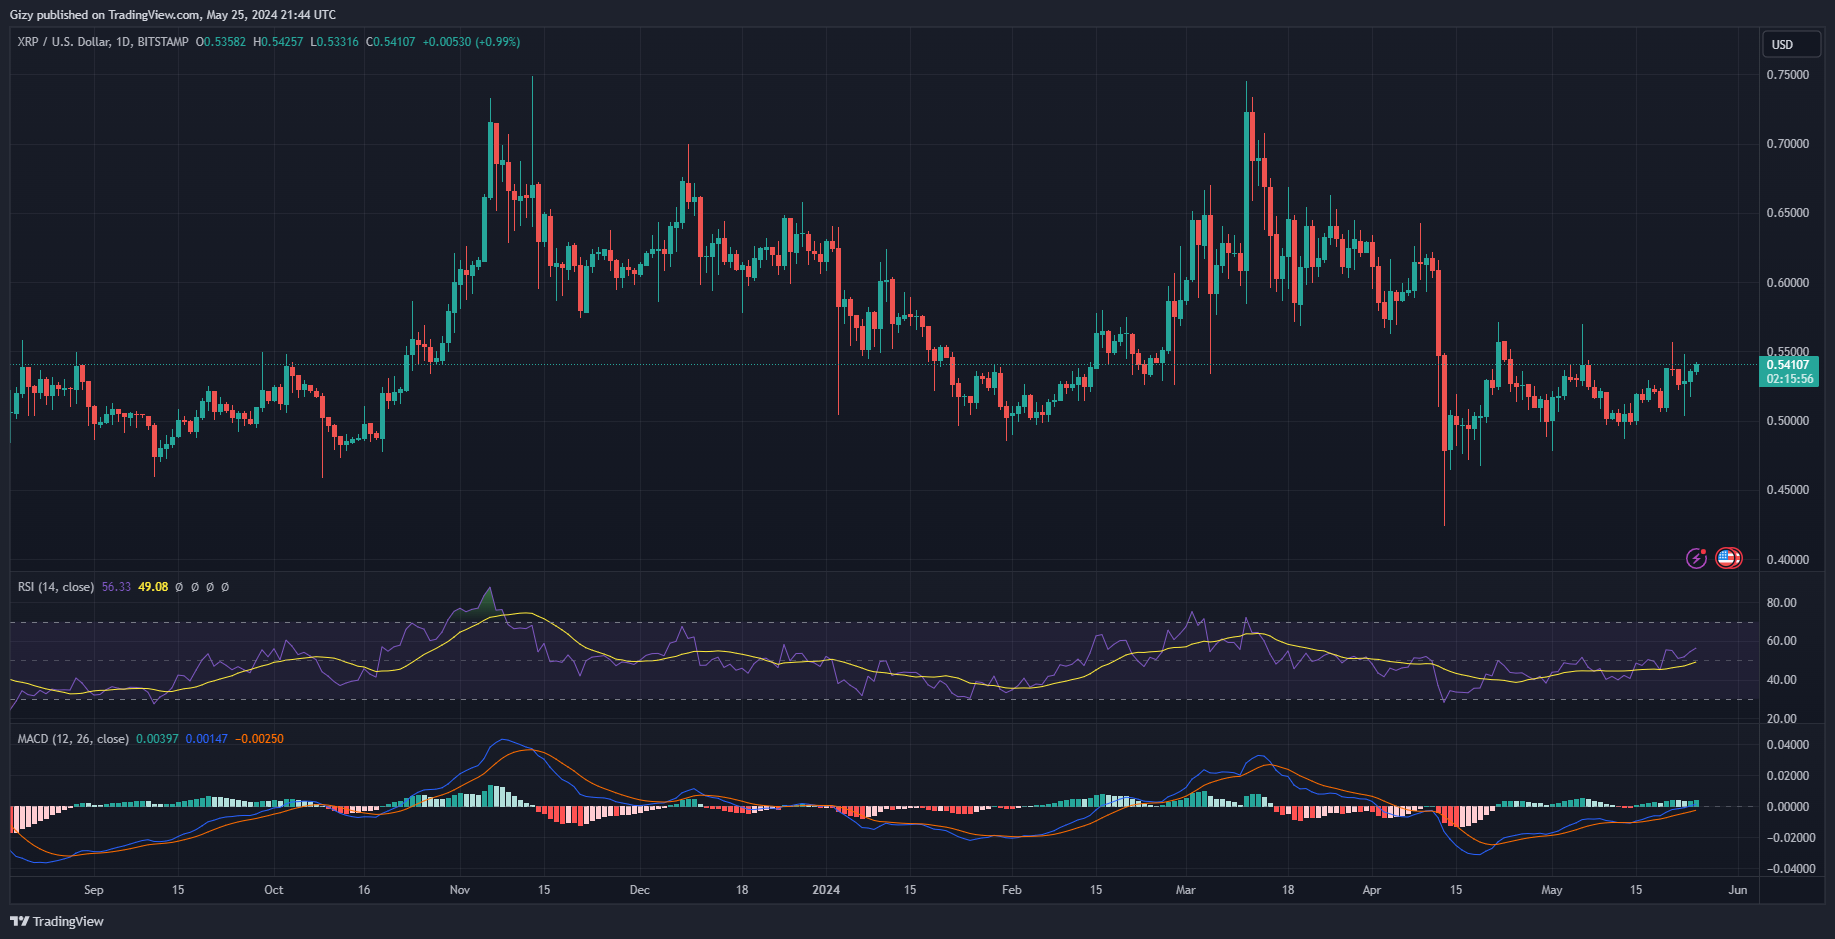
Nonetheless, since May 2, it has struggled to keep prices above $0.52. It enjoyed surges that saw it close with gains of more than 5%. It is worth noting that two days ago, the coin retraced to retest the $0.50 support but rebounded.
The current price trajectory suggests that the asset will test $0.55 if the uptrend continues. It will continue to hold on to the pivot point at $0.52.
The relative strength index is at 55 which places the bulls at an advantage. Additionally, it is on an uptrend which indicates growing buying pressure. Nonetheless, the accumulation and distribution chart suggests a gradual drop in trading volume.
Additionally, the moving average convergence divergence is silent following the bullish divergence a week ago. Both the 12-day and 26-day EMA are on the uptrend which tells that XRP is maintaining its bullish posture.
DOGE/USD
Dogecoin is seeing significant price changes at the time of writing. It is up by almost 4% as it edged closer to testing its seven-day high.
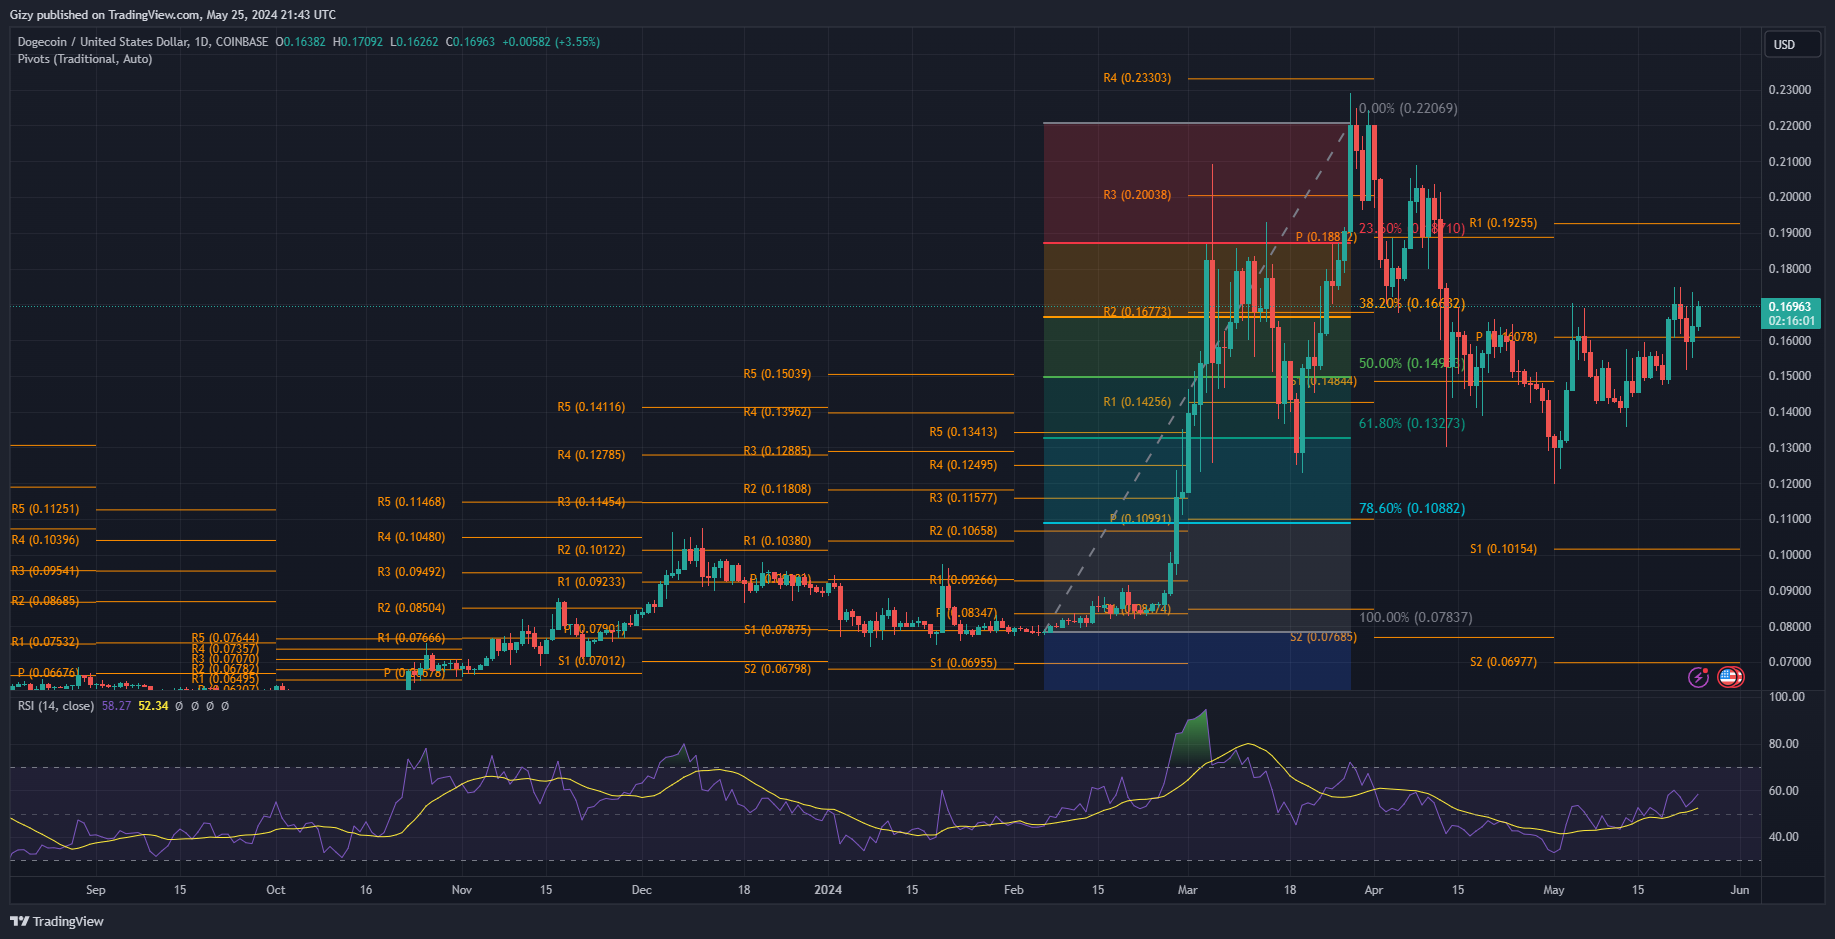
The most recent hike is a continuation of the previous day’s surge. It peaked at $0.173 and retraced to a low of $0.155. Nonetheless, it closed with gains of almost 3%. The current day’s increase confirms the coin’s U-turn from its downtrend.
RSI resumed its uptrend following the increase in buying volume. The change comes amidst the massive decline in trading volume. The volume dropped by 53% in the last 24 hours. Currently at 58, the bulls are at an advantage.
Nonetheless, MACD is also on the uptrend. It continues its buy signals as the 12-day and the 26-day EMA are still on the uptrend. The gap between the two metrics grew wider in response to the previous 48-hour trend.
Currently trading above the 38% Fibonacci retracement level at $0.166, the bulls will look to defend the mark and continue the uptrend. The mark is close to the pivot point. However, a change in market trajectory could send the token as low as low as the 50% Fib level at $0.15