


BTC prices over the last seven days was filled with a lot of volatility. During this period, the asset remained range-bound and failed to breakout. Nonetheless, it saw small changes in prices.
This trend closely mimics that of the global cryptocurrency market cap. Currently at $2.38 trillion, there was no notable change in value over the last 24 hours.
The much anticipated Bitcoin halving took place and is gradually coming to an end. Many BTC proponents were dissatisfied with how prices went and took to X to express themselves. They faulted ETFs as one of the reasons for the slow surge in prices.
The news on Solana also gained momentum. The project issued a new version for general use to reduce network congestion.
Other events with regard to prices took place. Let’s see how some assets in the top 10 performed.
Table of Contents
1. Bitcoin (BTC)
Bitcoin saw three consecutive greens as the anticipation for the halving grew. During this period, it gained over 5% as it climbed to a high of $65,600. Regardless of the small bullish moments it saw, it will end the current with losses of almost 2%.
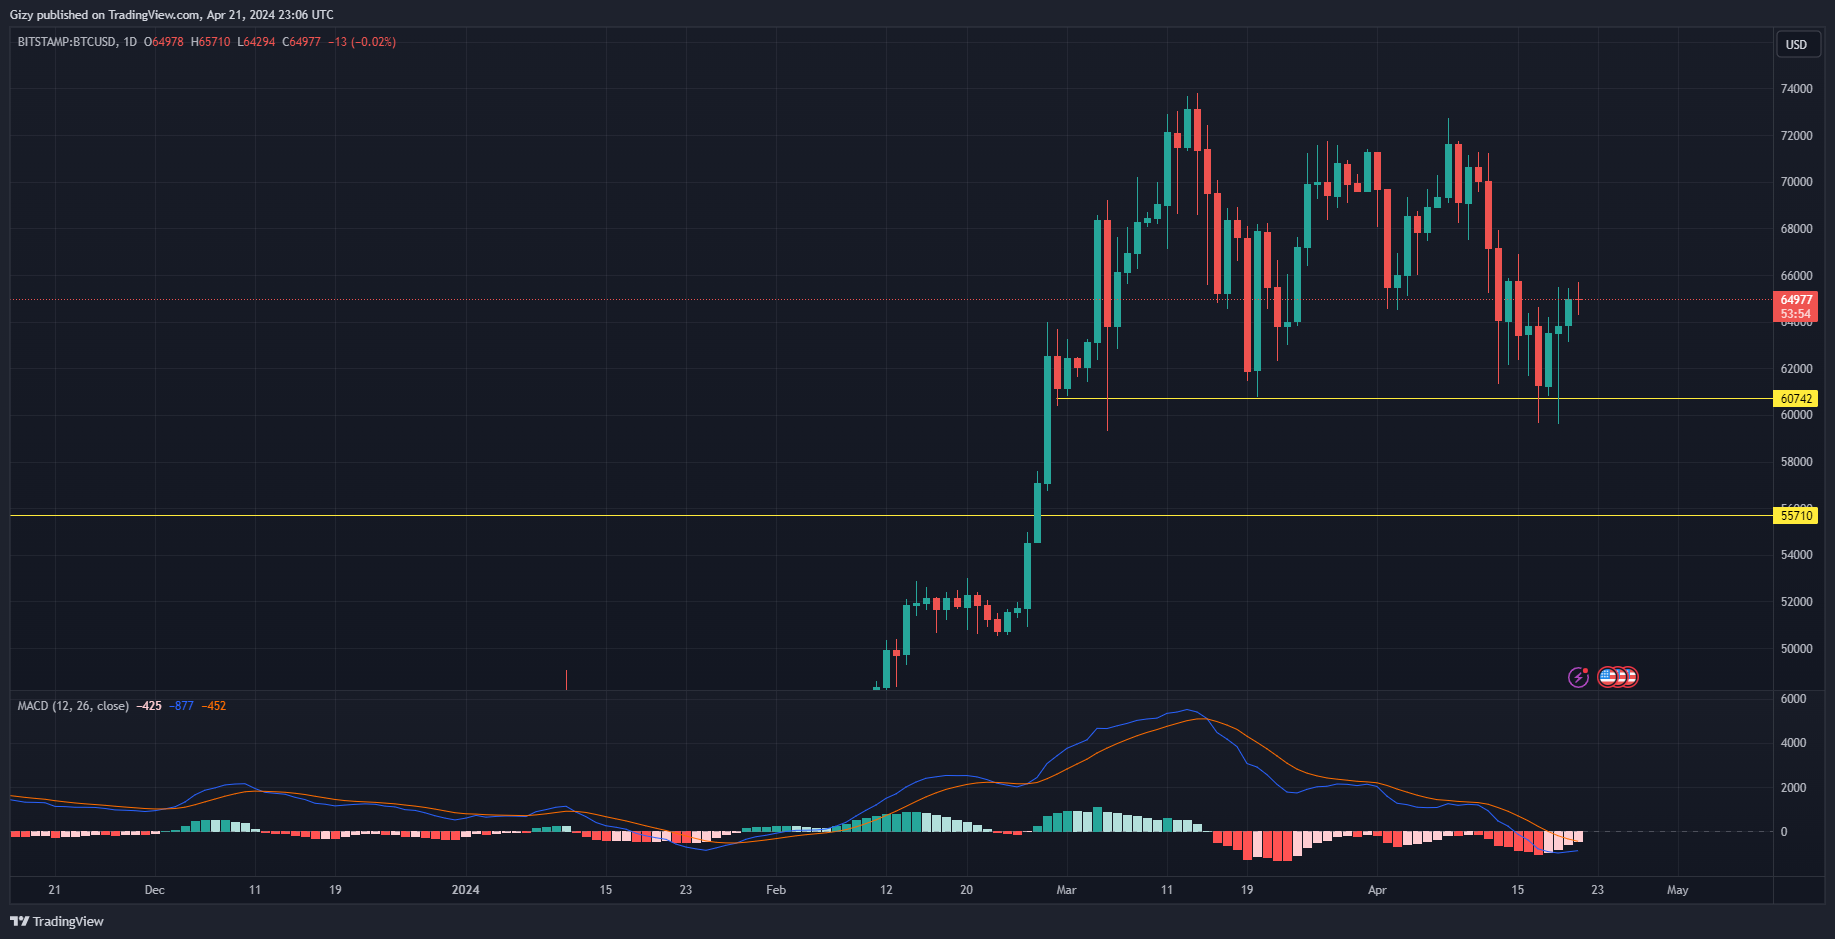
Currently printing a red candle, the apex coin is experiencing a small selloff following the notable gains it had. The decline came after it surged to a high of $65,710 and retraced due to small rejections. While the market is largely silent about the most recent moves, indicators are hinting at the resumption of the uptrend.
The moving average convergence divergence is printing buy signals at this time. The 12-day EMA is trending flat. However, the 26-day EMA is on a downtrend and will intercept its counterpart in a bullish convergence. Additionally, RSI readings show that in light of the small price decline, the apex coin is seeing a healthy amount of buying pressure.
A close above $65k today will offer the bulls more leverage to stir clear off $62k. Nonetheless, the previous price movement points to a possible correction below $64k. The buyers will look to flip BTC’s seven-day high at $66k to trigger a breakout.
2. Ethereum (ETH)
Ether is struggling with a small price decline after a failed attempt at $3,200. Currently printing a doji, the coin is yet to register any significant changes in value at this time. This is also the same candlestick it is printing on the weekly scale as it surged to a high of $3,280 and dropped to a low of $2,867 and is still trading close to its opening price.
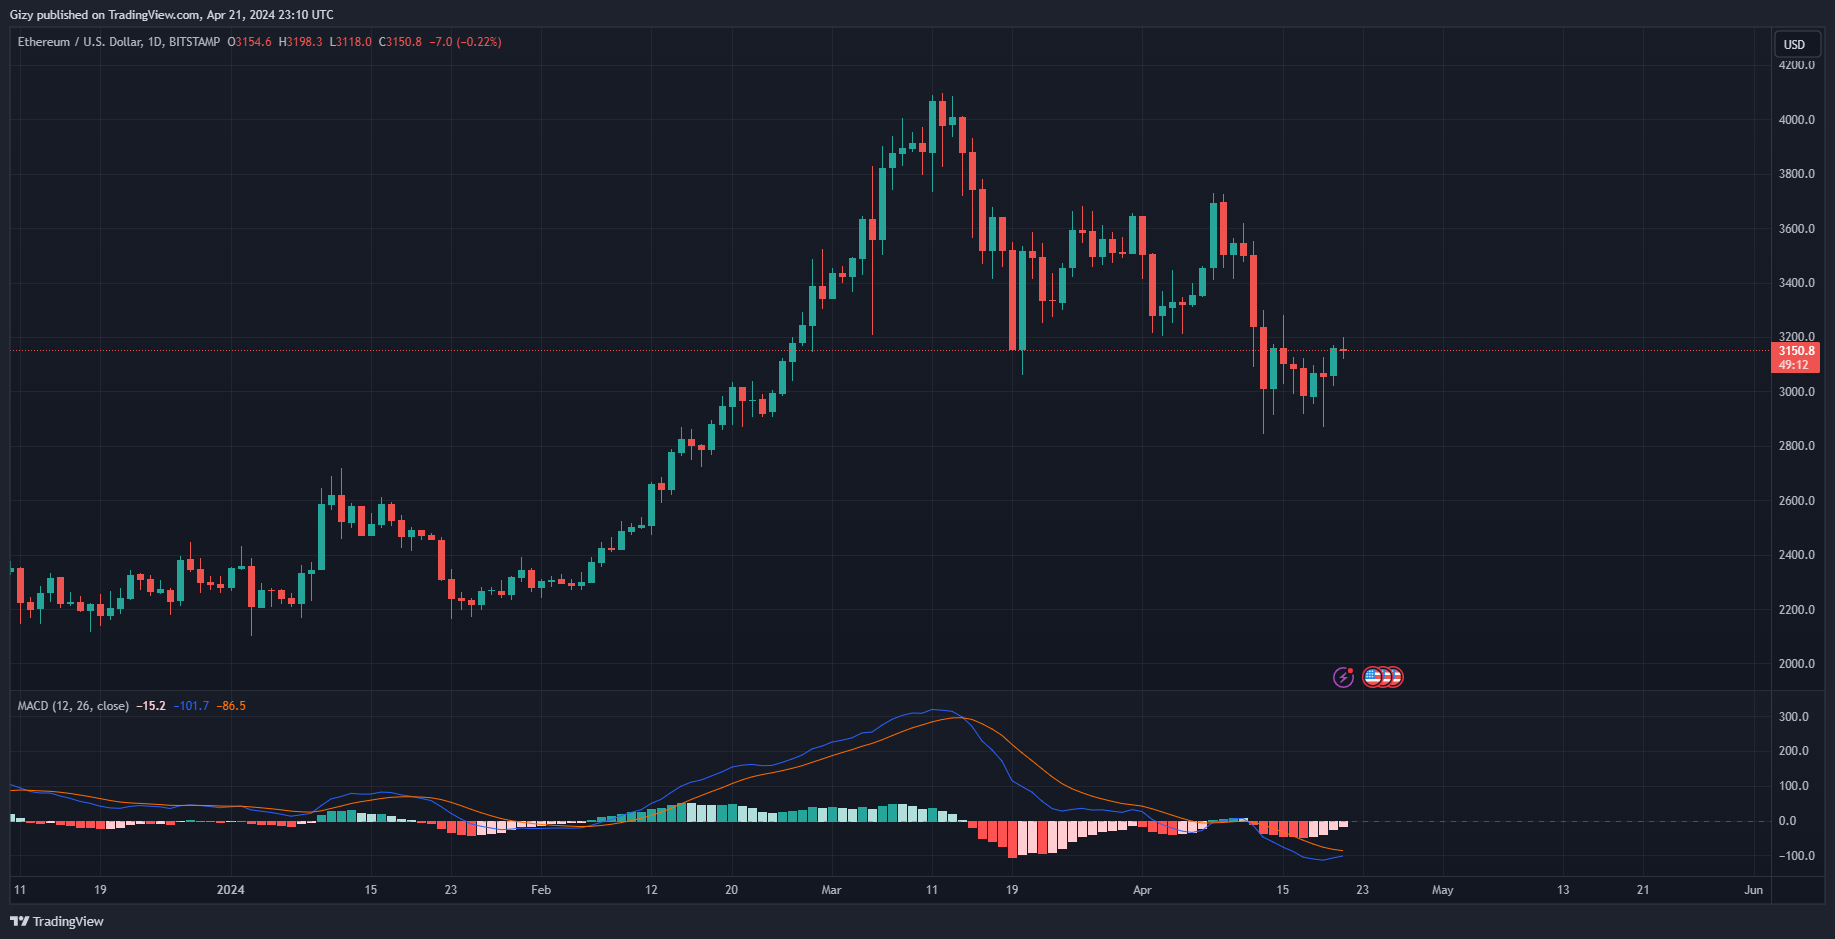
Nonetheless, indicators like MACD and RSI are hinting at an impending breakout. In the last three days, the coin gained almost 6%. Due to this, the 12-day EMA is on an uptrend. The metric is near the 26-day EMA which indicates an impending bullish divergence within the next 48 hours. The relative strength index also maintained it bullish posture.
With ETH experiencing notable buying pressure, the bulls will look to sustain the current pressure. A close at the current price will offer them an advantage to break the $3,200 resistance and attempt $3,400.
However, the bears will look to continue the previous trend and stage a selloff at $3,200. Previous price movement also points to another price struggle after ether flips $3,300
3. Binance Coin (BNB)
A green close during the current intraday session will mark the fourth consecutive for the asset. It’s been on an uptrend since Thursday as BTC and the rest of the crypto market picked up momentum. As a result, on the weekly scale, it is printing gains of over 2%.
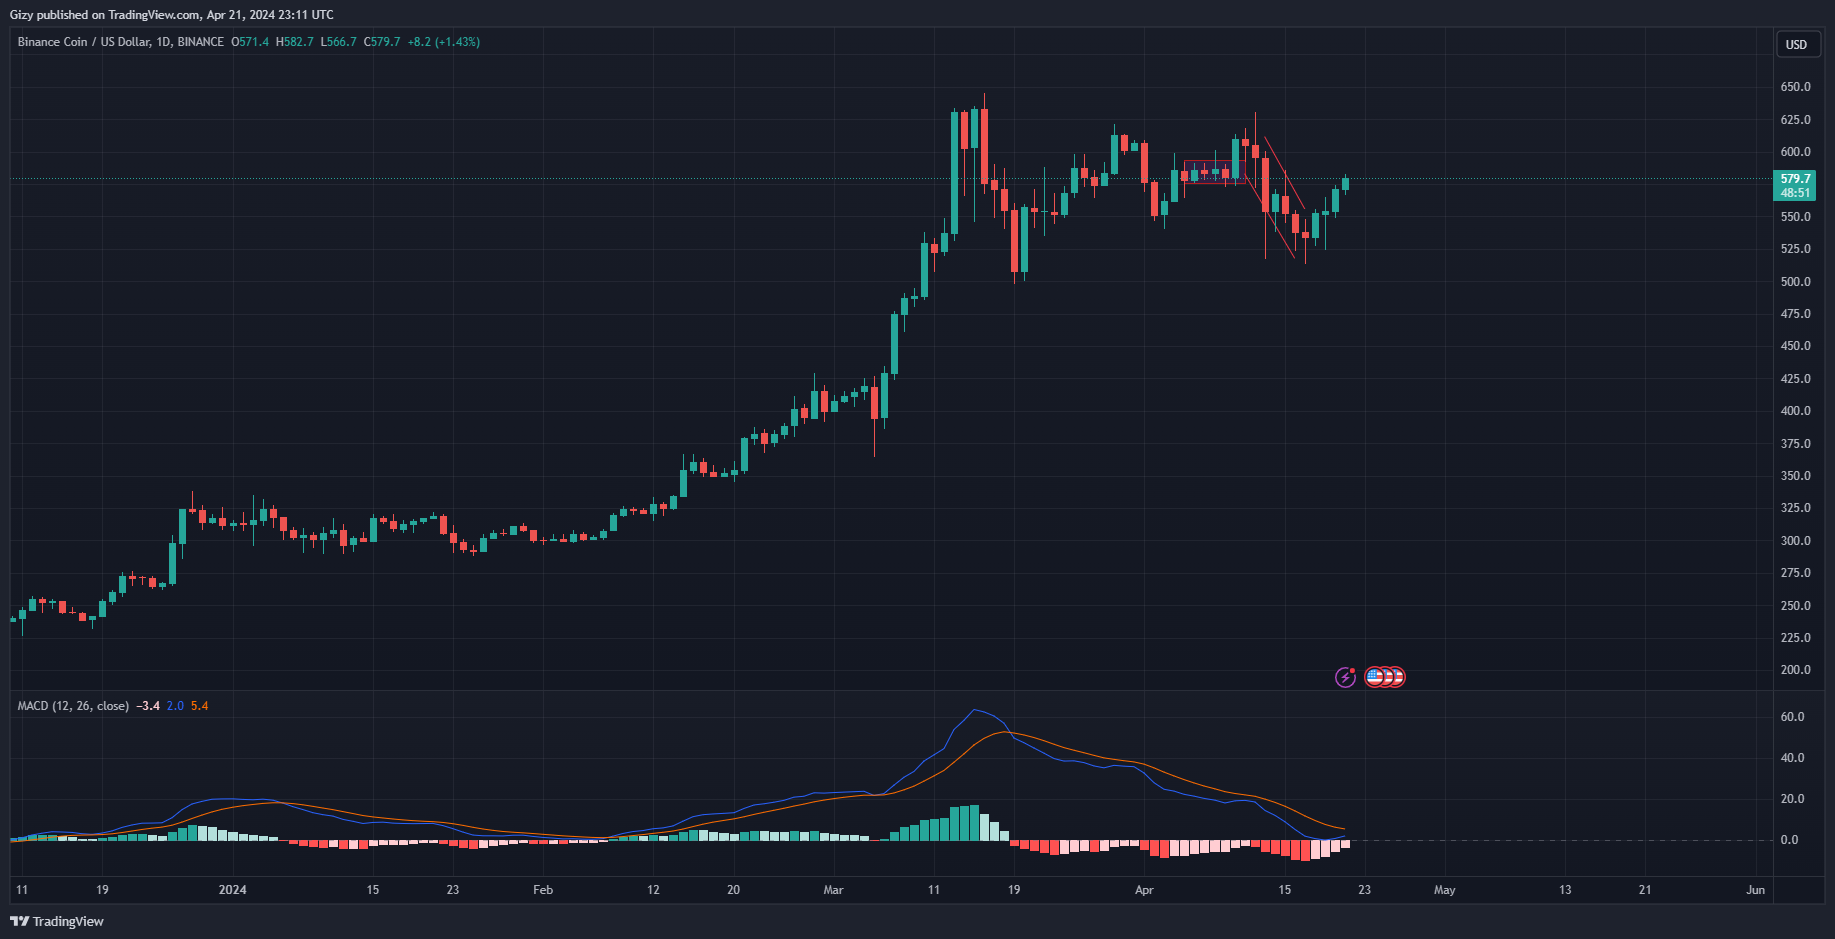
With the huge volatility the asset enjoyed in the last seven days, indicators are moving accordingly. For example, MACD is printing buy signals at this time. The histogram associated with it is showing a reduction in selling pressure as the volume gradually reduces. This is the same reading on RSI as it goes above 50 for the first time in last seven days.
Additionally, the 12-day EMA and 26-day EMA are gradually bridging the gap between them. In the ongoing bullish convergence, both EMAs will intercept within the next 48 hours if the bulls keep up the current buying pressure.
However, the bears will attempt to stage a selloff at $600. This will place BNB in its previous trend of trading within the $579 and $600. Nonetheless, the readings from indicators put the bulls at an advantage as they are gearing to flip this trend. They will attempt to build enough demand concentration at $580 before a breakout.
4. Solana (SOL)
Solana experienced an almost 8% increase on Thursday following the announcement of a possible fix to it congestion issues. Trading volume surged by over 20% in response and the asset ended the day above $140. However, due to the three-day decline at the start of the week, it is yet to register any notable price improvement on the weekly scale.
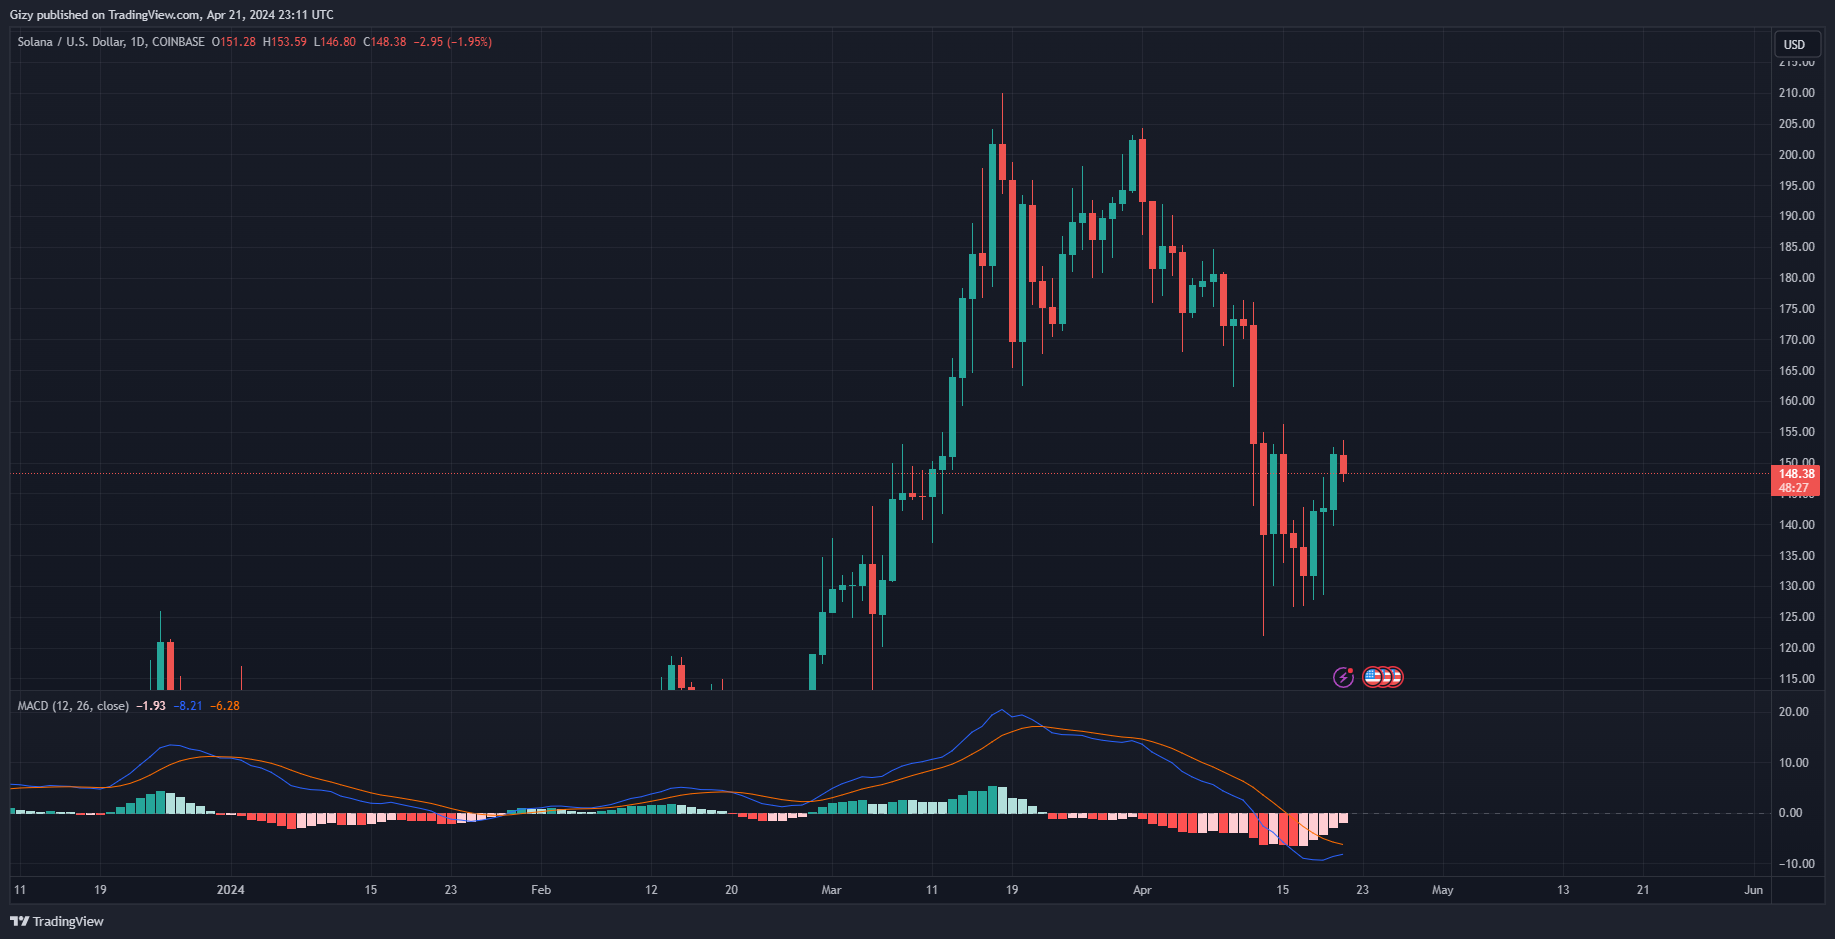
Currently struggling at $150, it is printing a red candle which may mean more price decline in the coming hour. The Accumulation and Distribution chart also depicts a possible decline in buying pressure and an equal price correlation.
However, the moving average convergence divergence hints at a change in price trajectory. With the histogram turning pink showing a gradual decline in selling pressure, it also shows a steady rise in buying volume. The result is the small uptrend the 12-day EMA is seeing. In the coming week, SOL will see a bullish divergence.
In response, it will attempt to break $152. The current price decrease indicates that the bulls are gradually building demand concentration at $148. Sustaining prices within this region will offer the needed momentum to break $160.
It is also worth noting that the candlesticks pattern suggests that the asset had a bull flag and the the coin will see the effect in the coming days.
5. XRP
XRP spent the last seven days recovering from the previous week’s price decline. A notable trend during this period is the number of doji as it attempted to hold prices at a level. Following several drops to $0.46, it recovered and ended the day close to $0.49.
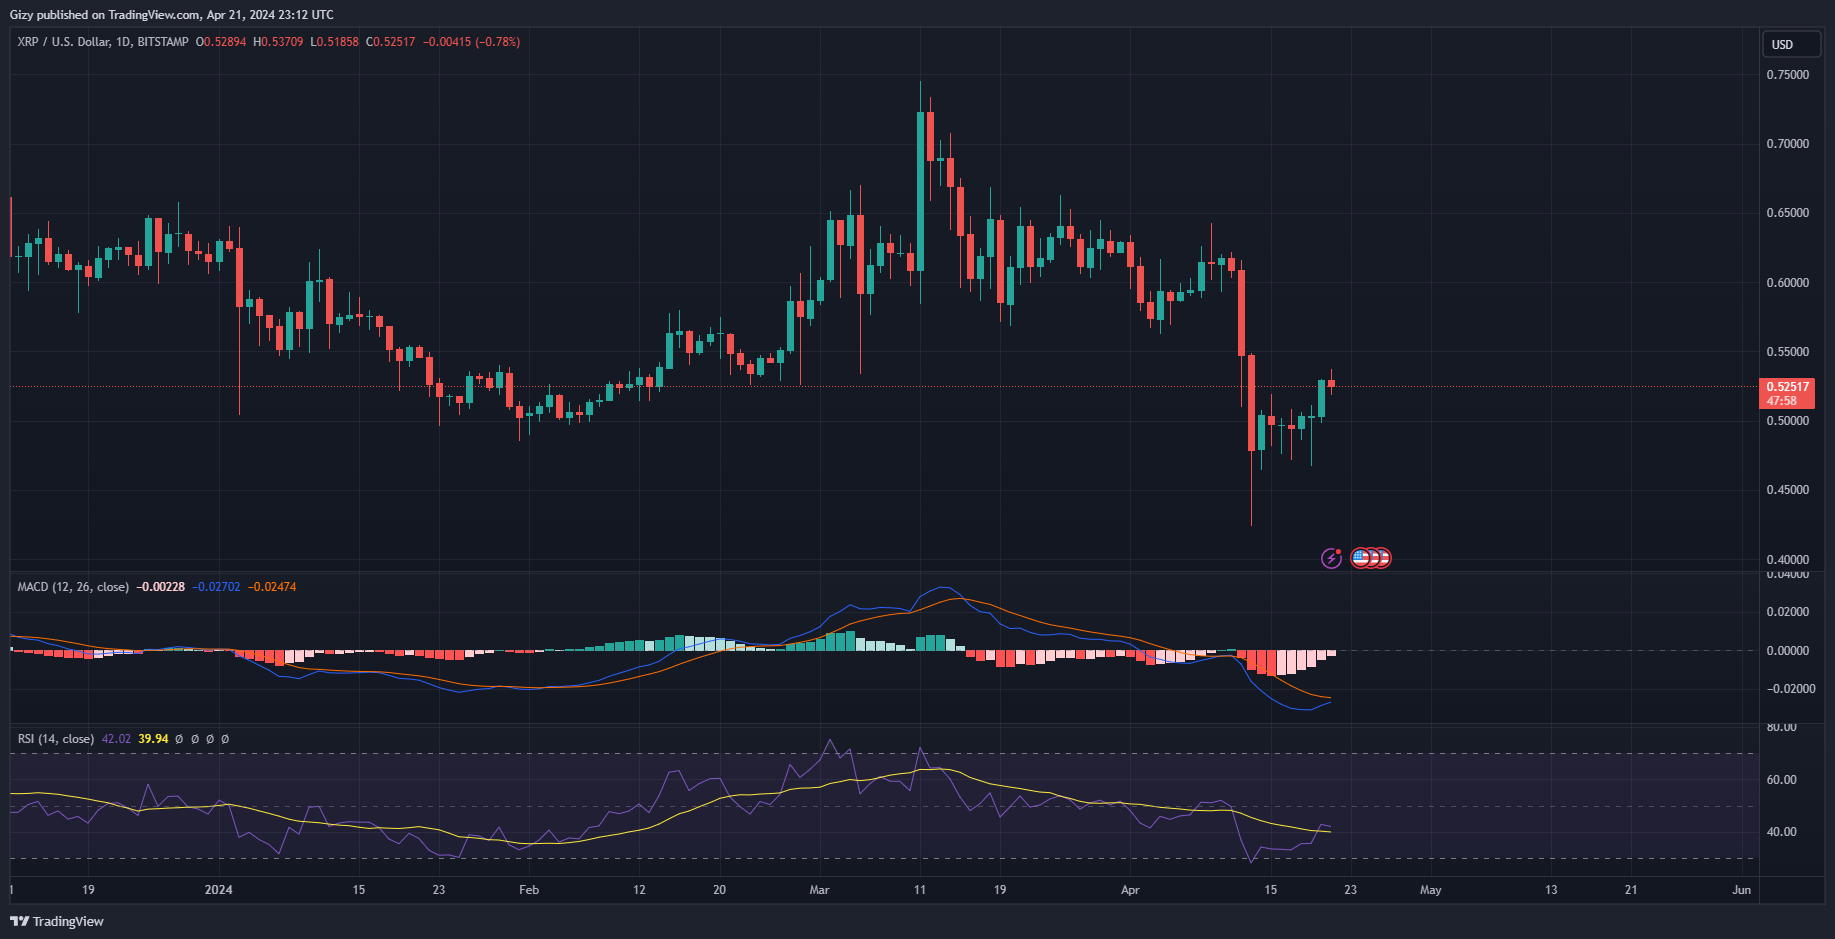
The previous day depicts a change in the altcoin movement. It gained over 5% as it returned $0.53. Nonetheless, the chart suggests that it is seeing small increase in selling pressure as it is struggling to keep prices above $0.52. It is worth noting that the current price is the first pivot support. Due to this, the coin must build momentum before testing the next critical mark.
RSI points a gradual decrease in buying pressure as it places the bears at an advantage. Still below 50, the metric is resuming its downtrend. However, MACD shows that XRP is maintaining its bullish trajectory. With both EMAs closing the gap between them, a bullish convergence is underway. Charts predict a divergence in the next 24 hours.
If this happens, the asset will bounce off $0.52 to reclaim $0.55. Based on previous price movements, there are no strong resistances until $0.57.
6. Dogecoin (DOGE)
DOGE joins the list of assets printing a red candle as it saw small losses. It failed to breakout from its seven-day high at $0.16. Nonetheless, before the current price struggles, it experienced a three-day hike that saw it over 7%. However, on the weekly scale, the asset is down by over 2%.
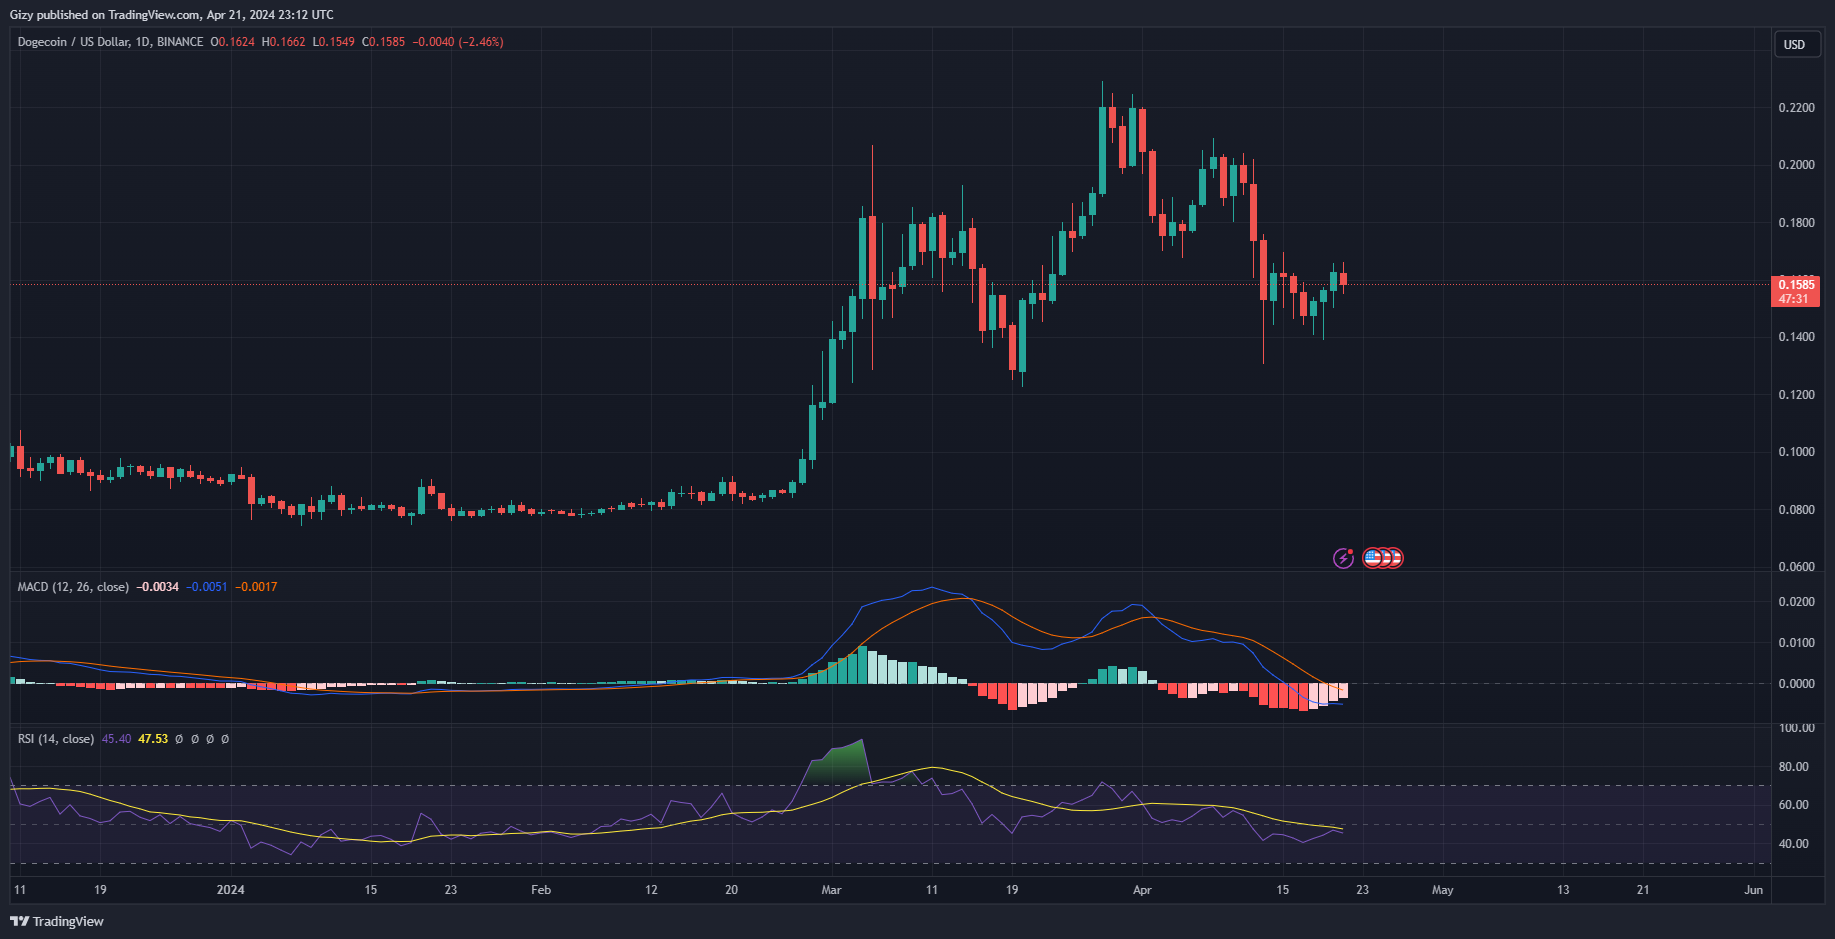
The bulls are accumulating around $0.16. Aside from price lingering around this mark, MACD suggests an impending uptrend in the coming days. The 12-day EMA is currently trending flat as the 26-day EMA continues its descent. With the ongoing bullish convergence, the coin must maintain the buying pressure it’s seeing to prevent further downtrends.
This is also what RSI hints as it is below 50 which places the bears at an advantage. The metric halted its uptrend due to the most recent change in trajectory. Nonetheless, MACD’s histogram points at a gradual decrease in selling volume which may explain the most recent slight decrease.
The bulls will look to continue accumulation in anticipation of a trigger. Following the introduction of the expected catalyst, the coin will flip $0.17. However, the bears staged selloffs around the mark more than once in the last seven days.
7. Toncoin (TON)
Toncoin continues price struggle at $6.14. It is down by over 9% on the weekly scale and indicators are hinting at further price decline.
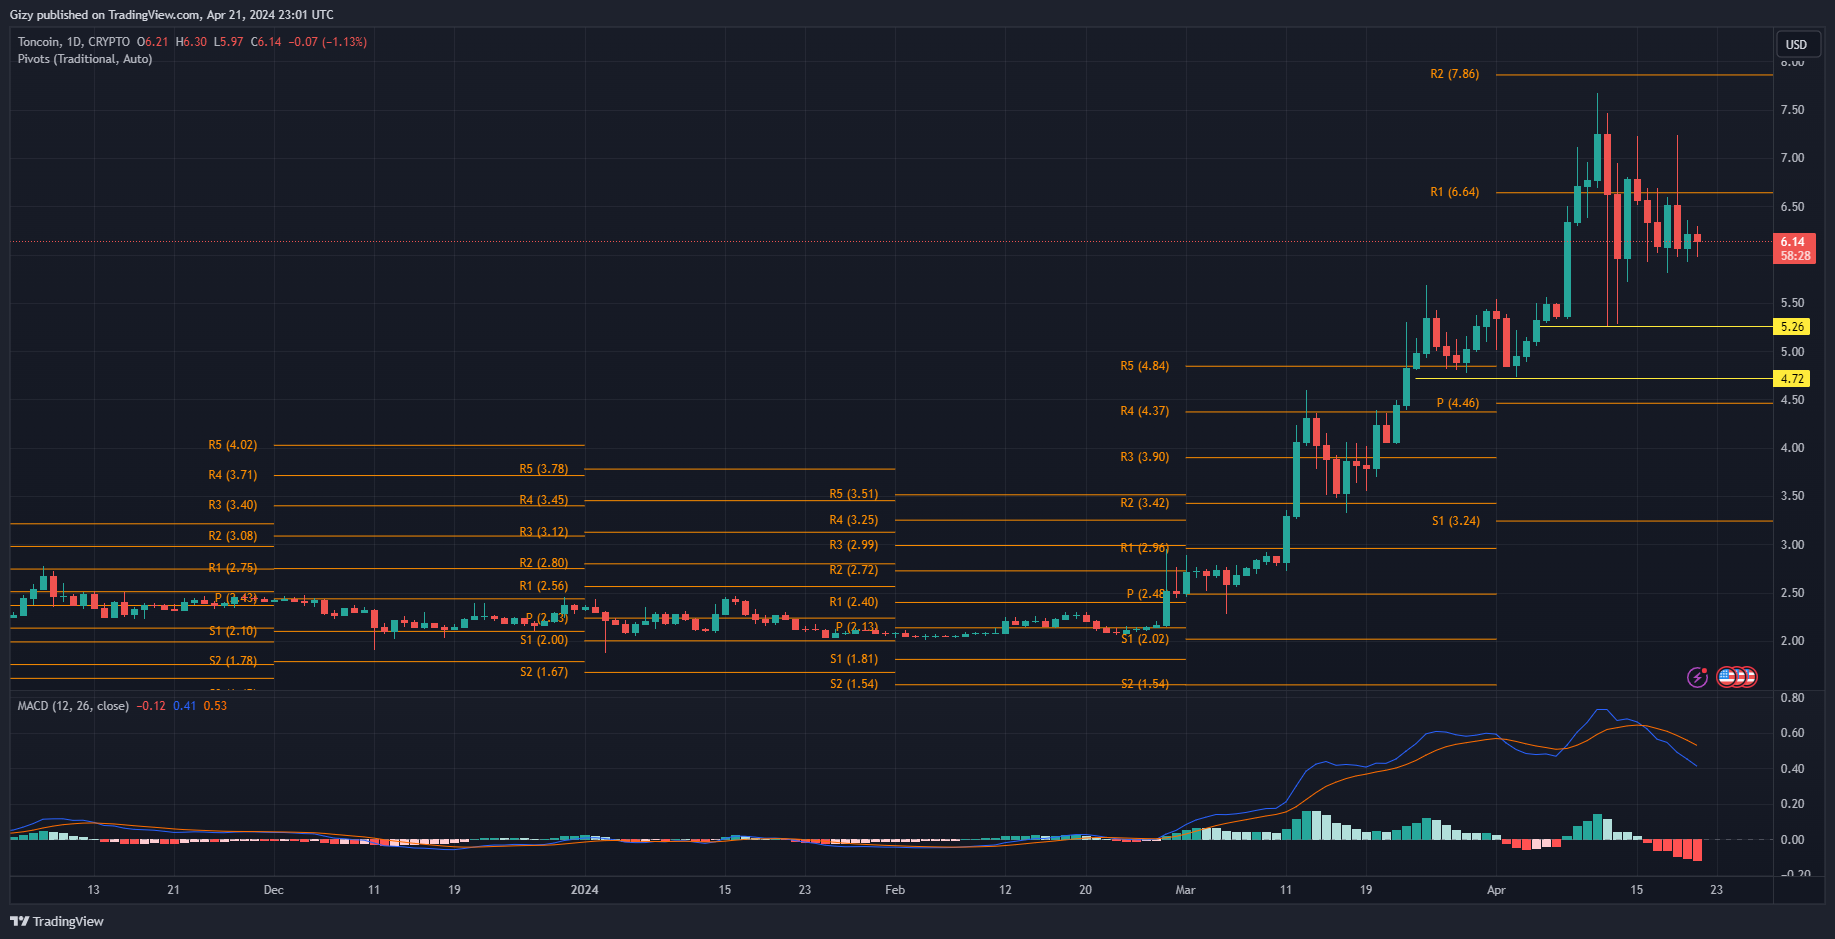
The moving average convergence divergence is on the downtrend and showing no signs of recovering selling pressure increases. This is the same reading on RSI as it goes lower and is at 53 in response to the growing bearish actions.
With indicators putting the bears at an advantage, they may continue the selloff and send TON as low as $5.26. On the other hand, the bulls will attempt to stage a buyback at the said mark.