

Cryptocurrency Analysis 12/04: BTC, ETH, BNB, SOL, XRP, DOGE, TON, ADA

BTC is currently seeing notable price declines. This comes after a previous intraday session of significant price increases.
The apex coin continues struggling to hold on to $69k as bears rampage on. it dipped to a low $68k a few hours ago as it continues to grapple with selling pressure.
In light of the increase in selling volume, Grayscale continues to move more Bitcoin to Coinbase. Many speculate that this is in a bid to sell. In addition to Grayscale’s actions, on-chain indicators also suggest that miners are selling at a moderate level.
Nonetheless, it is worth noting that the struggle for dominance rages as BTC sees considerable increases in funding rates, giving the bulls an almost non-existing edge. This is in addition to the small decrease in exchange reserves.
With both the bulls and bears having notable influence at this time, will bitcoin continue downwards or upwards? Will this also affect major altcoins? Let’s see what the chart says
Table of Contents
Bitcoin Price Analysis
BTC continues trading within a symmetric triangle. This means it is due for a breakout. As the triangle closes, the coin will see less volatility until its breakout. The decrease in price movements will owe to massive uncertainty as the halving draws closer.
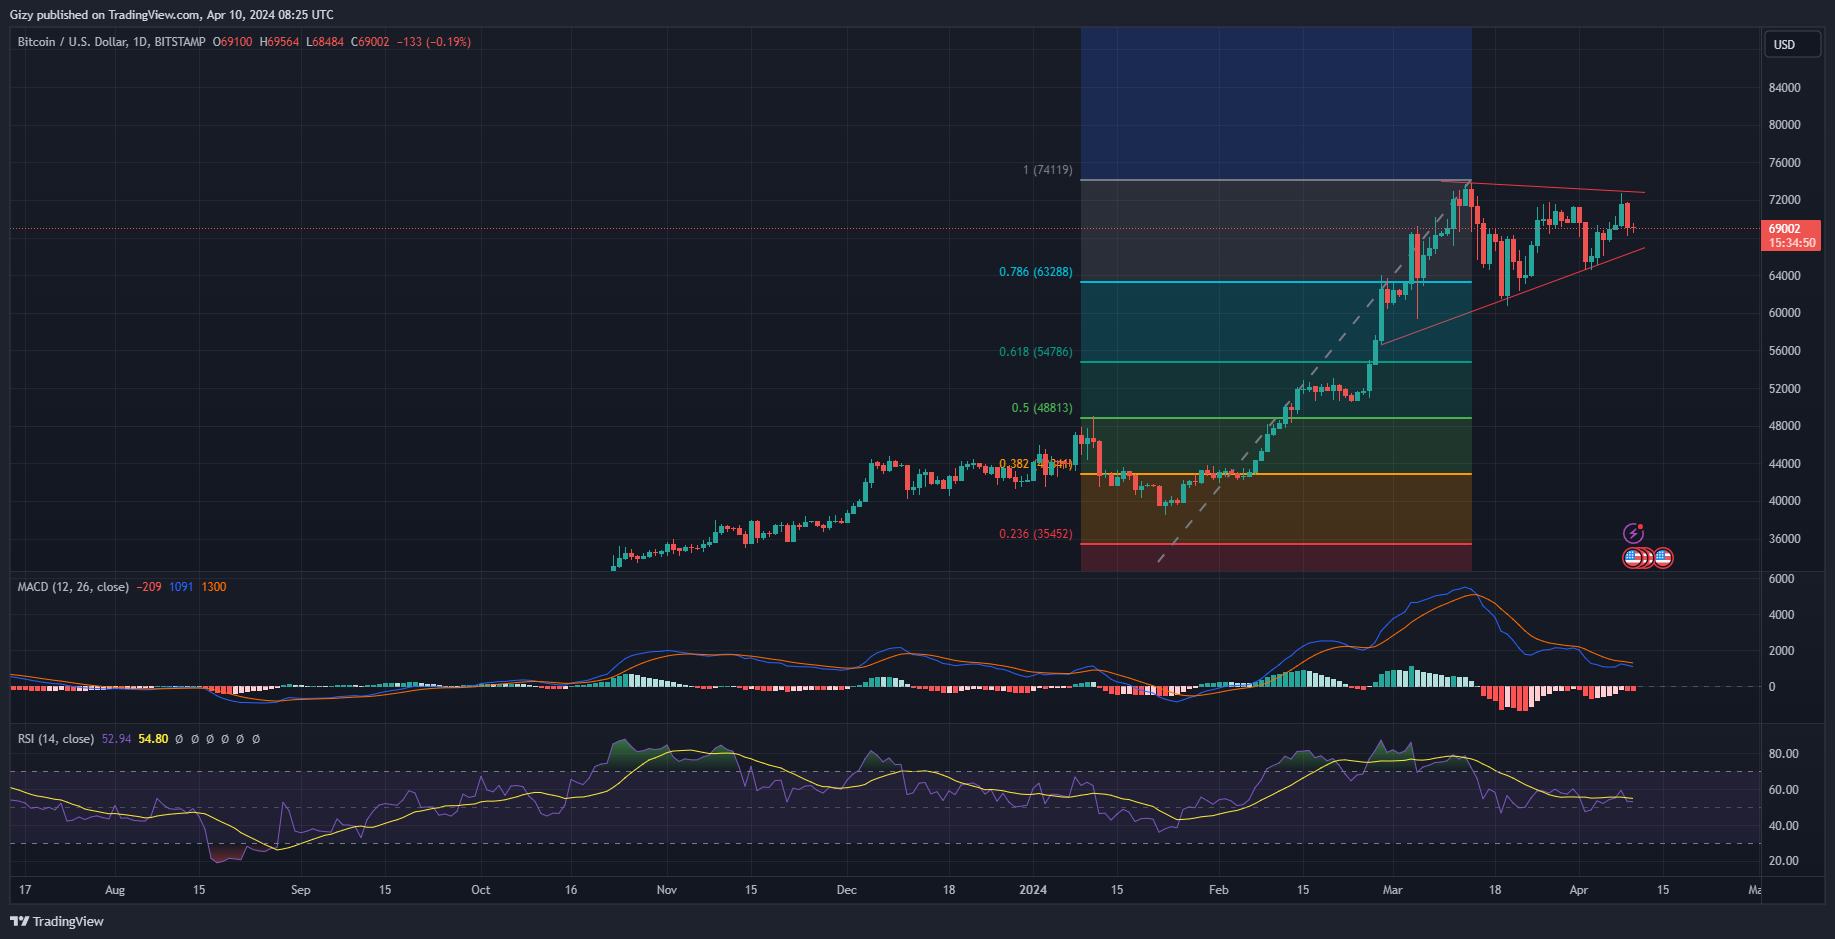
It is worth noting that some traders believe that the apex coin will not register a new ATH until after the said event. Indicators like the Relative Strength index agree with this speculation. A closer look at it shows it trending with 50-55 which suggests an almost equal dominance between the buyers and sellers.
Additionally, the Moving Average Convergence Divergence adds to the uncertainty in the next price action. The 12-day EMA continues to trend below the 26-day EMA. With both EMAs so close, it is a clear indication of an impending breakout.
A breakout to the top may guarantee a retest of the $72k resistance. The Fibonacci retracement also suggests a possible attempt at $74k. On the other hand, if the downtrend continues, BTC will retest $63k. Breaking it will result in an attempt at $60k.
Ether Price Analysis
Ether is currently trading within no glaring pattern. However, a closer look at the chart suggests that the coin is forming a bearish flag. As this pattern is slowly unfolding, the largest altcoin will register new highs and higher lows.
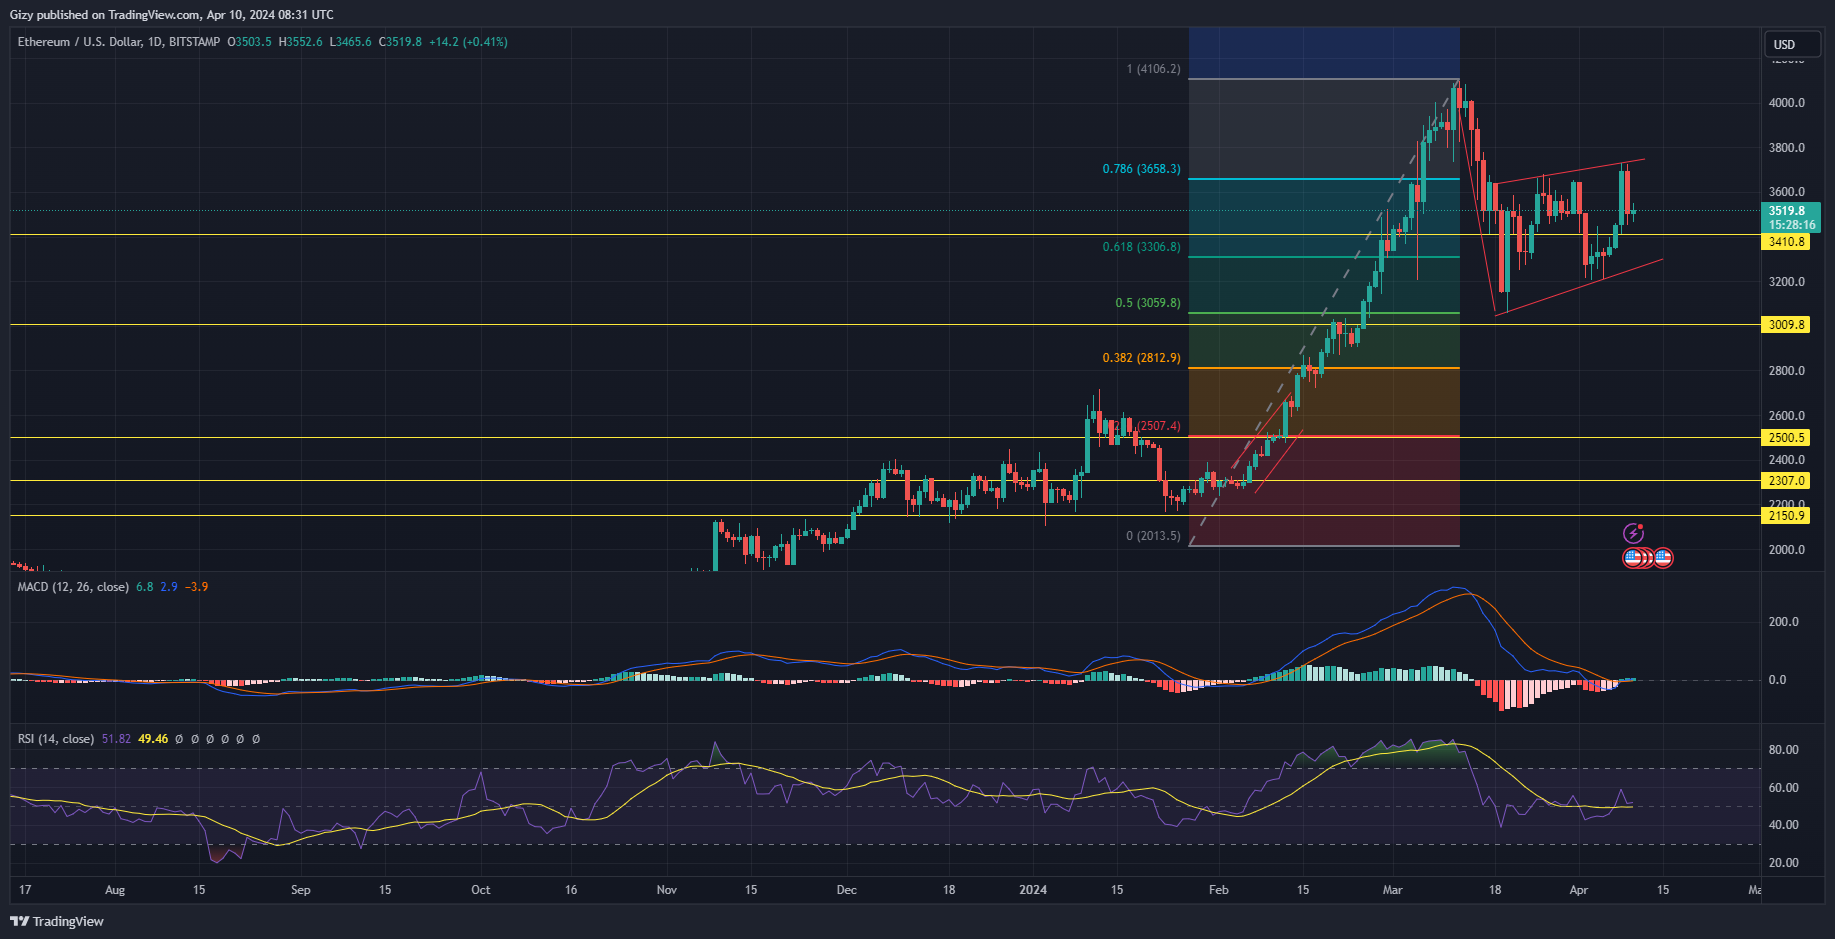
To this effect, MACD is printing bullish signals. The 12-day EMA intercepted the 26-day from below after the previous cross took place mid-March. As a momentum indicator, the reading indicates that ETH is seeing notable increases in value. This comes after it gained over 10% in three days.
However, RSI suggests that the most recent reading from MACD may hold little significance. The Relative Strength Index is currently at 51 which offers no clear advantage to either the bulls or bears.
As uncertainty in price rages, the Fibonacci retracement suggests possible levels. With the current price at $3,520, ETH will look to retest $3,700 in continuation of the bearish flag. With the forecast of higher highs and lows, the altcoin will hover around $3,460 (the closest support). If it fails, it’ll mean the buyers are still struggling to absorb the supply.
It may open the $3,300 support for a retest. Nonetheless, a rebound at this level will guarantee the continuation of the chart pattern.
BNB Price Analysis
Binance coin continues to trade within the $575 and $593 channel. It’s a clear indication of the struggle for dominance with both the bulls and bears scoring small breakouts. However, RSI is hinting the buyers have more advantage in this contest as slowly edges to 65, indicating a small increase in buying volume.
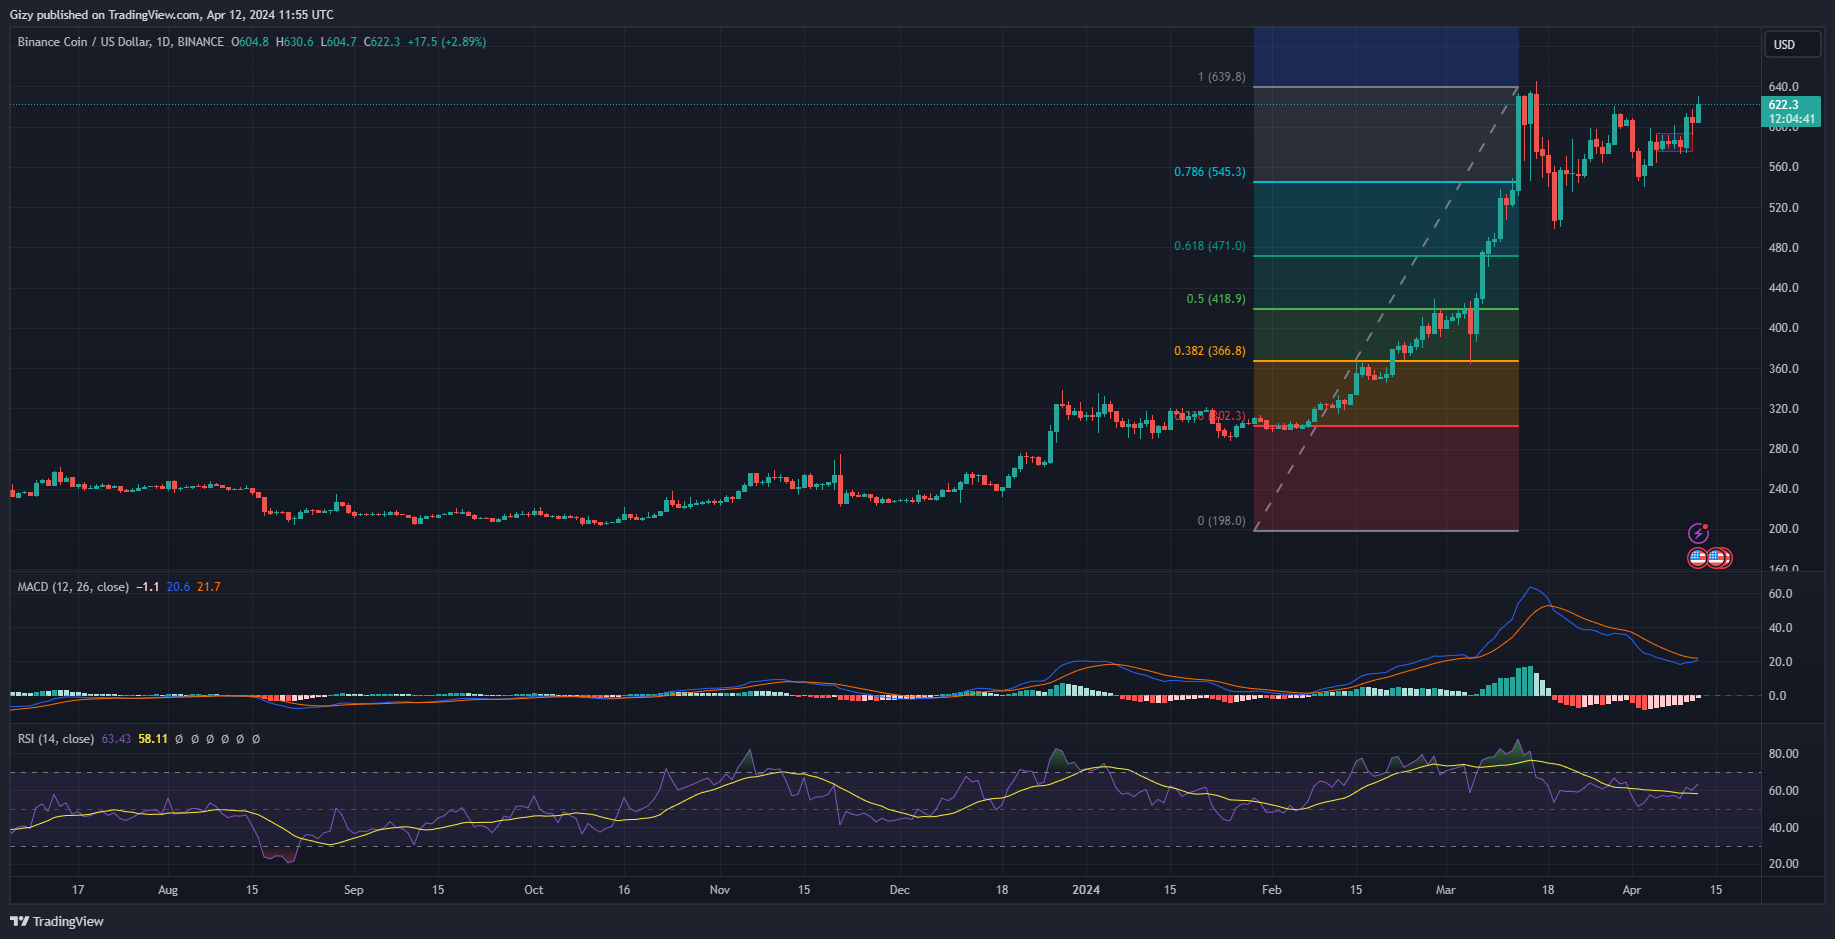
However, MACD is also reacting to the decrease in selling volume. The 12-day EMA is gradually surging upwards and in contact with the 26-day EMA. With the bullish convergence underway, BNB is bound to see more price increases.
The fibonacci retracement hints at the asset retesting its previous high at $640. As seen in previous times, a flip of the said resistance could open the coin for an attempt at $700. However, there are no huge market fundamentals disputing this speculation.
On the flip side, the coin is susceptible to small downtrends as the market continues to grapple with the incoming bitcoin halving. The highlighted chart drawing points to a retracement to $545. Nonetheless, before this attempt takes place, the $575 support is another tough mark.
Solana Price Analysis
The SOL/USD pair traded almost flat over the last three days. Wednesday gave many traders a jump scare as it retraced to $162. However, the buyers quickly soaked up the supply spike and the coin returned to its starting price.
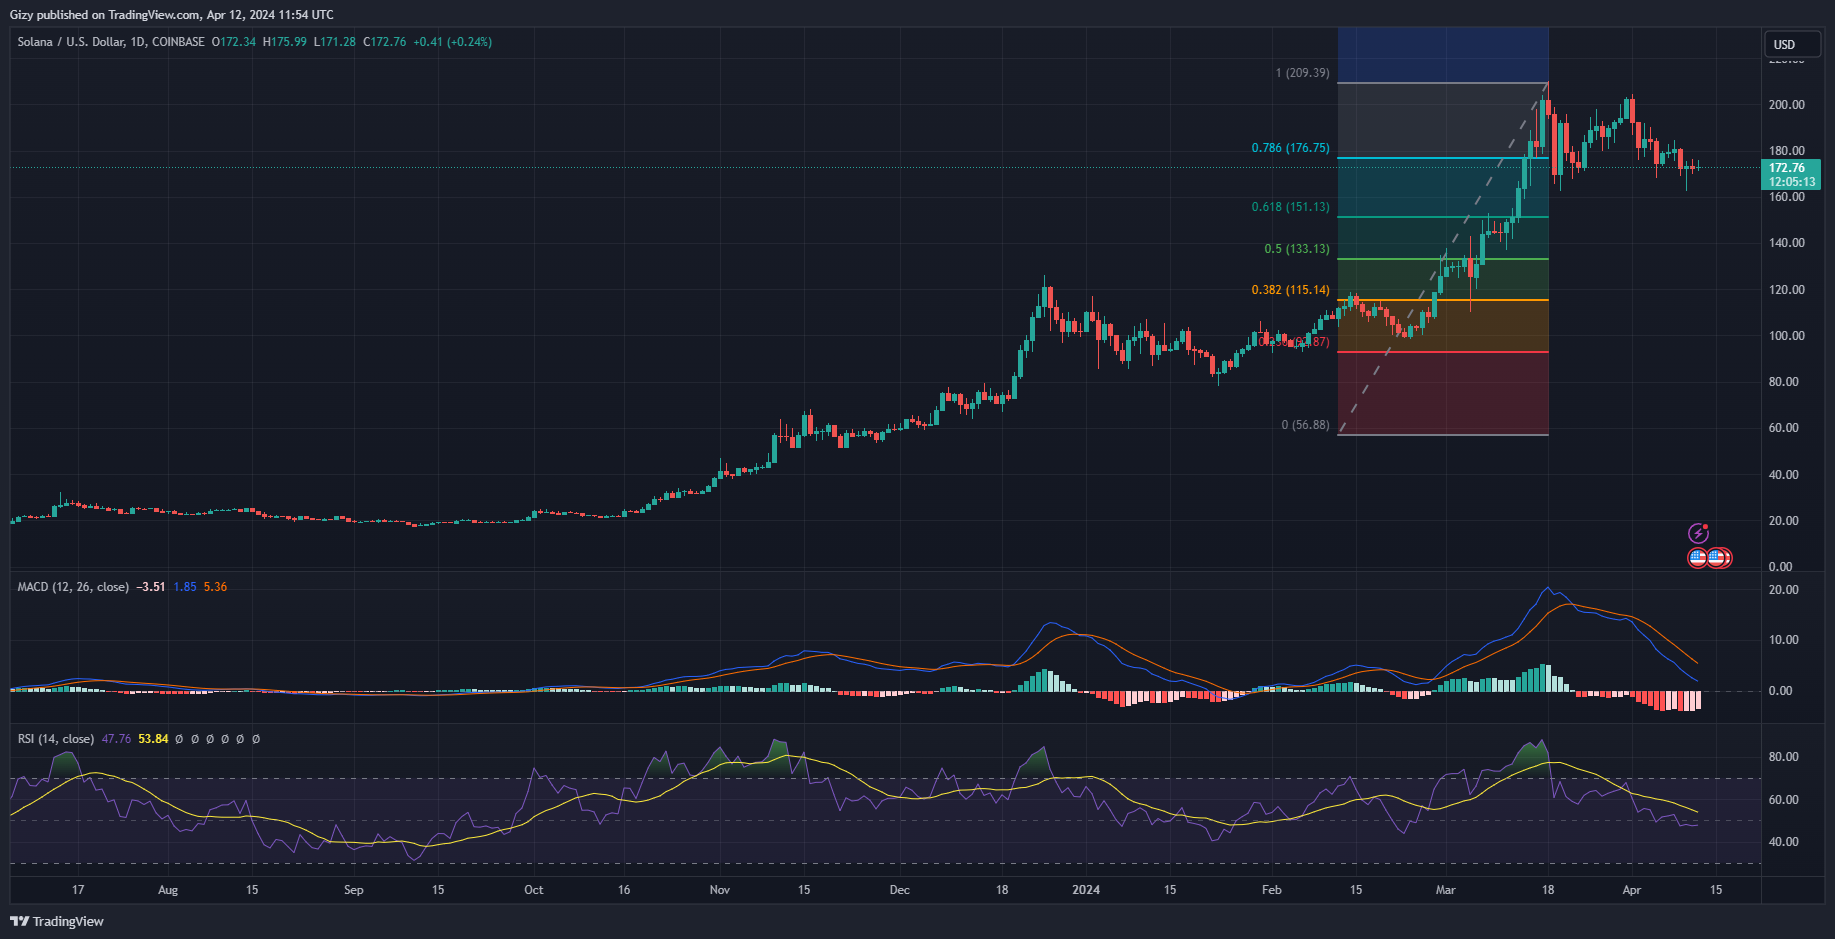
Since the decline, SOL recovered and has since traded flat. In response, RSI is is gradually taking a plunge as the asset continues to experience low volatility. However, its below 50 which shows the sellers are gradually edging in this contest.
MACD also offers the same insight. The 12-day EMA is on a downtrend as well as its counterpart. A closer look at the indicator shows no signs of any recovery.
As per the fibonacci retracement, it is important for the altcoin to continue the current trend, holding on to its support at $170. While the previous day suggests the bulls ability to absorb supply increases, a massive change in market sentiment will send SOL as low as $151.
Nonetheless, the same chart drawing rightly designate $176 as a tough resistance as the coin failed to flip it in the last three days. Breaking this psychological barrier will move the next price struggles to $186. The metric also suggested a return to $181.
Ripple Price Analysis
XRP continues to exhibit significant volatility until the current intraday session. It joined the list of altcoin that suffered a sudden spike in selling volume on Wednesday. Due to this, it retraced to a low of $0.59 but recivered as the bulls absorbed the excess supply. It ended the session at its opening price.
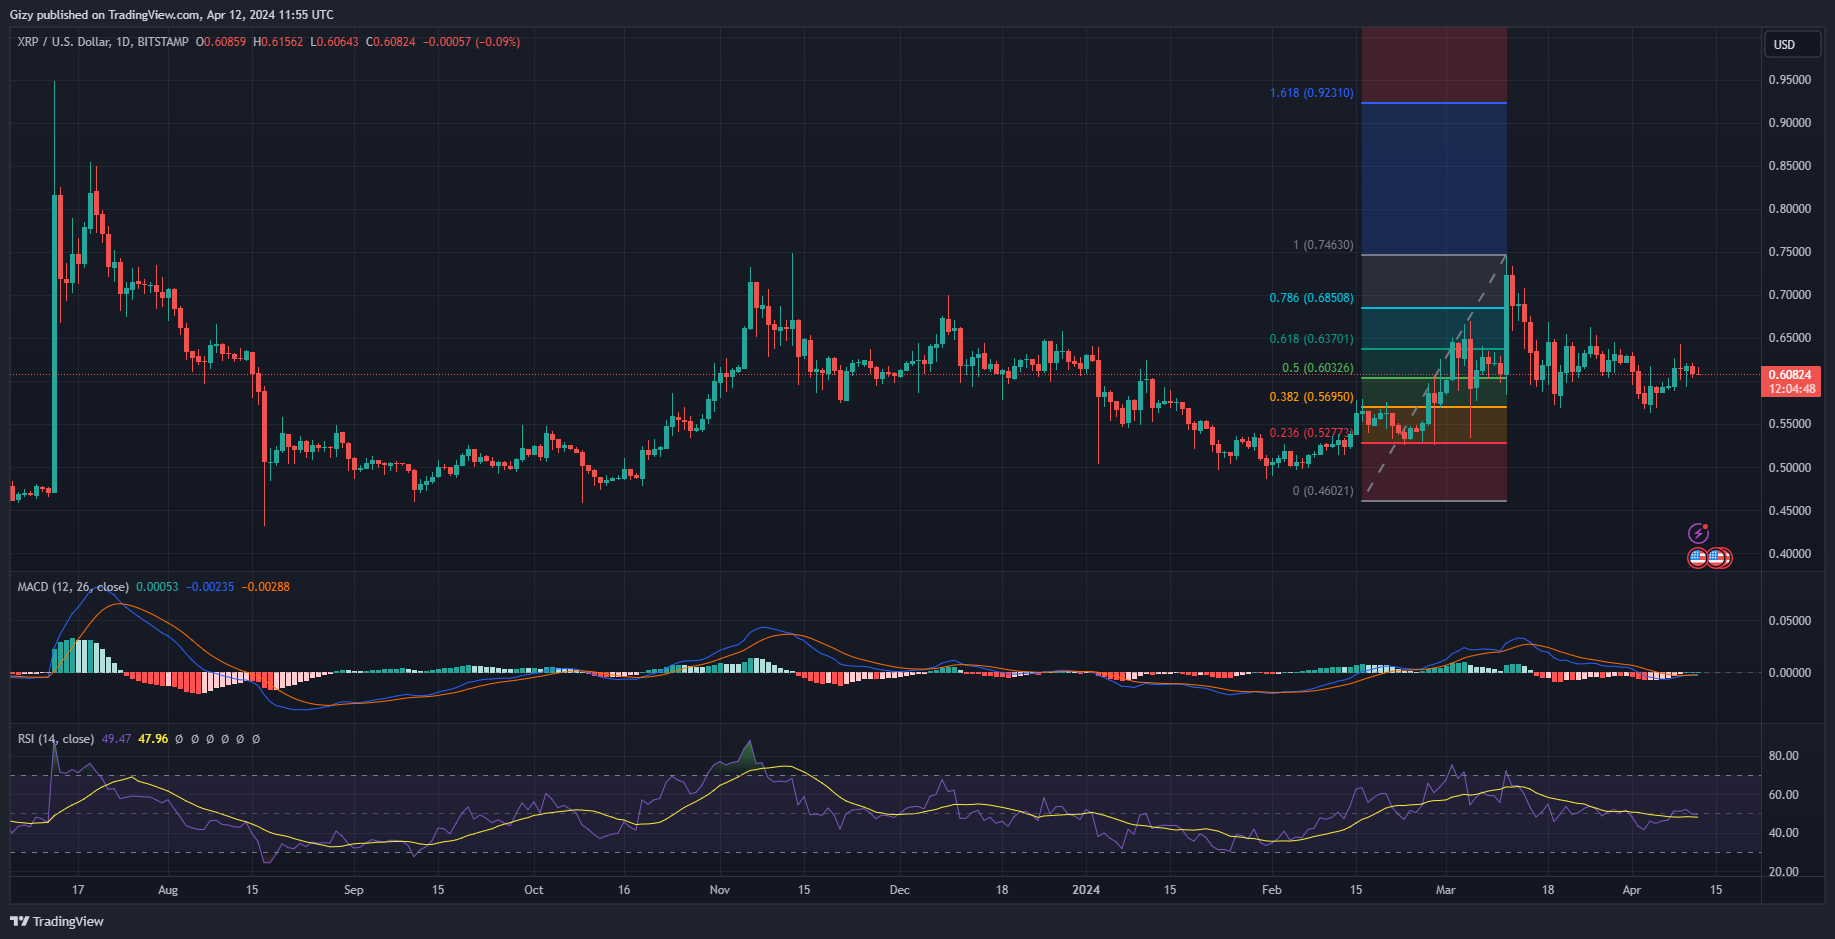
The decline came barely 24 hours after the altcoin retested $0.64. With that in the rearview, the coin has seen no significant improvement in prices. RSI offers no advantage to the buyers or sellers as its at 50. It depicts a notable decline in traders’ interest. Coinmmarketcap shows a 20% decline in trading volume over the last 24 hours.
However, per MACD, XRP may see more price increases. It showed a bullish divergence on Wednesday. Currently, the 12-day EMA is on a small uptrend, reflecting the small increase in price.
If the trend continues, the altcoin will attempt $0.63 and try break out from its fourteen-day high. However, the asset’s current price is shy of a critical support. Further slip will see it test $0.60. Failure to keep price at this level will result in the coin retracing as low as $0.56.
Dogecoin Price Analysis
For the past four days, the DOGE/USD pair exchanged between $0.18 and $0.20. It broke this barrier on a few occasions. However, the last 48 hours suggest that the channel is tinning. Nonetheless, of the highlighted period, Wednesday came off as the most volatile. Doge tested the $0.18 but rebounded. The day ended with the asset gaining more than 5%.
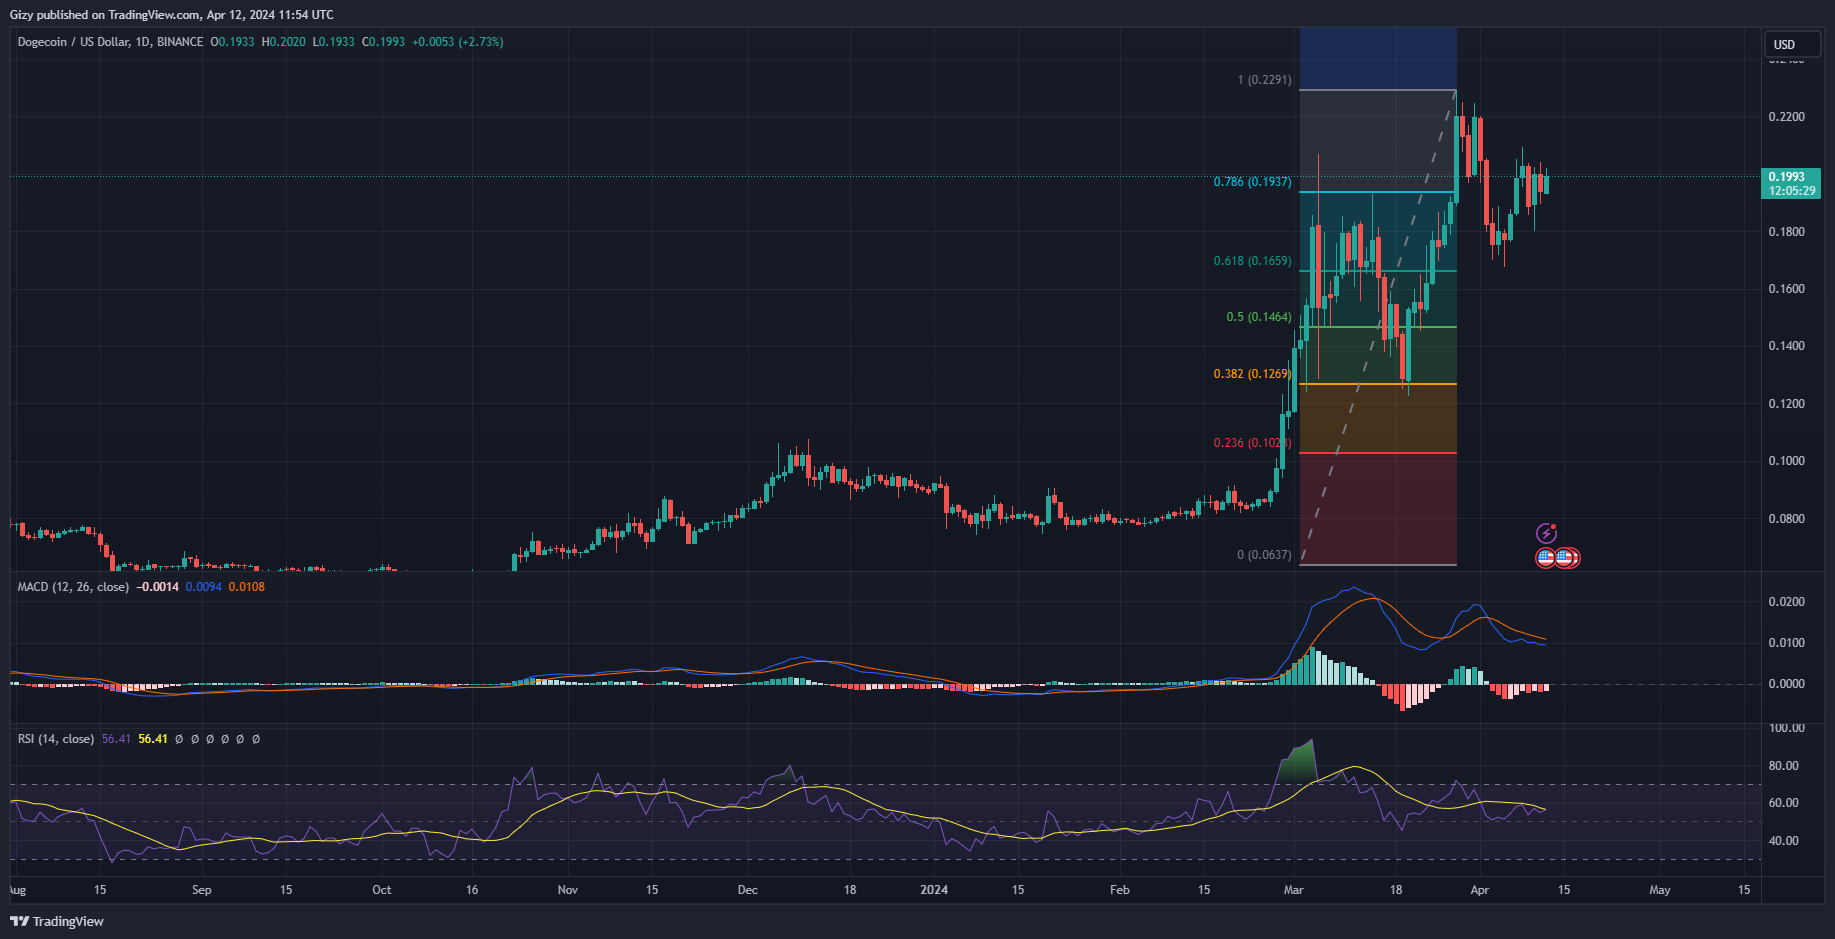
The decrease in trading volume explains the dwindling movement in price. Over the last 24 hours, dogecoin trading volume dropped by more than 20%. Nonetheless, the bulls are pushing prices as RSI suggests a small increase in buying volume. It is currently at 56.
However, MACD remains unfazed by this increase. The 12-day EMA continues gradual decline with no hint of stopping. The 26-day EMA is also experiencing the same trajectory. This comes as the bearish divergence continues.
At the current price, the asset is trading close to 0.78 Fibonacci which is at $0.193. In recent times, it bounced off $0.16. DOGE may repeat this trend as it is struggling at $0.19. Nonetheless, breaking its current trend will result in retest of the $0.22 resistance. On the other hand, if the coin flips $0.16, it will drop to $0.14 before rebound.
Toncoin Price Analysis
Toncoin has steadily climbed over the last seven days. During this period, it gained over 30%. The daily chart shows that it had one of its biggest surges on Monday as it tested $6.50 but failed to break it. Nonetheless, it registered gains of over 18% at the time.
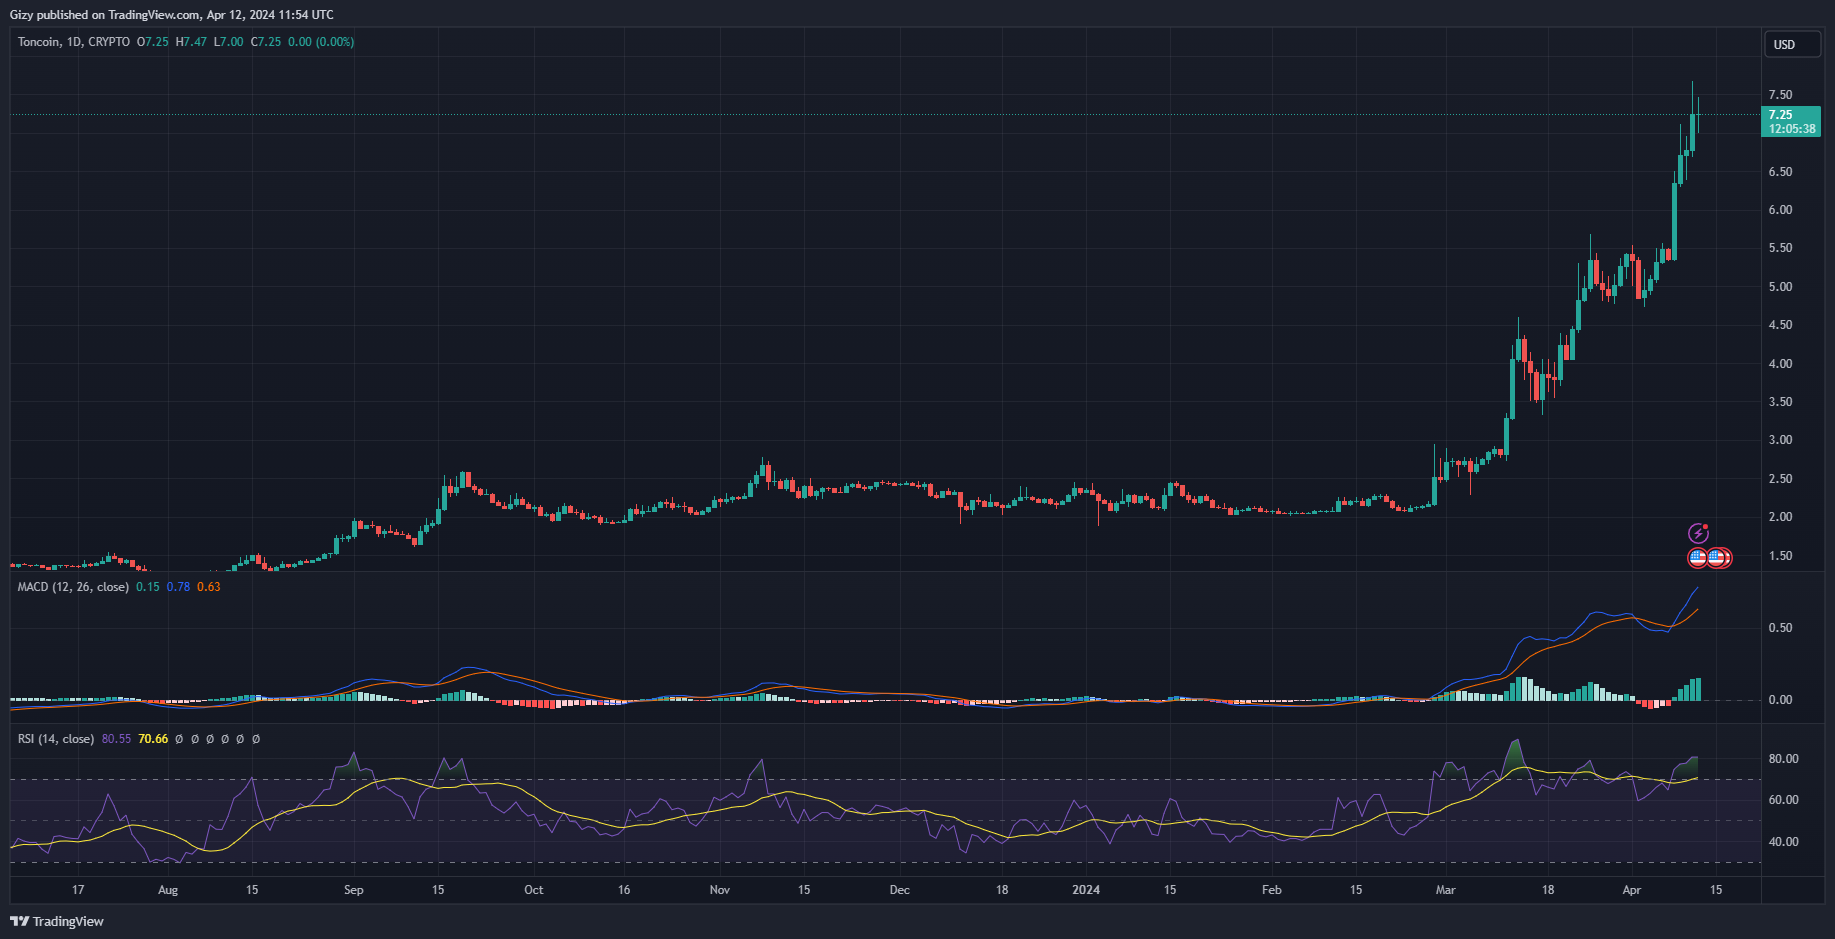
The current intraday session shows that the bulls are gradually running out of momentum. At the time of writing, a doji stands as the representation of the current action. Additionally, with traders’ interest dwindling, so too is trading volume. Over the last 24 hours, TON exchange value dropped by over 32% resulting a 2% decline in market cap.
RSI suggests that the coin will see more downtrends. One of the key levels to watch is the $6.35 support.