Author: Gideon Geoffrey

  • Top Four Memecoins That Made Waves in May

    Top Four Memecoins That Made Waves in May

    Memecoins are gradually becoming a strong part of the crypto industry. Over the last year, the crypto market has seen a lot of assets with this tag.

    In this article, we will go over some of these cryptocurrencies, how they performed this month, and they may move in the coming days

    Top Four Memecoins

    1. Dogecoin (DOGE)

    Dogecoin is back to its downtrend after it saw a small positive change in price last month. Over the last thirty-one days, the asset was mostly bearish as we noticed several red candles on the daily chart. As a result, the coin is down by more than 10% on the monthly scale.
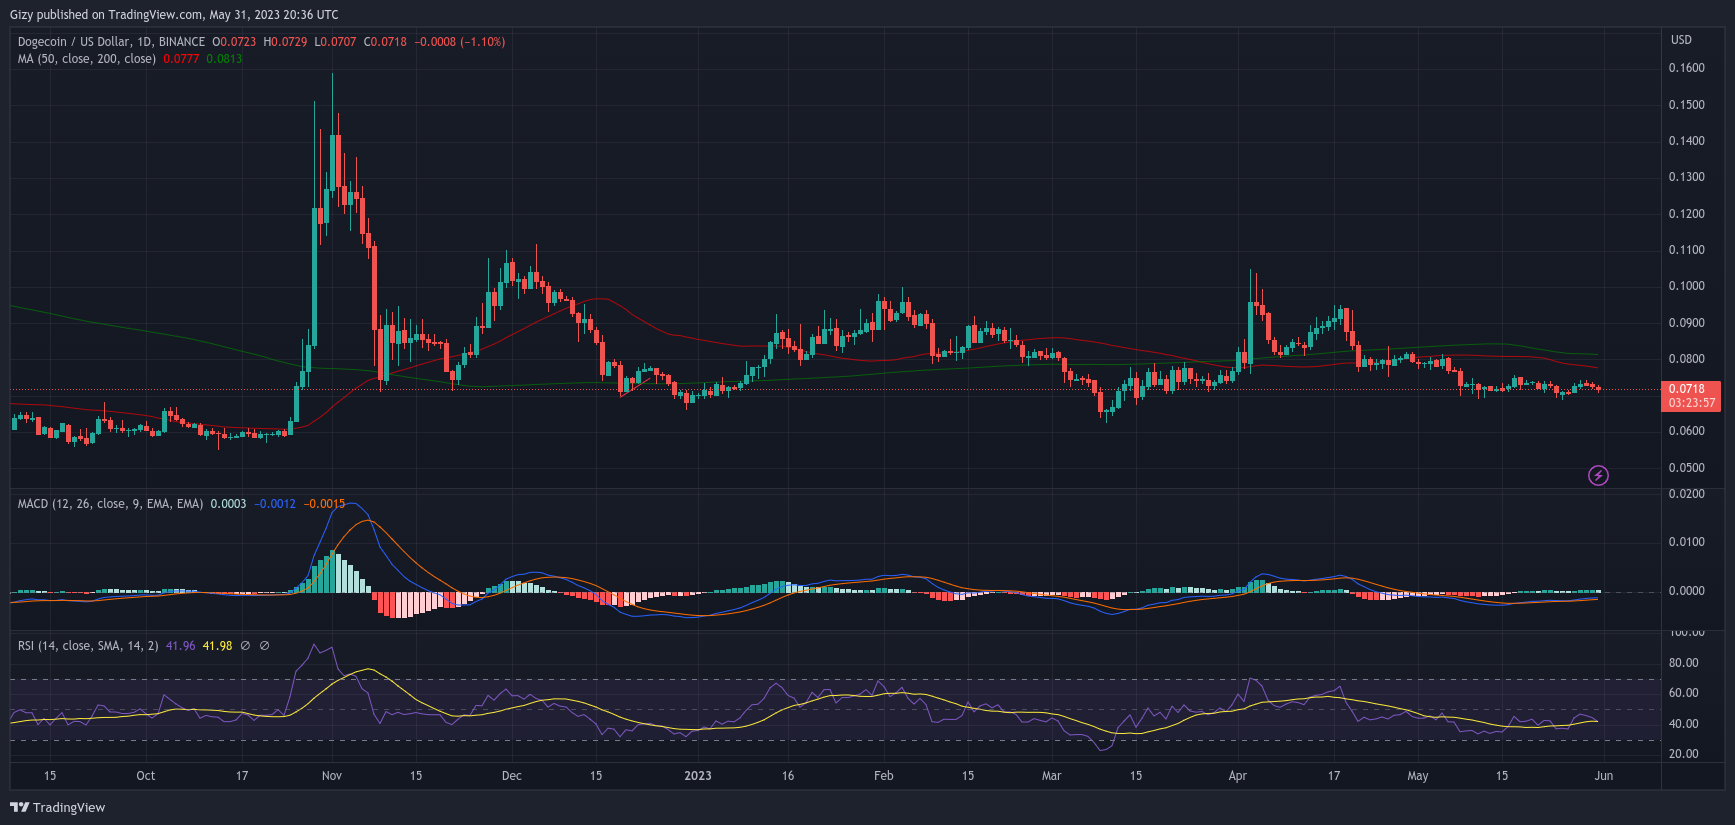
    Of the four weeks, only one was positive. The first week of May was bearish as the asset lost more than 3%. After facing rejection at $0.81, it started a downtrend that saw it retraced to a low of $0.76. Following this event, there was huge uncertainty as to further price movements.

    The next seven-day session was the most bearish is the altcoin recorded its loss. During the first day, DOGE opened trading at $0.076 and saw slight increases before the correction. It broke the $0.075 support and hit a low of $0.070 before rebounding. Although t closed a little higher, it failed to erase more than a 5% loss. The said mark flipped two days later as dogecoin hit a low of $0.069 before recovering.

    After losing $0.075 that Monday, that was the last time the asset had a close above it. Although it made an attempt it on May 17 with relative success, it retraced and closed at the mark. Another attempt took place last week Sunday. However, it failed as the altcoin peaked at $0.74.

    The last three days of the current month is spelling bad omen for dogecoin. Over the last three days, the coin is down by almost 3%. This is also having a notable impact on indicators.

    One such is the Moving Average Convergence Divergence. We noticed the 12-day EMA is slightly arched downward which may mark the start of a bearish divergence. Additionally, the Relative Strength Index is also on a downtrend and may fall below 40 within the next four days.

    One level to watch is the $0.070 support. Further slips may guarantee a retest of the $0.065 barrier. On the other hand, DOGE may attempt $0.080.

    2. Shiba Inu (SHIB)

    Shiba Inu continues its slip down the global cryptocurrency market cap ranking. A look at its performance this month explains the reason for this drop. The token is down by more than 16% over the last thirty–one days. This also marks its biggest loss over the last six months.
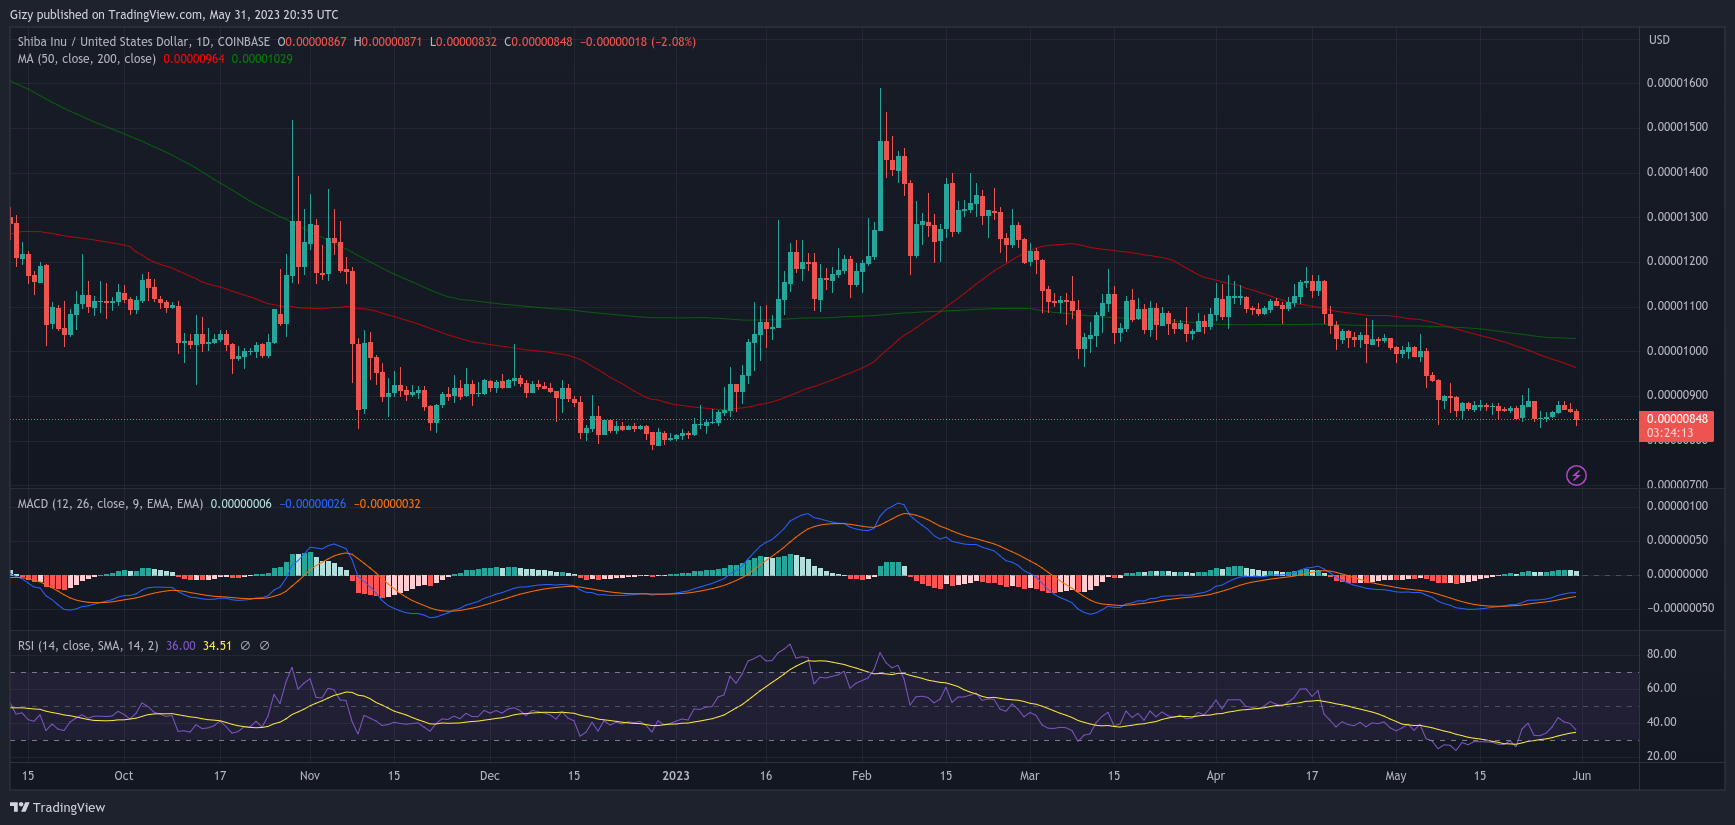
    Breaking the action down to the weekly charts, we noticed that asset under consideration started the month with traders expecting positive results. However, this never happened as it retraced after hitting a wall at the $0.00001040 resistance. It retraced and to a low of $0.00000919. Although it saw slight recovery, this was not enough to completely erase the losses. As a result, it closed with losses of more than 7%.

    The next week was not different as the asset lost another critical level. After its open, it faced strong selling pressure an retarced as trading conditions became less desirable. As a result, it broke the $0.000090 support, It retraced and slowly edged towards the $0.0000080 barrier of halted its advances at $0.000083.

    It made an attempt at the highlighted marks last week with little success. lAlthough it surge d above it, it faled to gain stability above the mark. Nonetheless, this was the only bullish week for the asset.

    With a focus on the coming month, indicators are not optimistic. One such is the Relative Strength Index. The metric isat 36 and willl continue to sink as trading conditions worsen. Nonetheless, dipping below 30 may mean rebound for the asset.

    One of the key levels the rebound may take place is the $0.000075 support. This may result in a retest of sveral resistance like the $0.000090 and the $0.00010.

  • Top Three Cryptocurrencies to Watch This Week (May 29)

    Top Three Cryptocurrencies to Watch This Week (May 29)

    Most cryptocurrencies’ performance over the last seven days were some of the best over the last three weeks. Although these assets failed to see massive increases, nonetheless, these positive changes were notable and reflected in the global cryptocurrency market cap.

    The sector kicked off Monday with significant bullish sentiment. As a result, it had a modest rise. Before the day’s end, it achieved a high of $1.14 trillion. It started trading at $1.11 trillion. A few days after hitting a low of $1.10T, the industry rose to its weekly high on Sunday, peaking at $1.15T.

    It wasn’t a large increase, but it did show that the crypto market had improved slightly from the previous week.

    We noticed that a new altcoin is gaining traction by looking at the top 100 listings. The asset climbed by about 16% during the course of the preceding seven days, turning major levels and exhibiting a bullish attitude. AGIX is a very recent inclusion given that it only joined the top 100s last week.

    PEPE, on the other hand, suffered the most loss during this time. It lost more than 16% as it kept going down. For optimism, losses of roughly 11% followed.

    With regards to fundamentals, not much happened. Nonetheless, according to China’s local news outlet The Paper, the Beijing Municipal Science and Technology presented a whitepaper on web3 innovation and development on Saturday at the Zhongguancun Forum, praising web3 as an “inevitable trend for future internet industry development.”

    Over the next five days, there are many indicators that suggest extreme volatility. Let’s look at a few potential assets that might enjoy this sentiment.

    Top Three Cryptocurrencies to Watch

    1. Bitcoin (BTC)

    BTC opened at $27,225 but fell back as selling pressure increased. It retested the $27,000 barrier and fell as low as $26,076. Although it bounced back, it finished at $26,325 and lost more than 3% of its worth. It’s important to note that throughout the previous week, this was the only red candle on the chart.

    The biggest cryptocurrency broke the $26,000 barrier the following day. It declined to $25,878 before rising. The asset under examination closed at $26,478 at the end of the session with no appreciable change in value.

    On Sunday, when the bitcoin began at $26,875 and made a try at the $28k resistance, there was the biggest increase of the week. Because it ended just barely above the critical level and hit a peak of $28,248 it was highly successful. In the end, it recorded profits of more than 4%.

    On the weekly scale, the top coin gained almost 5%. This also makes it the first time in three weeks that the asset is closing a seven-day period on a green. Indicators are also bullish to this effect.

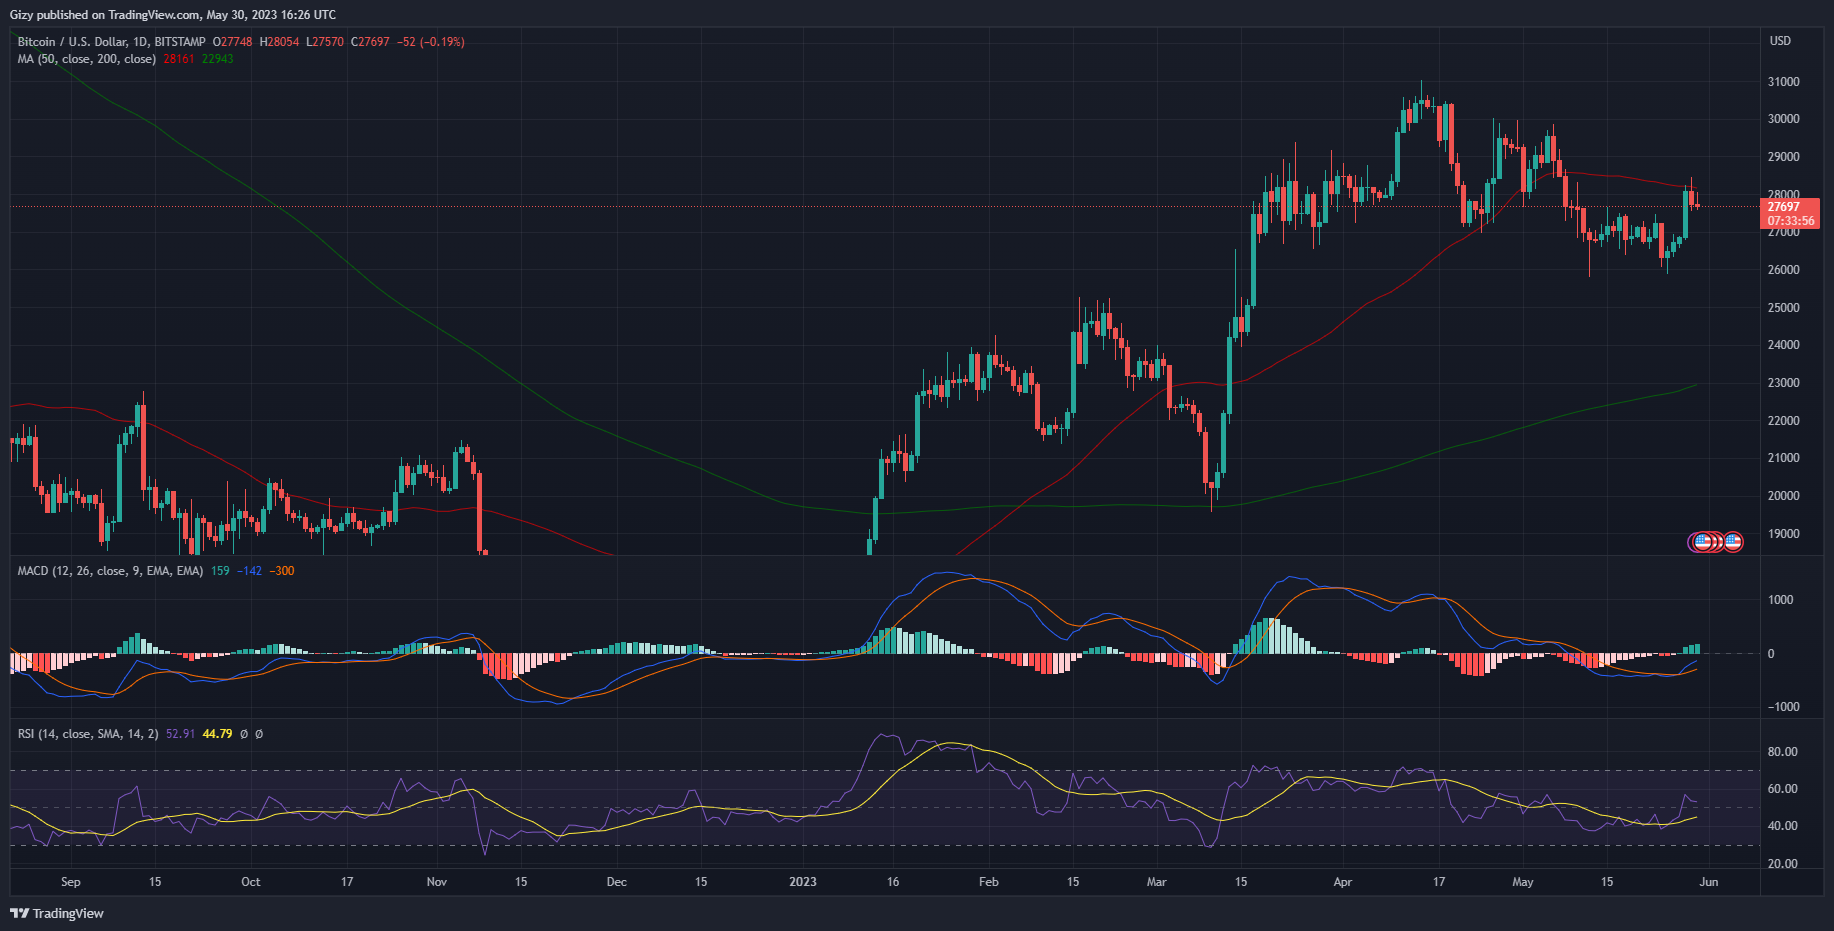
    With this week in mind, BTC is beginning to revert from the gains it made the previous four days. As a result, it reduced volatility. Additionally, this is the situation as of the time of writing.

    Bitcoin has now seen a two-day losing streak. This is also reflected in the Relative Strength Index, which is at 52. But we observed a further rising concentration of demand, offering a transient support near $27,500.

    This emerging barrier is very important as a flip may guarantee a return to the sub-27k. On the other hand, this may also turn out positive as the bulls may build enough demand concentration to attempt $29k

    2. Ethereum (ETH)

    Ethereum also had many interesting highlights from the previous week. A look at the weekly chart suggests the the largest altcoin saw its biggest positive change in almost five weeks as it gained more than 5%. The candle also revealed that the asset sank to its lowest in two weeks.

    This happened on Wednesday. The asset kicked off trading at $1,854 and retraced as selling mounted. During this period, it flipped a key support; the $1,800 barrier. After breaking it, it dipped to a low of $1,777. Although it recovered, it closed with losses of almost 3%.

    Nonetheless, the first two days of the week were bullish and the largest altcoin gained almost the same value it lost.

    It is also worth noting that ETH dipped further on Thursday. It retraced below $1,800 but rebounded at $1,760. It surged above the said mark before the session ran out.

    On the other hand, Ether had its biggest surge on Sunday. It kicked off trading at $1,831 and slowly advanced at $1,900. The largest altcoin peaked at $1,920 before retracing to a close at $1,909. This is an indication that the asset gained more than 4%.

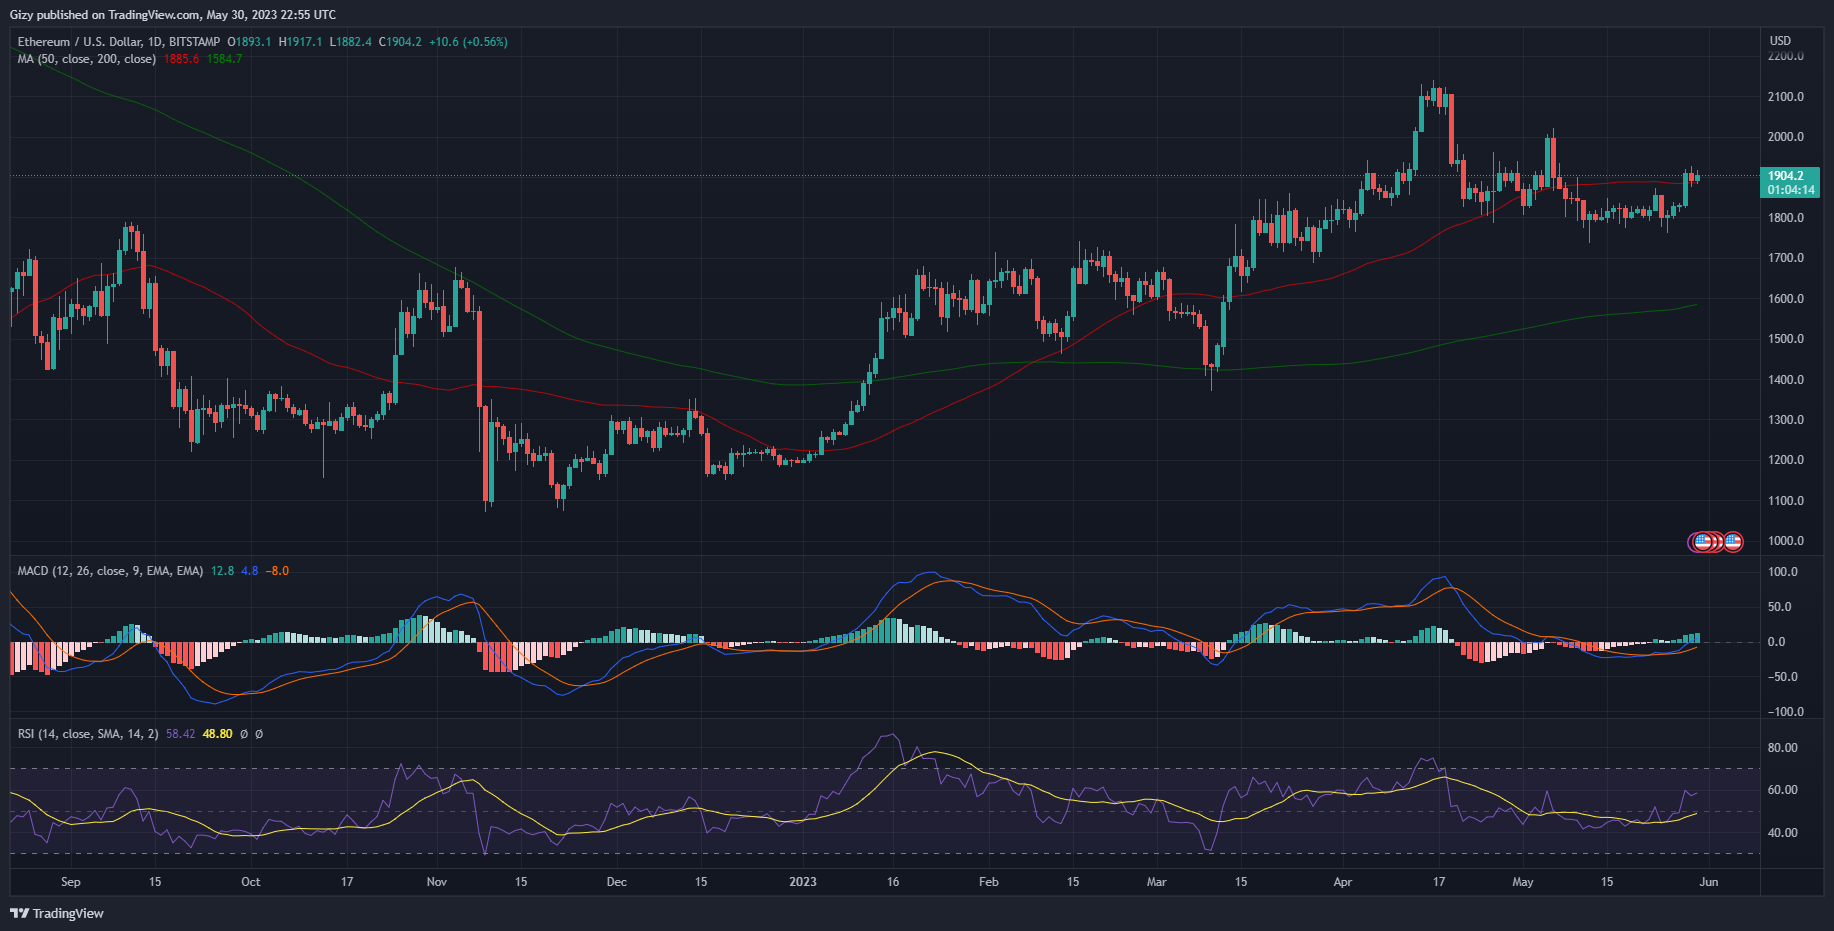
    Sunday’s price performance was one that many expected would spill over into the current week. However, this is not the case as the crypto under consideration is struggling to hold key levels. A clear indication of this was when it lost $1.9k during the previous intraday session.

    Ether is still grappling with the effect of strong battle for dominance. Based on price movement, ETH may retrace to a low of $1,800 as this was the trend two weeks ago. Nonetheless, strong fundamentals may send the asset as high as $2k

    3. Quant (QNT)

    Quant price movement is one that made many believe it’s altseason. It rebounded from the downtrend that plagued it for weeks.

    The main event happened on Friday as it retraced to its lowest in more than three months. It flipped the $100 support and hit a low of $96. The recovery sparked a price rally that saw the cryptocurrency gain more than 8% in three days.

    The altcoin is also enjoying a spillover of this sentiment. During the previous intraday session, QNT gained more than 5%. During the current session, it is up by almost 4%. However, indicators are blaring warnings.

    For example, the Relative Strength Index is fast-approaching 70 which means the coin may be oversold if the increase continues. A massive is imminent.

  • Top Three Cryptocurrencies to Watch This Week (May 22)

    Top Three Cryptocurrencies to Watch This Week (May 22)

    The cryptocurrencies to watch this week were some of the most stable during the previous week. A closer at their weekly performance revealed that they saw little volatility. This mirrored the trend of major crypto assets.

    The market capitalization of all cryptocurrencies was $1.12 trillion at the beginning of the previous week. Prior to two weeks ago, the market underwent a slow decline in value that caused it to briefly fall below $1.1T but end up closing above.

    The sector’s failure to post gains and keep onto them continued during the previous intraweek session. As a result, it reached its peak of $1.15 trillion before declining to a low of $1.10 trillion and closing at nearly its opening price. The chart revealed that price movements were characterized by highs and lows.

    The leading gainers at the moment were altcoins. This included RNDR. Over the past seven days, the asset has increased by more than 40%.

    One of the key levels that it flipped during its climb was the $2.5 resistance. We saw multiple attempts at the mark over the time frame under consideration before it gave way on Sunday.

    PEPE was among the largest losers during the past week. Despite the fact that its losses were not substantial, it lost more than 4%. Its position has decreased to 68 as a result of a decline in the market capitalization of all cryptocurrencies.

    Because they didn’t have much of an impact on pricing, market fundamentals were basically nonexistent.

    As the week’s second day begins, nothing has changed. However, the charts provide information about potential price behavior.

    Top Three Cryptocurrencies to Watch

    1. Bitcoin (BTC)

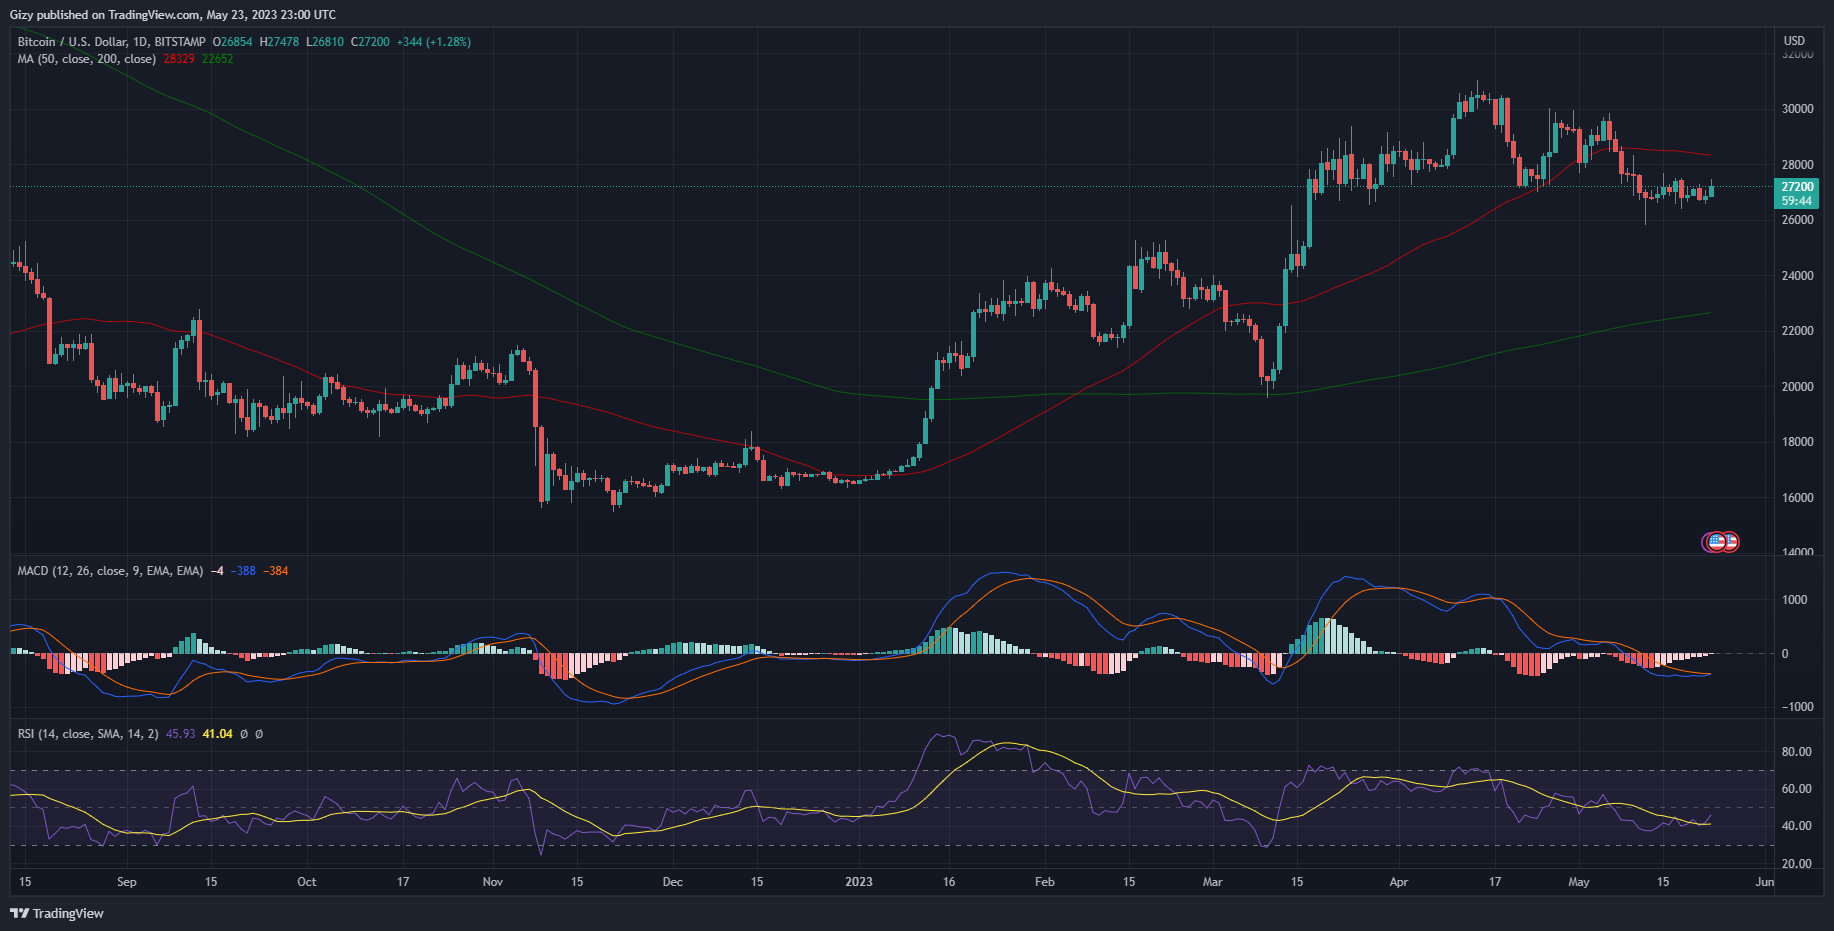
    The previous week, the price of bitcoin was comparatively constant. It was unable to leave the trading channel it was in. when a result, its worth barely changed when it closed. We noticed a doji on the weekly chart, which shows that the asset peaked before dropping to a low.

    One of the key moments on Tuesday was when it began at $26,933 and rose as high as $27,666. Despite the fact that there was no discernible price gain for the top asset at the end of the intraday session, this gave many people hope that future price increases were inevitable because Monday was also a good day.

    This never happened, as BTC experienced its greatest loss on Thursday. Trading started at $27,413 and dropped to $26,374 before rising once more. Despite recovering, it ended up losing roughly 3%. Nevertheless, the top currency hit a new low for the week.

    Over the course of the next three days, the coin’s price barely altered. However, many people would perceive the little greens on the chart as a sign of impending price improvement.

    Examining the indications further demonstrates this point.

    Although the measurements have not changed significantly, they have gradually become bullish. For example, MACD shows that BTC is going through a bullish convergence. The Relative Strength Index also stayed the same at 40.

    A better price performance for the current intraweek session is predicted by indicators. For instance, the 12-day and 26-day EMAs have been deviated, according to the Moving Average Convergence Divergence. When a bullish divergence is going to take place, prices may react favorably.

    The $28k resistance is one of the important levels to keep an eye on over the next five days. While getting closer to the target, the apex coin was unable to retest it. Due to the most recent prospects, it might try the specified level.

    2. Ethereum (ETH)

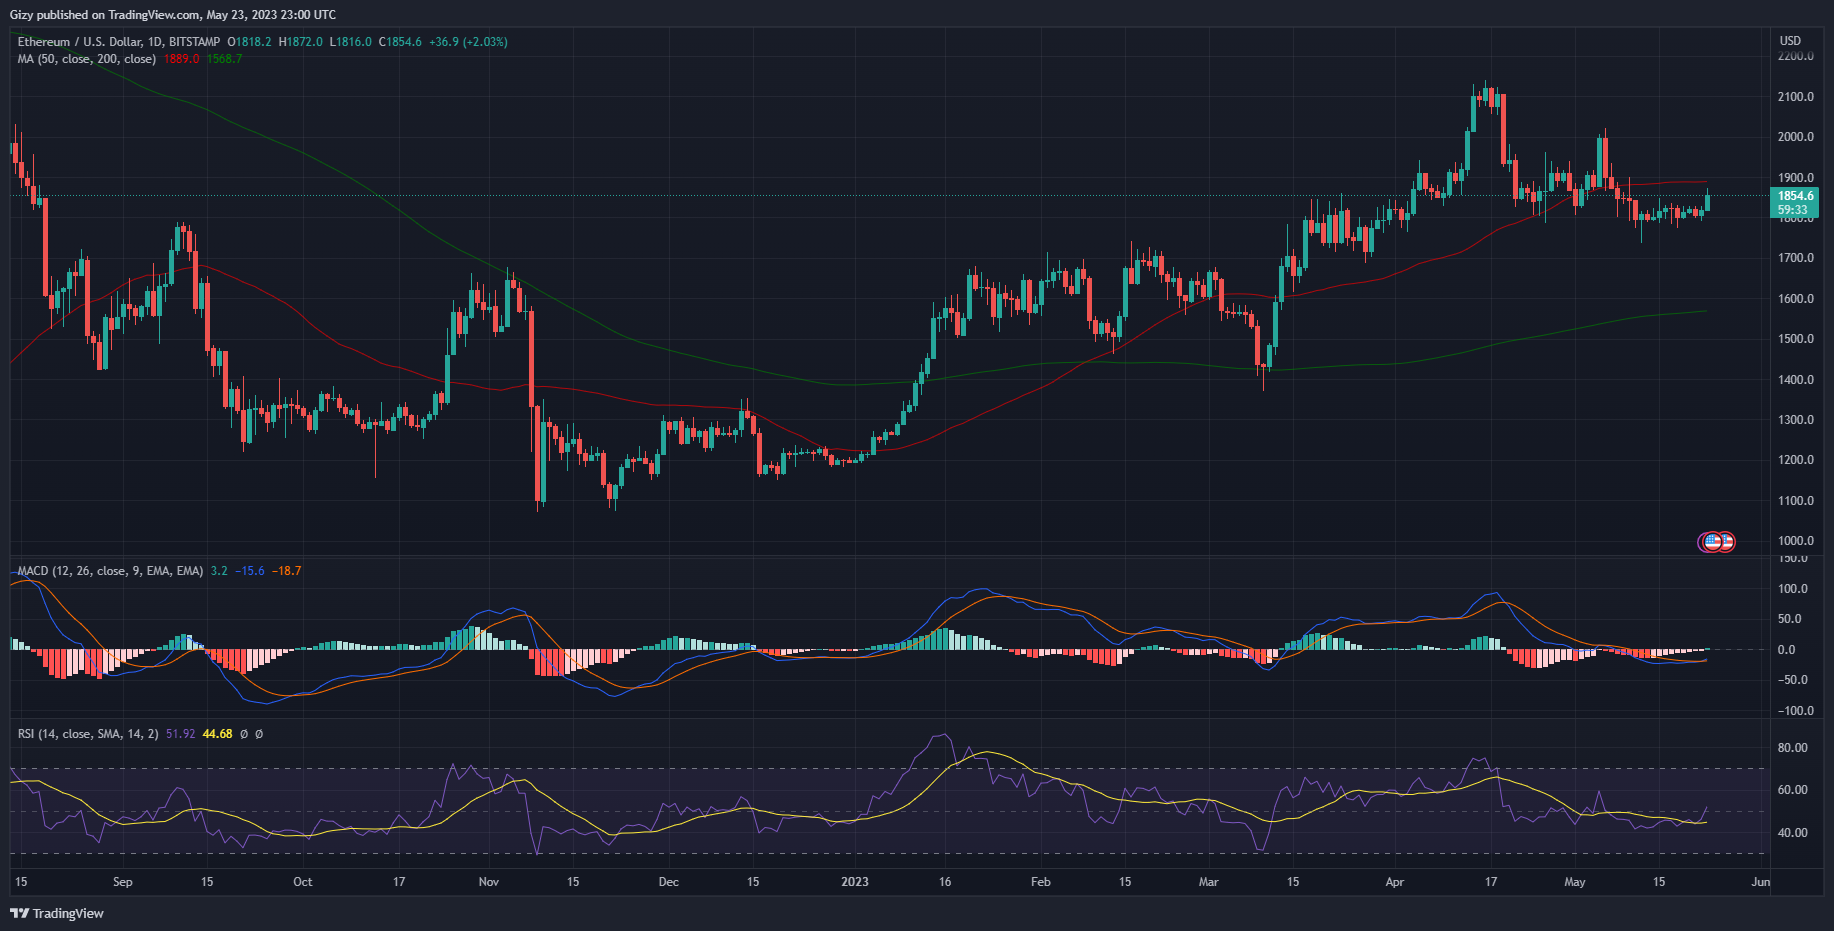
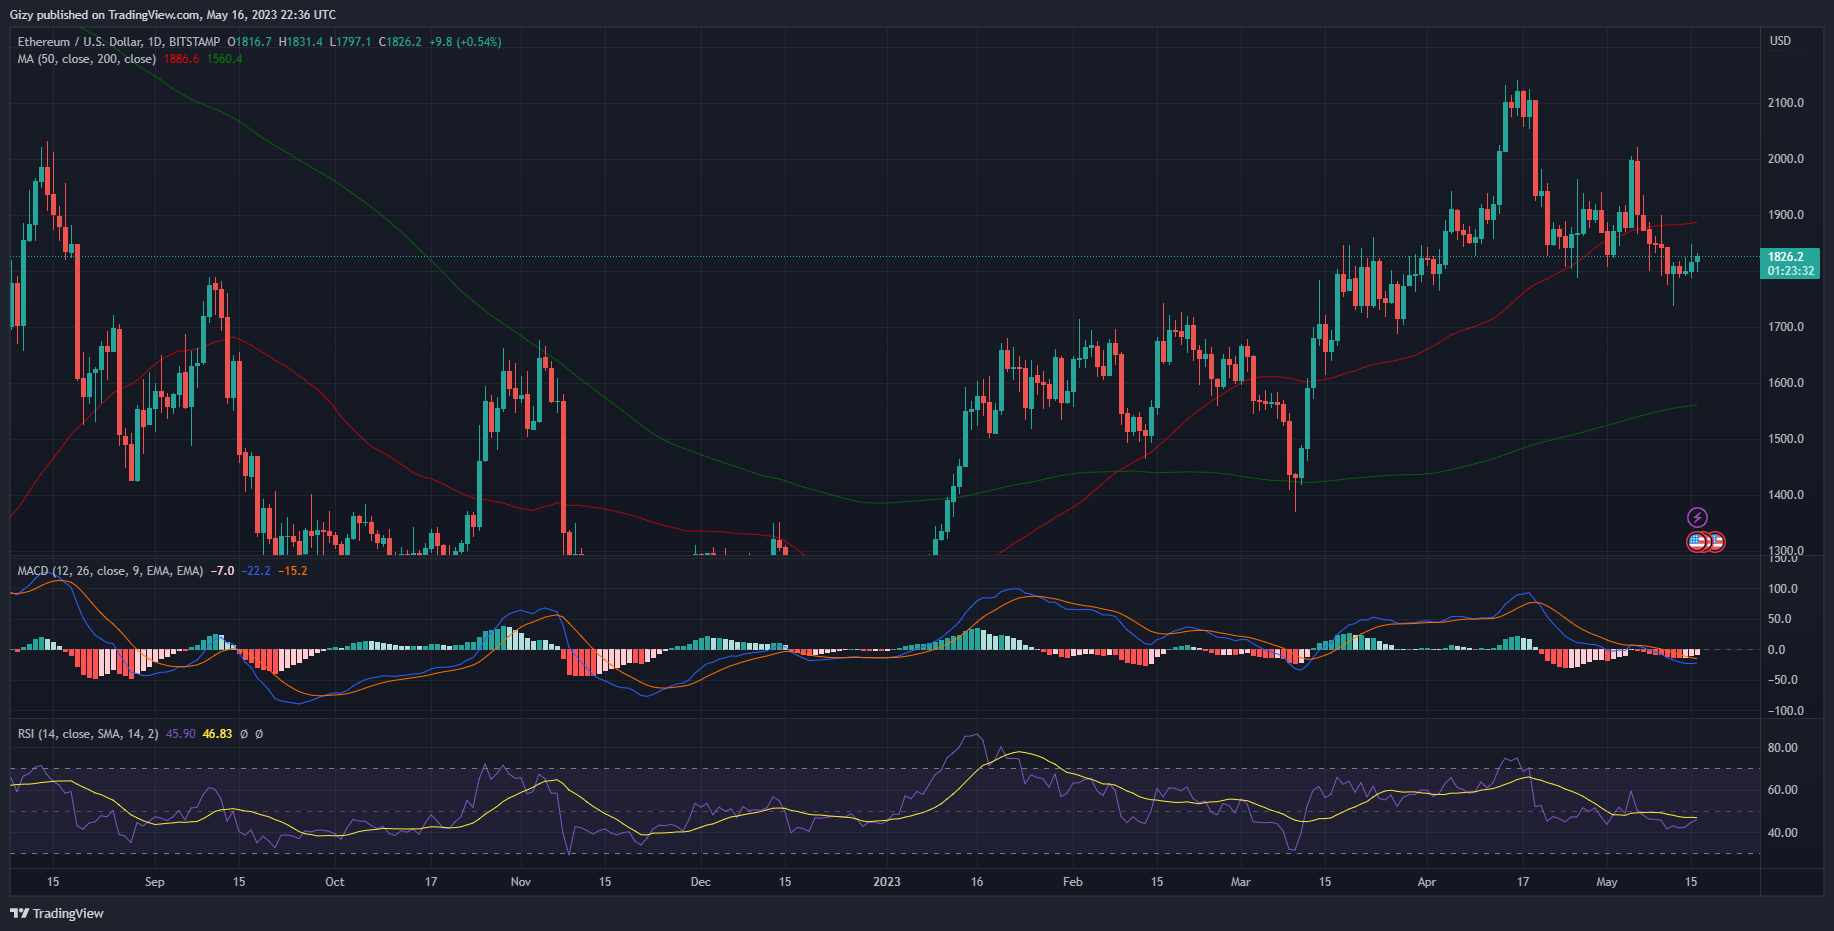
    Ethereum had the same movement the previously highlighted asset. Like most cryptocurrencies to watch this week, it had very little volatility during the previous week. As a result, trading activity during that period was represented by a doji. This is also an indication that it retested key levels.

    The first highlight of the week was on Monday. The altcoin kicked off trading at $1,800 and slowly edged toward $1,900. However, it halted the advance at $1,847 but registered gains of more than 2% in the end.

    On Thursday, a complete reverse of what took place. ETH had its biggest dip as it kicked off trading at $1,822 but flipped a key level as the day progressed. It flipped the $1,800 support and dropped to a low of $1,777. It recovered but closed at the highlighted mark which signified a less than 2% decrease.

    Over the last two days of the week, the largest altcoin was relatively bullish as it registered two green candles. It also affected indicators such as the Moving Average Convergence Divergence is showing huge positive signs. it displayed a bullish convergence which may also spell out more price improvements for the asset.

    The previous intraday session is an indication of the statement above. Although not significant, it was a green. The current 24-hour cycle is also positive as ETH is up by almost 2%. Nonetheless, it peaked at $1,872 and is retracing as a result MACD is showing signs of further price increases.

    It displayed a bullish divergence. Following this reading, ETH may see further attempts at $1,900.


  • Top Three Cryptocurrencies to Watch This Week (May 15)

    Top Three Cryptocurrencies to Watch This Week (May 15)

    During the previous week, most cryptocurrencies saw notable decreases. A closer look at the global cryptocurrency market cap paints a clearer picture of what transpired.

    At the start of the previous seven-day session, the global cryptocurrency market cap was $1.18 trillion. It dropped to a low of $1.09 T before increasing and finishing at $1.12, showing no significant increases or decreases. As a result of frequent declines in the value of major cryptocurrencies, the sector gradually shrunk.

    Some of the top losers are BSV and KLAY. Both cryptocurrencies lost more than 14% of their value as selling pressure mounts. On the other hand, some of the top gainers are CFX and LDO as both experienced increases of more than 19% during this period.

    During the previous week, there were no significant fundamentals during the previous intraweek session. This is also the same situation at the time of writing. Nonetheless, some assets are showing huge potential.

    Top Cryptocurrencies to Watch

    1. Bitcoin (BTC)

    The largest cryptocurrency by market cap had a lot of ups and downs over the last seven days. In the end, the BTC lost more than 5%. Let’s go over some of the highlights.

    Last week, Bitcoin dropped from its opening price of $28,667 and flipped $28,000. Before climbing to $27,690, it reached a low of $27,290. After breaking this key barrier, the top coin suffered losses of around 3%.

    On Wednesday, BTC went above $28k but failed to gain stability and retraced. It dipped as low as $26,842 but rebounded and closed at it opening price.

    We also noticed a similar move the next day. The apex coin started trading at $27,624 and was met with notable selling pressure. As a result, it dipped to a low of $26,720. However, this time, it failed to return to the said mark and registered losses of almost 3%.

    The downtrend got worse on Friday as bitcoin sank further. It broke a new barrier: the $26k support, dropping to a low of $25,800. However, it bounced back and ended at $26,811 without seeing any significant gains or losses.

    Indicators at the time were negative. For instance, the Moving Average Convergence Divergence closed below 0. The Relative Strength Index is another unfavorable metric. It started the week at 48 and finished at 40.

    With a focus on the new intraweek session, there is almost no difference in market sentiment. However, indicators bear some good news. First, the 12-day MACD EMA is beginning to reverse its negative trend. A closer look reveals that the metric is almost straight and might curve upward if trade conditions improve.

    We might consider what happened during the previous intraday session in light of this. Bitcoin reached a high of $27,666 after starting at around $27,000. This was the first attempt at a bullish move of the week.

    This could just be the first of many, as the asset might retest $28,000 in the upcoming five days.

    However, BTC is holding on to a very thin wall. This may herald further downward trends and an additional effort to retain the $26k support.

    2. Ethereum (ETH)

    The largest alternative cryptocurrency made many gains and ended the day at its starting price from two weeks ago. Then the event was symbolized by a doji.

    Contrary to the previous intraweek session, the asset closed with a notable fall in value. It suffered losses of more than 3%. Let’s go over the main events that occurred during this time.

    It began slowly because there were no major price changes on Monday. But it made an attempt at a crucial level, much like other cryptocurrencies that were being watched. During the retracement, ETH hit a low of $1,800 but bounced back to close at $1,849.

    It rose to its highest level of the week on Wednesday when it retested the $1,900 resistance. The price retraced below $1,800 for the first time in more than seven days and failed to break through.

    Similar to Monday’s outcome, the second-largest cryptocurrency recovered and finished the day at its opening price.

    It went over that line the next day and had losses of roughly 3%. Additionally, during the intraday session, it ended below $1,800. On Friday, the cost of ether dropped even more, hitting a low of $1,737 before rebounding and finishing at $1,808.

    Additionally unfavorable were the indicators. Both the RSI and MACD dropped below 50.

    They are, nonetheless, optimistic at this time. For instance, the 12-day is no longer retracing. It hit a wall and is now displaying indicators of a coming bullish convergence. The tiny increases the altcoin is experiencing are also having an effect on RSI. At the time of writing, the metric stands at 45.

    We now turn to price changes in light of all these indicators. Ethereum is currently experiencing its second day of straight gains. This, while a minor shift, is what alters the trajectory of the indicators. This can also be a sign of additional upward tendencies.

    The $1,900 resistance is one level to keep an eye on. If trade conditions stay the same, the largest alt may try to hit the mark. It’s also important to note how close the $1,800 support is.

  • Top Three Cryptocurrencies to Watch This Week (May 8)

    Top Three Cryptocurrencies to Watch This Week (May 8)

    Most cryptocurrencies struggled throughout the previous week. They failed to hold to key levels and as a result, did not register any significant positive change in value.

    The situation affects the entire sector, as can be shown by looking at the market capitalization of all cryptocurrencies, which has seen a little decline in value.

    The market began at $1.18 trillion and reached a high of $1.23 trillion. It lost steam, though, and fell to a low of $1.13 T. It also ended at this level, showing the bearish sentiment prevailed during this period.

    Regarding the fundamentals, a lot of news circulated but had no effect on pricing. For instance, despite the unfavorable year for the cryptocurrency market, Jack Dorsey’s Cash app claimed $2.16 billion in Bitcoin sales during this time.

    In a financial report, Coinbase disclosed profits of 23% from quarter to quarter. The exchange made $736 million in the first quarter of the year, beating analyst projections of $658 million.

    With the new week in view, there are no strong fundamentals. With this in mind, we will example the chart to get an outlook of how some assets may perform.

    Top Three Cryptocurrencies to Watch

    1. Bitcoin (BTC)

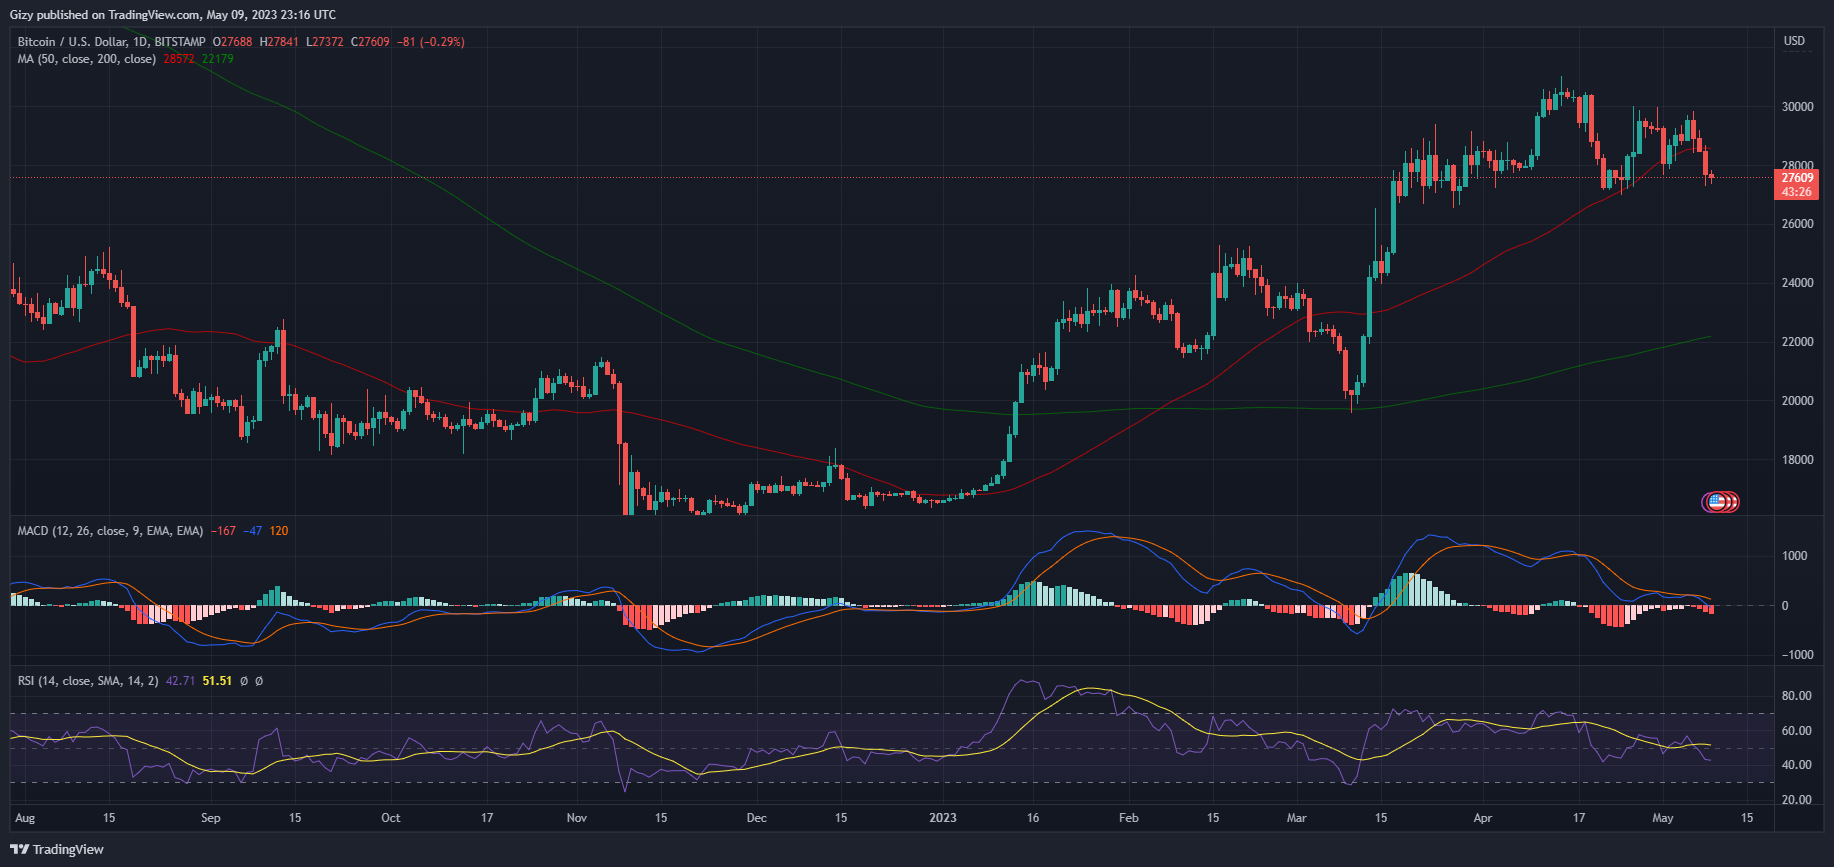
    A look at the previous week’s candle shows longer wicks to the top and bottom. This is as a result of bitcoin testing key resistance and afterward, support.

    On Monday, BTC started out at $29,254 and briefly exhibited hints of a rise before stopping. It then reversed and flipped the $28,000 resistance. It fell to a low of $27,666. BTC lost over 4% of its value by the session’s conclusion.

    The asset began trading at $28,860 and reached a high of $29,701 on Friday. The peak dashed any hopes of seeing the cryptocurrency flip $30k. That was the final attempt during the previous seven days, and we also failed to flip the mark. Nevertheless, it gained roughly 3% at the closing.

    The apex coin went into a downtrend during the following two days. Over this time, BTC declined by more than 4%.

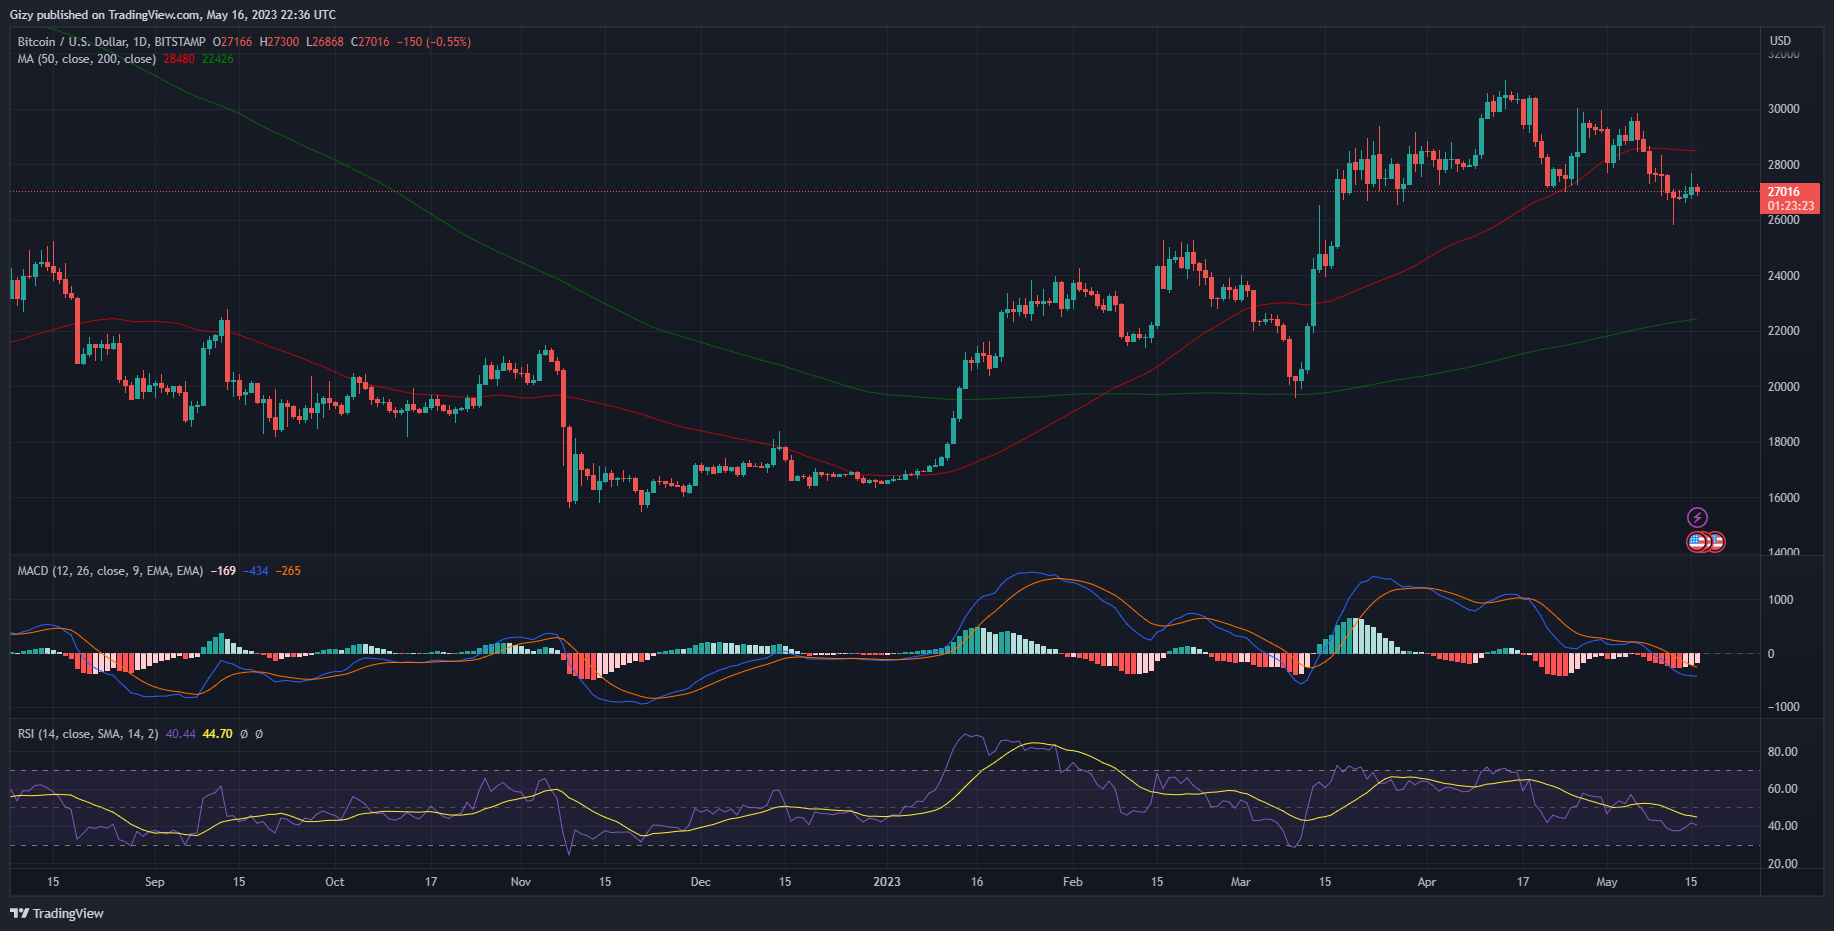
    The apex coin broke the short-term support at $28,40 during the previous intraday session, as demand concentration dipped. The value of the cryptocurrency dropped by roughly 3%, reaching a low of $27,290. The coin is currently holding onto $27,500 and trading at $27,582.

    BTC has established a short-term support at $27,300 over the previous 40 hours. After testing it twice this week, a breakthrough might be anticipated. It could be upward or downward.

    One of the key levels to watch is the $27,000 support. We may see an attempt at the mark in the coming days. To the top,  we expect bitcoin to edge closer to $30k.

    2. Bitcoin SV (BSV)

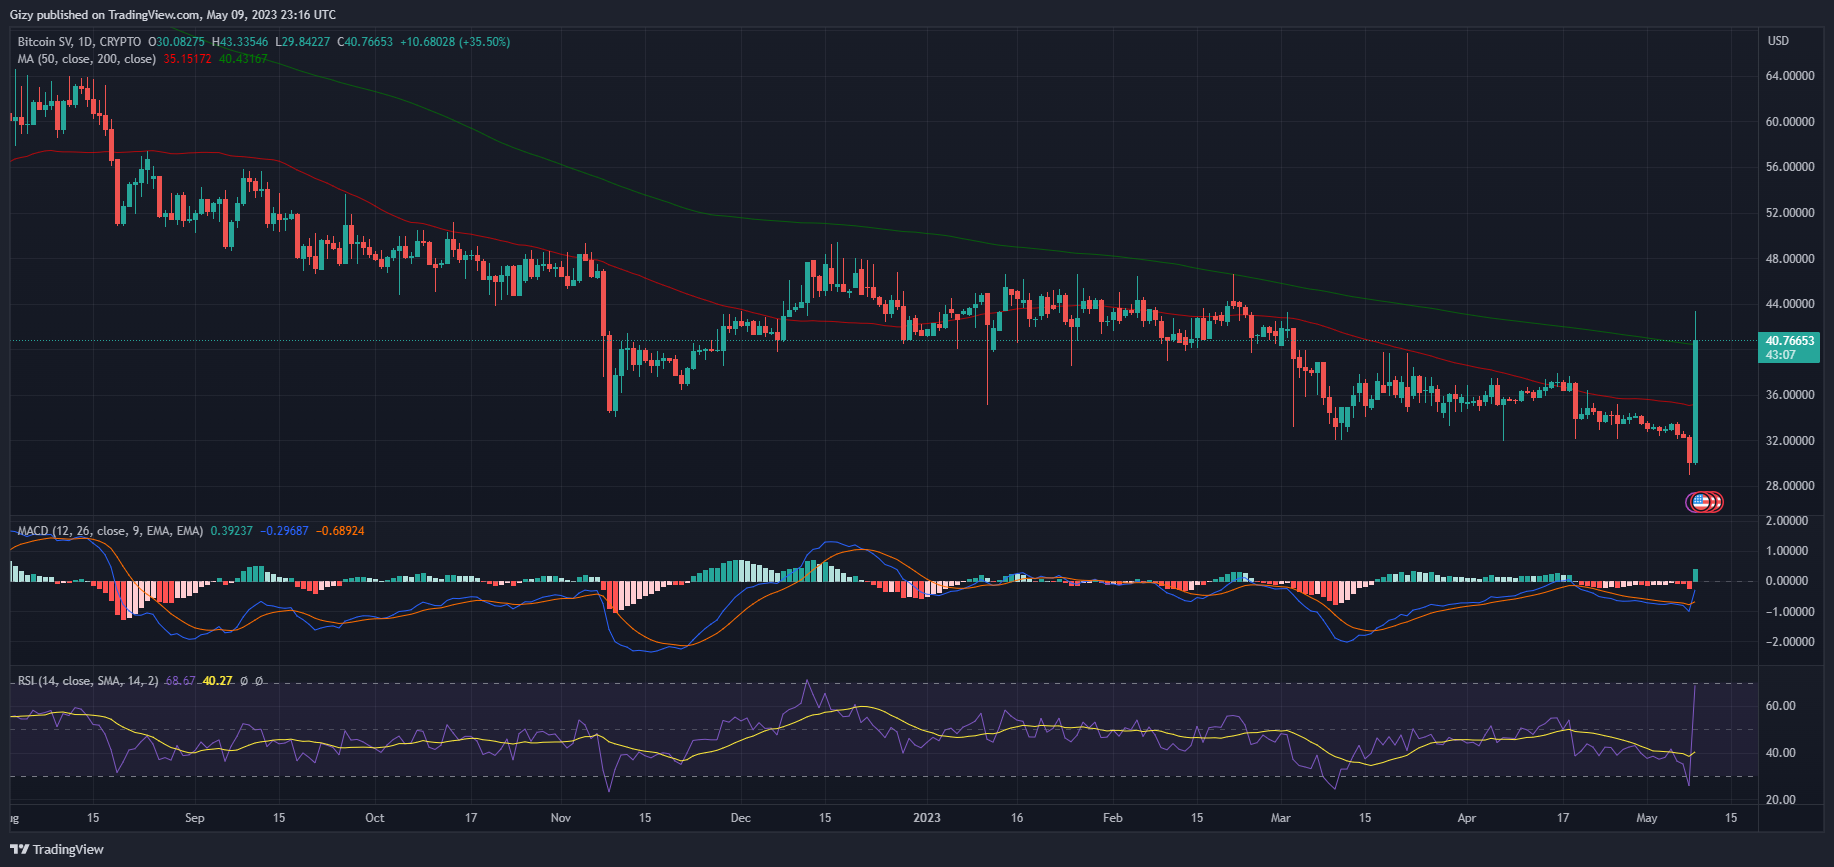
    Bitcoin price over the last 23% hour is one that left many astonished. It erased all of the losses it incurred during the previous week. It is worth noting the asset saw minimal movement during this period.

    The week’s high point occurred on Saturday. It began trading at $33.3 and fell as low as $32. It thus finished the session down over 3%.

    Looking at the indications at the time revealed that the purchasing pressure on BSV was gradually waning. The Relative Strength Index makes this clear. It was at 35, indicating that the asset is progressively losing value and might fall below 30 if the downturn keeps on.

    During the previous intraday session, this took place. One of the largest dumps of the token occurred. It flipped multiple supports when it first started trading at $32.3. The $32 barrier was broken, then the $30 barrier. It subsequently fell to a low of $28.9. But it recovered and fell more than 6% to close at $30.

    BSV was oversold as a result of this large decline. RSI dipped to a low of 25.

    Bitcoin SV kicked off trading at $30. During the current intraday session, the asset flipped the $38 resistance and retested the $42 barrier with the same result. It headed to $44 which failed to yield as it faced strong rejection at $43.3. Nonetheless, at the time of writing, the coin is up by more than 41%.

    Due to the massive surge, the altcoin is overbought as RSI is above 70. As per RSI rules, BSV may experience a series of downtrends.

    On the other hand, we noticed that the Moving Average Convergence Divergence is displaying a bullish divergence. With this reading in mind, we may expect the altcoin to flip $44 and attempt $46.

  • Top Three Cryptocurrencies to Watch This Week (April 30)

    Top Three Cryptocurrencies to Watch This Week (April 30)

    Most cryptocurrencies were on a recovery path over the last seven days. These assets saw a notable change in value and are gradually moving toward other key levels.

    A look at the global cryptocurrency market cap chart reveals that the week is filled with a lot of volatility. It kicked off at $1.15 trillion and surged to a high of $1.23 trillion on Wednesday. However, it retraced from it high and dipped below $1.15 T. Nonetheless, it is currently trading at $1.18 trillion which indicates that the sector failed to register any notable change.

    A look at the top gainers revealed that a lot of cryptocurrencies are seeing a notable positive change in values. One such is Render. The token opened the previous current intraweek session at $1.70 and edged to retest $2.80 but failed. It peaked at $2.64 as it faced strong rejection. Nonetheless, it may end the period under consideration with gains exceeding 39%.

    Although Injective protocol is currently worth $7.74. A look at the weekly chart suggests it had a volatility-filled session. It kicked off at $6.88 and peaked at $9.29 as is latest attempt at the $10 resistance failed. After failing to retest the key level, it retraced and lost more than half its accumulated gains. As a result, it is up by more than 12%.

    With a focus on the new week, there are several cryptocurrencies to watch this week. Let’s go over them

    Top Three Cryptocurrencies to Watch

    1. Bitcoin (BTC)

    2. Internet Computer (ICP)

    The asset began trading at $6 during the previous session and moved steadily toward $7. It attempted to retest the $7 resistance but was unsuccessful since it encountered heavy opposition at $6.82. It retraced as a result and is currently trading at $6.57; it may close at this price.

    It is important to note that the rise began on Thursday when trading began at $5.32. It jumped to a session high of $5.80 but ended little lower. It did, however, show gains of more than 7%.

    The preceding intraday session revealed further attempts at crucial levels. This time, the $6 resistance was reversed. Additionally, it became significantly more stable above it, closing at $6.

    As seen by another green candle, the upward trend is still in effect. We noticed that the internet computer was primarily bullish until its most recent attempt toward $7 at 16:00 UTC when we broke it down into the 2-hour chart. Additionally, it shows that the buying pressure has significantly decreased.

    Like most cryptocurrencies to watch, several indicators are pointing to more increases. Although the coin is down by a small fraction, this did not affect the essential metrics. For example, MACD showed that the altcoin had a bullish divergence on Friday.

    We saw an attempt at the $7 resistance. With this in mind, based on previous price movements, we may conclude that Internet computer may experience notable improvements in price in the coming day. This may also guarantee a flip of the $7 barrier.

    A prime example of such a scenario was a few weeks ago when ICP went on a bullish binge from April 9 to April 18. Before it reversed, it was rising steadily for more than nine days. During this period, it increased by more than 38%. Following that, it reversed by over 10% during the following intraday session. However, it traded for $7 prior to this sharp decline in value.

    3. Casper (CSPR)

    CSPR started trading at $0.054 during the previous intraday session and soared to a high of $0.058. It closed at its top, which represents an increase of more than 7%. The token successfully overcame the $0.055 resistance, making this the most successful of its prior three efforts.

    It became more stable above the mark this time. We also saw that the peak, which delineated the boundaries of its $0.058 and $0.050 channels, was a formidable obstacle.

    The resistance was breached during the current intraday session, so things are different. Additionally, CSPR is approaching a new critical point. Despite slowly increasing to $0.065, it hasn’t been able to flip.

    The wall it encountered caused it to peak at $0.063 and stop moving forward. However, it is important to remember that the surge began after it hit support at $0.057. At the time of writing, it had also increased by more than 6%.

    There is a lot of speculation as a result of the most recent surge the coin is seeing. One of them is how it will function during the next few days.

    The indicators are very positive at this time. For example, the Moving Average  Convergence Divergence showed the coin saw a positive divergence on Thursday. The subsequent price movement reveals what that incident signifies. The fact that the measure is still rising supports the first claim, thus it is important to note.

    Calls for massive increases is also supported by the Moving Averages. For instance, we saw that the 50-day MA has an upward arc. The opposite activity is shown on its counterpart.

    Due to the Relative Strength Index’s current readings of above 70, we might anticipate a slight decline in buying volume on the downside. Within the next 24 hours, a minor downtrend may be anticipated according to RSI rules.

  • April’s Crypto Top Gainers: Will the Surge Continue?

    April’s Crypto Top Gainers: Will the Surge Continue?

    April started on what many describe as a “wrong foot” as most cryptocurrencies lost considerable fraction of their value during the first two days. This also reflected on the global cryptocurrency market cap as we noticed a slight drop in value.

    It kicked off at $1.18 trillion and dipped to a low of $1.15 T. Following this small drop, most cryptocurrencies recovered as the sector under consideration peaked at $1.28 trillion. This signified a more than 5% increase form its low. However, the industry’s worth is downhill at the time of writing as it is currently worth $1.20 trillion.

    This price movement may appear meager until we delve dip into the top gainers over the last 30 days. Nonetheless, many considered the fourth month of the year one of the most profitable for some assets. Given how they perform, many are looking forward to seeing how they may react over the next 30 days

    Crypto Top Gainers

    1. Bitcoin (BTC)

    Like most cryptocurrencies, Bitcoin had a bad start to April. It opened at $28,476 and failed to surge. The next three days were marked with red candles. A closer look at the chart showed that top asset failed to record any significant gains during the first seven days.

    During this period, it traded between $28,700 and $27,700 channels. It broke out on the tenth day of the month. It opened at $28,353 and slowly edged toward the $30k resistance. However, it failed in this bid as it peaked at $29,789 and closed with gains of almost 5%.

    The mark fell during the next intraday session as BTC flipped $30k. This was the first time the top coin is breaking this barrier since September. It also edged closer to $31k but halted at $30,500.

    It is worth noting that bitcoin hit a high of $31,000 before a series of downtrends. As a result, the largest cryptocurrency dipped to a low of $26,981. Following this massive drop, we noticed bitcoin tested $30k on two occasions.

    It failed on both trials but edged very close to the mark. During the most recent attempt, it hit a high of $29,887 and closed with gains of almost 4%.

    In the end, the top asset may end the month with a positive change of more than 3%.

    While this may not be what many expected, indicators are positive. Since its previous interception on April 18, the Moving Average Convergence was on a downtrend with both EMAs sinking below 0.

    In reaction to this, prices also dipped. The coin lost more than 11% from when it the bearish divergence took place to its lowest value. This also corresponds with the Relative Strength Index as it dipped to a low of 41.

    2. Ethereum (ETH)

    There were a lot of highlights from the last 29 days. Nonetheless, it was a mix of both bullish and bearish moments.

    It is no news that the month under consideration started a bit bad for the asset. Nonetheless, Ether quickly recovered and started a surge on the third day. It gained more than 3% on the fourth day and we saw further attempts at a key resistance.

    On April 5, it flipped $1,900. This comes as no surprise since Ethereum recently flipped this mark. It experienced a three-day downtrend shortly after that before recovering.

    However, that movement highlights yet another significant barrier to ETH’s bid for $2k. The top alt retraced during the prior try at $1,942. At $1,938, it ran into a solid wall this time. This suggests that demand concentration will decline between $1,940 and $1,950.

    After breaking this mark, many look forward to an attempt at the $2k resistance. However, at the time most indicators were bearish and the Moving Average Convergence Divergence is one example.

    Metric readings indicate an upcoming negative divergence that could mark the beginning of a bearish round. However, RSI continues to be below 70 which indicated a possible attempt at the highlighted level.

    After breaking this mark, it attempted the $2,100 resistance. Less than 24 hours, after surging above $2k, it flipped the said mark. We noticed several trials for the coin to gain stability above it. However, they all failed and dipped by more than 8% on April 19.

    This was the start of a downtrend that saw ETH dip and lose almost all of its accumulated gains. As a result, the largest altcoin may close with gains of less than 3%. A bitter-sweet session, many may conclude.


  • Is It Altseason? Top Five Altcoin to Watch

    Is It Altseason? Top Five Altcoin to Watch

    Altseason is one of the most exciting times for the crypto market. There are indications that this period may be upon us this quarter. In this article, we will examine the following;

    Is it Altseason and Altseason Indicator?

    Top Five Altcoin to Watch

    Is it Altseason?

    It is worth noting that the crypto community is divided when it comes to this topic. Many speculated a few days ago when some altcoins saw notable increases after Bitcoin slowed that it is altseason already. Others are of the opinion that those price actions were normal.

    One reason for the many speculations that its that period is that recent events ticked every box in the altseason indicator.

    Current Altseason Indicator?

    For example, one occurrence that preceded the claims was BTC breaking several barriers. One such was the $30k resistance. After this significant surge, the apex coin had a period of reduced volatility and alternative crypto assets like ETH and SOL went on flipping key negative barriers.

    A few days ago, the largest altcoin broke the $2k resistance. This is the first time in more than six months that the asset is attempting this level. After breaking $1,900 some days before, many anticipated the last milestone.

    Solana also made a huge statement reclaiming several levels it failed to hold during the previous month. It reclaimed the $24 resistance and surged as high as $26. This marked a more than 200% increase from its December low.

    Unfortunately, both major assets are slowing down and struggling to hold on to the various levels. This trait defeats the trait of the altseason as it last months before coming to an end and not a few days. So the

    This is also an indication that it is upcoming. Let’s go over some altcoins to watch during this period.

    Top Five Altcoins to Watch

    1. Ethereum (ETH)

    Ethereum saw massive increases during the previous intraweek session. As a result, it broke key levels.

    It opened the previous seven-day period at $1858. Showing huge signs of an uptrend, it flipped  $1,900 on Monday but had a little decrease the next day.

    The main highlights of the week were on Thursday and Friday. On the fourth day of the week, it opened at $1,919 and surged to a high of $2,024, breaking the $2k barrier for the first time since August 2023. It closed that session with gains of almost 5%.

    During the next 24-hour period, it continued its uptrend and flipped $2,100 for the first time. It also gained more than 4% during this intraday session. On the weekly scale, the top alt closed with an increase of almost 15%.

    Indicators like the Moving Average Convergence Divergence and RSI shed more light on future price movements.

    MACD trend at this time is bullish as ether had a bullish divergence last week. This may indicate more price increases. However, RSI is at 67 which may result in ETH becoming oversold in the event of a massive price increase.

    In the coming days, we may expect more bullish action. Supporting this claim is the Ethereum Futures.

    It is worth noting that the altcoin has no CME gaps below and only one at the top. This gap is at $2,560 and extends to $2,600. With this in mind, we may conclude that during the next altseason a key level that may flip is the $2,600 resistance.

    This will also mark more than 25% of the current price. With regard to support, we may bank on long-term levels like the $1,700.

    2. Solana (SOL)

    Solana also had a splendid performance two weeks ago. As a result, many asked “Is it altseason already?”

    During this period, the coin flipped several resistance, attaining different milestones. A look at the chart shows that SOL had a very good start as it gained more than 3%.

    This was meager compared to what happened the next day. It opened at $20.9 and was en route $24 before hitting a wall at $23.7, halting its advances. However, this was one of its biggest increases in more than three months as the asset under consideration closed with a 10% increase.

    The surge continued as it flipped $24 and $25 during the next two intraday sessions. All these positive changes had a huge impact on the coin’s weekly performance as it ended the seven-day period with gains of more than 24%. This was also the longest candle since January 2023.

    However, trading action during the previous week saw the asset lose almost all of its gains. It lost more than 15% which gradually reduced the clamor for altseason.

    SOL is back to the “winning ways” as it is up by more than 8%. Although half of what it lost, there are indications the increases may continue.

    One such is the Moving Average Convergence Divergence. Over the last two days, we noticed it stopped its downtrend, gradually edging to a bullish convergence. A look at the 12-day EMA shows that it is almost in contact with the 26-day EMA. With a divergence imminent we may expect more increases.

    One level that served as a strong barrier to the previous downtrend was the $21 support. In the coming days,  we may expect an attempt at the $26 resistance. There are also indications of flipping $50 once the uptrend is in full swing.


  • Top Three Cryptocurrencies to Watch This Week (April 17)

    Top Three Cryptocurrencies to Watch This Week (April 17)

    Although most cryptocurrencies had a splendid performance during the previous week, the present is looking a bit grim. However, it is worth noting that we observed significant increases in the prices of major crypto assets, which also showed up in global cryptocurrency market capitalization.

    The industry began the previous seven-day session at $1.18 trillion. Significant gains were made on Monday, although they only occurred as the week’s end approached. The industry reached its high of $1.287 T during this time. Unfortunately, it experienced a slight downturn and closed at $1.28 T, representing a rise of less than 5%.

    Nevertheless, some crypto assets helped to support the increases. CSPR, which gained more than 36% during the preceding intraweek session, was one among the top gainers at the time. Other alternatives followed with rises between 20% and 30%.

  • Bubbling Beneath top 100: Top Five Cryptocurrencies to Watch

    Bubbling Beneath top 100: Top Five Cryptocurrencies to Watch

    Cryptocurrencies gain more popularity when their projects are exceptional. Some crypto assets gain massive increases in trading volume and claim a place in the top 100. These assets pique the interest of most investors as they are at the forefront of the market.

    The global cryptocurrency market boasts more than 12,000 coins and tokens. This is an indication that numerous projects are bubbling beneath the top 100 and they also claim huge potential.

    In this article, we will go over these assets and how they may perform this year.

    Top Five Cryptocurrencies to Watch

    Ravencoin (RVN)

    Compound (COMP)

    Kusama (KSM)

    Gala (GALA)

    Audius (AUDIO)