
During the previous week, most cryptocurrencies saw notable decreases. A closer look at the global cryptocurrency market cap paints a clearer picture of what transpired.
At the start of the previous seven-day session, the global cryptocurrency market cap was $1.18 trillion. It dropped to a low of $1.09 T before increasing and finishing at $1.12, showing no significant increases or decreases. As a result of frequent declines in the value of major cryptocurrencies, the sector gradually shrunk.
Some of the top losers are BSV and KLAY. Both cryptocurrencies lost more than 14% of their value as selling pressure mounts. On the other hand, some of the top gainers are CFX and LDO as both experienced increases of more than 19% during this period.
During the previous week, there were no significant fundamentals during the previous intraweek session. This is also the same situation at the time of writing. Nonetheless, some assets are showing huge potential.
Top Cryptocurrencies to Watch
1. Bitcoin (BTC)
The largest cryptocurrency by market cap had a lot of ups and downs over the last seven days. In the end, the BTC lost more than 5%. Let’s go over some of the highlights.
Last week, Bitcoin dropped from its opening price of $28,667 and flipped $28,000. Before climbing to $27,690, it reached a low of $27,290. After breaking this key barrier, the top coin suffered losses of around 3%.
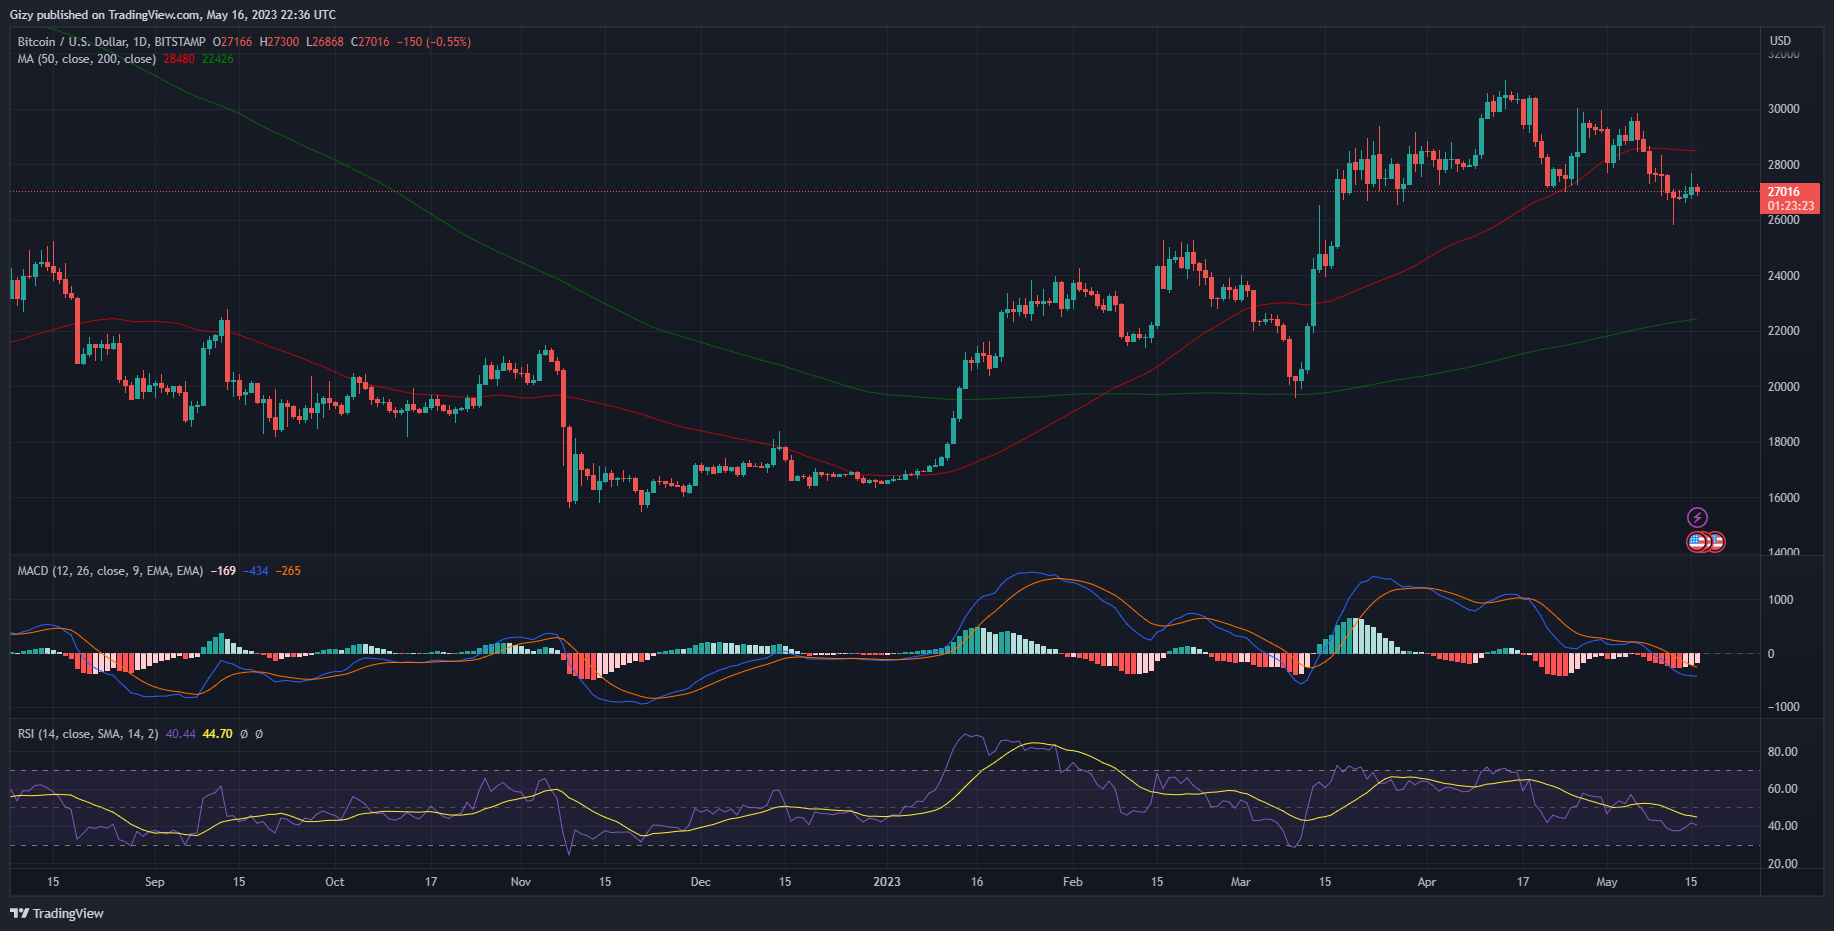
On Wednesday, BTC went above $28k but failed to gain stability and retraced. It dipped as low as $26,842 but rebounded and closed at it opening price.
We also noticed a similar move the next day. The apex coin started trading at $27,624 and was met with notable selling pressure. As a result, it dipped to a low of $26,720. However, this time, it failed to return to the said mark and registered losses of almost 3%.
The downtrend got worse on Friday as bitcoin sank further. It broke a new barrier: the $26k support, dropping to a low of $25,800. However, it bounced back and ended at $26,811 without seeing any significant gains or losses.
Indicators at the time were negative. For instance, the Moving Average Convergence Divergence closed below 0. The Relative Strength Index is another unfavorable metric. It started the week at 48 and finished at 40.
With a focus on the new intraweek session, there is almost no difference in market sentiment. However, indicators bear some good news. First, the 12-day MACD EMA is beginning to reverse its negative trend. A closer look reveals that the metric is almost straight and might curve upward if trade conditions improve.
We might consider what happened during the previous intraday session in light of this. Bitcoin reached a high of $27,666 after starting at around $27,000. This was the first attempt at a bullish move of the week.
This could just be the first of many, as the asset might retest $28,000 in the upcoming five days.
However, BTC is holding on to a very thin wall. This may herald further downward trends and an additional effort to retain the $26k support.
2. Ethereum (ETH)
The largest alternative cryptocurrency made many gains and ended the day at its starting price from two weeks ago. Then the event was symbolized by a doji.
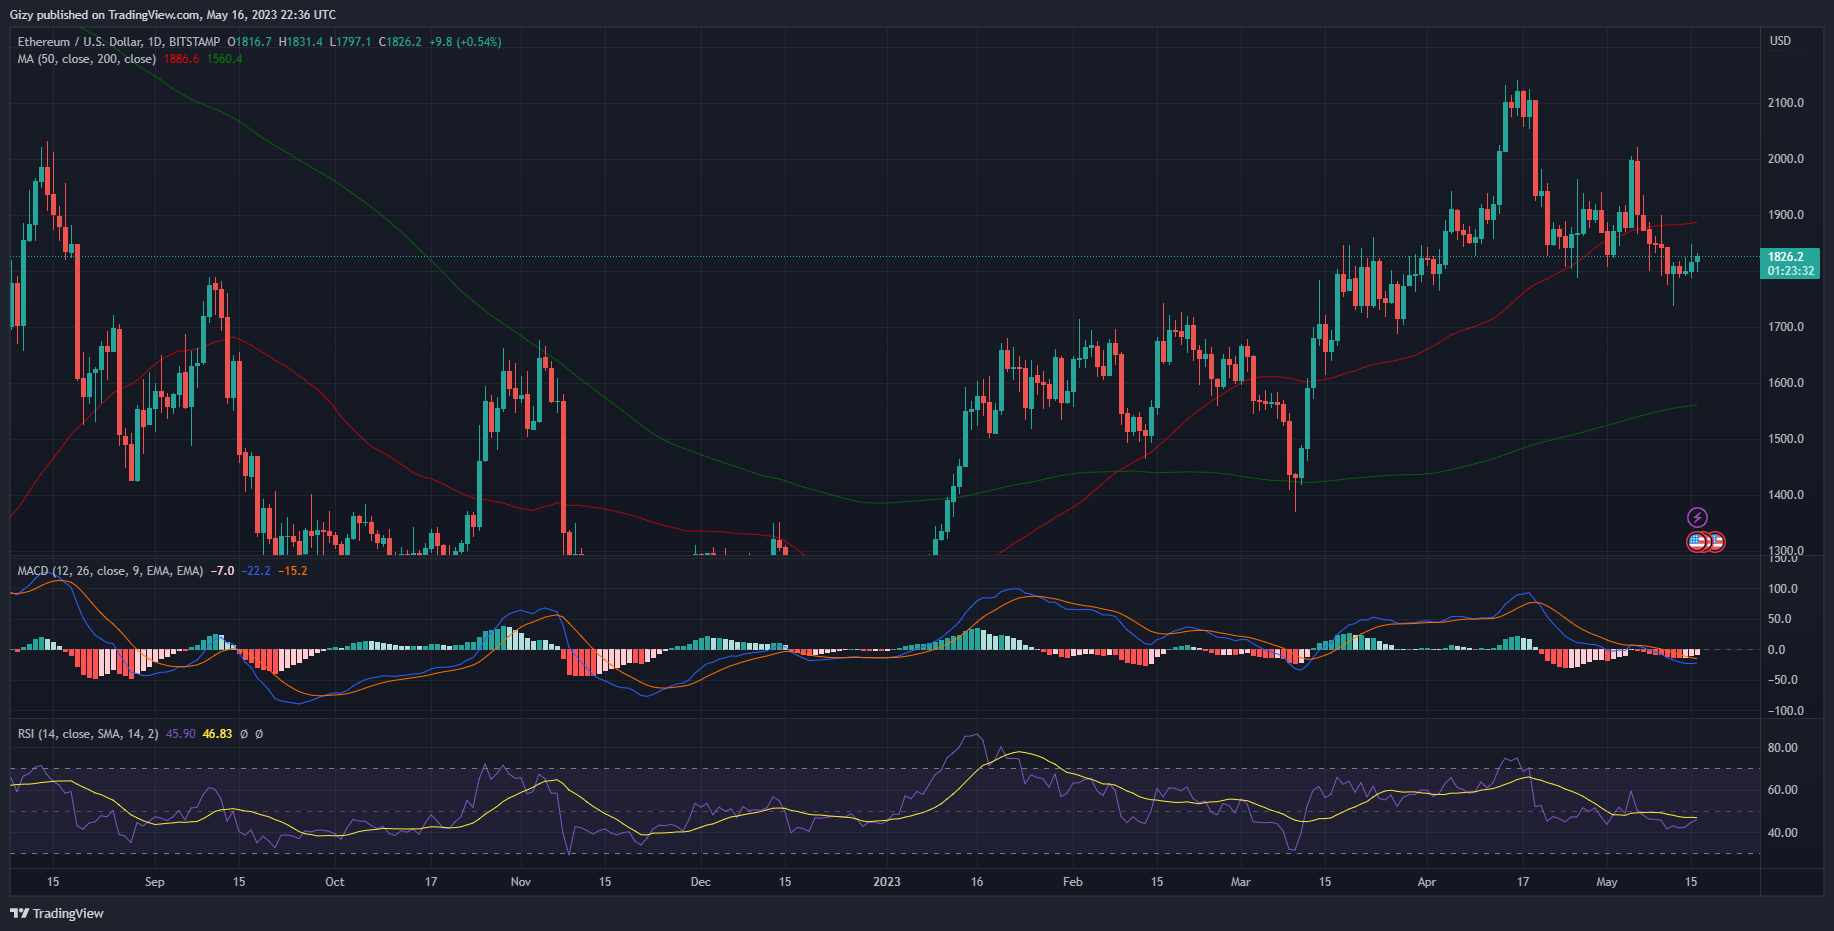
Contrary to the previous intraweek session, the asset closed with a notable fall in value. It suffered losses of more than 3%. Let’s go over the main events that occurred during this time.
It began slowly because there were no major price changes on Monday. But it made an attempt at a crucial level, much like other cryptocurrencies that were being watched. During the retracement, ETH hit a low of $1,800 but bounced back to close at $1,849.
It rose to its highest level of the week on Wednesday when it retested the $1,900 resistance. The price retraced below $1,800 for the first time in more than seven days and failed to break through.
Similar to Monday’s outcome, the second-largest cryptocurrency recovered and finished the day at its opening price.
It went over that line the next day and had losses of roughly 3%. Additionally, during the intraday session, it ended below $1,800. On Friday, the cost of ether dropped even more, hitting a low of $1,737 before rebounding and finishing at $1,808.
Additionally unfavorable were the indicators. Both the RSI and MACD dropped below 50.
They are, nonetheless, optimistic at this time. For instance, the 12-day is no longer retracing. It hit a wall and is now displaying indicators of a coming bullish convergence. The tiny increases the altcoin is experiencing are also having an effect on RSI. At the time of writing, the metric stands at 45.
We now turn to price changes in light of all these indicators. Ethereum is currently experiencing its second day of straight gains. This, while a minor shift, is what alters the trajectory of the indicators. This can also be a sign of additional upward tendencies.
The $1,900 resistance is one level to keep an eye on. If trade conditions stay the same, the largest alt may try to hit the mark. It’s also important to note how close the $1,800 support is.
