Category: Analysis

Get in-depth analysis and expert insights on the latest trends, market data, and emerging technologies. Stay informed with detailed evaluations and comprehensive breakdowns.

  • Top Five Cryptocurrencies to Watch This Week (July 8)

    Top Five Cryptocurrencies to Watch This Week (July 8)

    Most cryptocurrencies have been on the decline for the past seven days. Relief is in sight, and they see a notable recovery. However, several fundamental factors cause the current downtrend.

    One such is from Mt. Gox. It recently transferred over $2 billion bitcoin from one wallet to another. Traders started panicking as many anticipated that the defunct exchange is planning to dump its bag in anticipation of settling creditors.

    The German government continues to dump its Bitcoin bag. It has sold over 50% of its holding in the last thirty days. Nonetheless, it ramped up its pace, selling over 10,000 in the last seven days.

    Amidst the selloffs, the long-awaited Ethereum ETF is set to hit the market this week.

    Top Five Cryptocurrencies

    Bitcoin

    Currently, Bitcoin is experiencing modest gains with an attempted push past the $58,000 mark, although it has not managed to stabilize above this level and has retraced. Despite this, efforts to reach $58,000 are ongoing.

    Market panic has notably decreased, leading to positive shifts in certain on-chain data. For instance, there has been a more than 2% decrease in exchange reserves, indicating a decrease in supply as buyers absorb the excess available supply. Although there was a 0.24% increase in this metric in the last 24 hours, buyers are making significant headway.

    Germany, the largest seller, has sold over 50% of its holdings in the past fourteen days. As its holdings decrease, selling pressure may diminish.

    The moving average convergence divergence is responding to the increased buying activity of the coin. After being below 0 for several days, the metric is now showing positive signs. Additionally, the 12-day EMA has halted its downward trend and may begin an upward trend if market conditions remain stable.

    The potential upward trend of the 12-day EMA could signal bullish momentum and may indicate further price increases.

    In the upcoming days, it is anticipated that Bitcoin will surpass $58,000 and potentially test $60,000. However, it is likely that consolidation below the highlighted resistance level will persist over the next 24 hours before any breakout occurs.

    Ethereum

    Over the past four days, Ethereum has been trading within a range defined by the first and second pivot support levels. If it closes around $3,000, it will add to this pattern, with the $3,200 mark being a critical level to watch.

    However, there are concerns about the asset retracing, which could lead to another test of the S2 support at $2,800. The support has held up following two previous attempts in the last four days.

    Ethereum retraced from its high of $3,095, creating a wick, and the current movement is filling this wick, potentially indicating a continuation of the gains. Despite this, ETH has struggled to stabilize above $3,100 and may not see significant gains upon closing.
    The news of an Ethereum ETF hitting the market is seen as positive and is expected to impact prices. Traders are anticipating a potential surge that could break the coin from its current horizontal trend.

    According to the Fibonacci retracement, a close above $3,000 could provide the necessary relief for the S2 support. Currently trading at $3,062, the coin is above the 50% Fibonacci level, which is considered a strong point by many. The next level indicated by the metric is the 38% level at $3,179, with the expectation that Ethereum will surpass this level before the week ends.

  • Price Prediction  for PEPE 2024,2025, 2026, 2027

    Price Prediction for PEPE 2024,2025, 2026, 2027

    Pepecoin has experienced a period of consolidation after a significant surge that resulted in the asset reaching a new all-time high. Within the Ethereum ecosystem, the memecoin continues to outperform others of its kind. It exhibited substantial volatility during notable events in the crypto space, including the approval of EFT. 

    Following the approval on May 23, PEPE experienced significant gains and emerged as one of the top gainers among Ethereum products.

    In the days leading up to the milestone, PEPE’s value surged by over 40%. For instance, on May 20, it commenced trading at $0.0000091, reached a peak of $0.0000114, and closed with gains exceeding 24%. 

    Subsequently, during the next intraday session, it achieved a high of $0.000014, registering gains of over 20%. Following minor corrections, the coin resumed its upward trend and eventually hit a new all-time high of $0.000017.

     After this surge, the coin has entered a consolidation phase, with bullish sentiment aiming to accumulate and build momentum.

    As the Ethereum ecosystem experiences increased activity, the cryptocurrency is poised for further price fluctuations.

     The latest development involves a partnership between the ETH Foundation and Aztec, Polygon, Scroll, Taiko, and zkSync to enhance research through grant rounds on the blockchain.

    Current Price Trend

    The cryptocurrency in question has experienced a decline since its all-time high (ATH), losing over 14% within three days of reaching that milestone.

     This downtrend commenced with prices at $0.000016 and continued until the coin rebounded at $0.000013, establishing a horizontal trading channel above the $0.000014 level.

    However, on June 7, the coin experienced a significant drop, breaking through the support level and reaching a low of $0.000011 before rebounding. Despite this rebound, the asset ultimately closed with losses exceeding 10%.

    Following this substantial decline, the coin has occasionally surged above $0.0000129 but generally resumed trading within the horizontal channel. It reached a high of $0.000012, testing the $0.000010 support level. Currently, it is down by over 4% and may be headed for a retest of the $0.000010 support.

    The coin has lost its 50-day exponential moving average (EMA), suggesting a potential retracement to test the 100-day EMA at $0.000010. 

    Nevertheless, it is currently trading near the 50% Fibonacci retracement level. Significant demand is observed at $0.0000114, which is contributing to a slight recovery from the decline.

    The elongated wick of the latest candle reinforces the previous observation. The token retraced from a high of $0.000012 due to substantial selling pressure. This increased pressure is further confirmed by the relative strength index (RSI), which has retraced from 49 to 46. 

  • Toncoin Price Prediction for 2024, 2025, 2026, 2027

    Toncoin Price Prediction for 2024, 2025, 2026, 2027

    Toncoin has recently integrated with many new platforms, as the ecosystem continues to grow with the introduction of several new memecoins on the market daily.

    The project has announced a partnership with Tether to make USDt on TON accessible to all users. This collaboration reflects their strong efforts towards TON mass adoption, allowing users to purchase the stablecoin on TON and access other ecosystem services within minutes.

    In addition to this collaboration, the Open Network has attracted institutional investments. Pantera Capital, managing over $5 billion in assets, has invested in the Network, citing its potential to introduce cryptocurrencies to a wider audience.

    After its recent expenditure, Pantera is seeking to raise an additional $1 billion in funding.

    The project has also garnered increased interest from individuals, setting a new record on May 16th as the fastest blockchain, processing over 1 million new users in 24 hours.

    Many are curious about the attention TON is receiving. 

    According to Pantera, one reason for institutional interest in the asset is its integration with Telegram, a messaging app with over 900 million users. This interest from a major capital firm is likely to attract more attention from other companies to the Open Network.

    Current Price Trend 

    Over the past few months, TON has been experiencing a consistent upward trend. This steady climb has seen the coin surpass several key levels, with the momentum carrying over into the most recent intraweek session.

    About two weeks ago, the coin reached a new all-time high, breaking the $8 mark. This significant achievement was the result of a three-day uptrend, with an initial 7% increase from $6.80. However, on-chain data suggests a remarkable over 200% surge in large transactions during that period.

    Following the record high, TON experienced a sharp decline, dropping to a low of $6.90 from $7.69 before rebounding and closing above $7. Despite this, there were losses of over 7%.

    Nevertheless, the coin has been on an upward trajectory since then. 

    Currently, the price trends indicate the formation of a bear flag, potentially signaling an impending decline.

    Despite this, the cryptocurrency has demonstrated swift recovery from substantial market dips. This was evident when it retraced from $7.61 to a low of $7 on Monday but ultimately rebounded to close at its initial price.

    In the most recent correction, the coin experienced a decline of over 3% on Friday, but it is showing signs of recovery, working to erase these losses. Despite the retracements, various indicators still point to strong bullish momentum.

    One notable indicator is the exponential moving average, with the coin consistently trading above the 50-day EMA, indicating a sustained positive trend over an extended period.

    Toncoin Price Prediction 2024

    The cryptocurrency has been showing a consistent upward trend on the weekly charts. A notable surge occurred in March, with the coin gaining 36% in just seven days. However, the previous week marked the end of a four-week rally, starting at $6 and reaching $8.24.

    Recently, the coin experienced a dip of over 5%, dropping to a low of $6.77. 

    Currently, it is showing a doji pattern, indicating uncertainty about its future direction. The coin reached a high of $7.86 this week but also dropped to a low of $7.

    Several indicators suggest that the asset may experience further declines in the near future. The relative strength index is currently above 70, indicating that the asset is overbought and may need to correct. 

    In the past, a similar correction led to a drop of over 20% in just two weeks. If such a correction were to occur again, it could lead to a decline testing the $6 support level. However, the Fibonacci retracement level suggests significant demand around the 23% Fib level, potentially causing the asset to stabilize around $6.50 before continuing its uptrend or retesting the highlighted level.

    On the other hand, if TON follows the broader crypto market, it may surge and reach new all-time highs. Bullish investors will be looking for a closing price above $10.


  • Bitcoin Price Prediction for 2024, 2025, 2026, 2027

    Bitcoin Price Prediction for 2024, 2025, 2026, 2027

    Bitcoin has experienced a 4% decrease in value since its most recent halving. Despite a successful halving event, the cryptocurrency has seen a significant drop in trading volume, with a decrease of over 25% in the last 24 hours. 

    This decline in trading volume reflects a waning investor interest, exemplified by the first instance of zero inflow into the BlackRock iShare Bitcoin Trust (IBIT) since the approval of the bitcoin ETF on April 25.

    Prior to the halving, there were speculations regarding the impact on the supply and demand of Bitcoin. 

    Some sources claimed that exchanges would deplete their BTC reserves within nine months, while other reports suggested traders were anticipating a substantial demand shock. However, data indicates that miners are planning to sell off $5 billion worth of the largest cryptocurrency.

    It remains to be seen how these factors will affect Bitcoin in 2024 and the years to come.

    Bitcoin Price Prediction 2024

    Current analysis indicates that the apex coin is facing challenges maintaining prices above $63k, after an unsuccessful attempt to reach $67k. Despite expectations of price increases post-halving, the most recent price has come as a surprise. However, indicators suggest the potential for further short-term declines.

    The moving average convergence divergence exhibited a bullish convergence a few days ago, but this momentum was not sustained due to the lack of buying pressure from bulls. The 12-day exponential moving average (EMA) failed to complete the interception and has continued to decline, resulting in a growing distance between the two EMAs, giving bears an advantage.

    The relative strength index (RSI) is also in a downtrend, currently sitting at 42 and potentially returning to 38 if the downtrend persists.

    BTC recently approached testing the 50% Fibonacci retracement at $61,905, reaching a low of $62,405 before rebounding off the first pivot support. 

    According to the pivot point standard, bulls need to defend the S1 level or risk a drop to S2 at $53,650. It is anticipated that demand concentration will form around the 61% Fibonacci level at $59,217 in case of a pullback, with potential drawbacks to $55k should the downtrend continue.

    In a bullish scenario, bitcoin will aim to reclaim its pivot point at $68,131, which requires it to stabilize above $67k. Multiple selloffs have occurred around this level, indicating a key resistance point.

     Furthermore, Fibonacci retracement suggests a potential return to $73k once the bull cycle resumes.

    Regarding the apex coin’s performance in 2024, predicting specific price points several years in advance is highly speculative and challenging. 

    Factors such as market sentiment, adoption, technological developments, and macroeconomic trends will play crucial roles in determining the apex coin’s future prices. Therefore, it’s essential to carefully monitor market conditions and consider a range of variables when assessing long-term price projections.

    Bitcoin Rainbow Chart

    The Bitcoin rainbow chart suggests that the cryptocurrency may test higher price levels after the uptrend begins. However, the timing of when the uptrend will commence is uncertain and can only be determined by time. The chart shows the price movements before and after each halving event. 

    Historically, it has taken between 4 and 8 months for Bitcoin to resume its upward trend following a halving. For example, in 2016, the price surged six months after the halving event, but the bull run didn’t start until the following year. 

    Similarly, in 2020, it took four months after the halving for the bull run to begin.

    If a similar pattern occurs this time, Bitcoin could start its next bull run between August and December. 

    If the run commences earlier, the cryptocurrency may aim to reclaim lost levels within eight months or sooner, and then target $80,000. According to the rainbow chart, Bitcoin is likely to end the year with prices in the range of $85,000 to $113,000, with a median prediction of $99,000.

    Price Prediction 2025

    Based on historical data and the rainbow chart analysis, it has been observed that the year following a halving event often marks the peak of a bull run for Bitcoin. This trend has been evident in the two most recent halving cycles. For example, following the 2016 halving, Bitcoin’s price surged by over 1300%.

     Similarly, in 2021, BTC reached a high of $69,000 before experiencing a pullback, ultimately closing the year with gains of nearly 60%.

    Notably, there are currently no significant prevailing bullish or bearish factors that are anticipated to significantly impact the price of Bitcoin in 2025.

     This is despite ongoing geopolitical conflicts such as the Russo-Ukraine war, which will have entered its fourth year by 2025. The crypto community seems to have largely priced in these factors, with attention more focused on potential fresh geopolitical tensions.

    Given these observations, 2025 is anticipated to be a highly bullish period for Bitcoin, with expectations of reaching unprecedented price levels.

     Analysis of the rainbow chart has shown that Bitcoin tends to peak or stabilize near its highest points in the chart during bullish phases following a halving, indicating the potential for the asset to achieve stability at six-figure prices.

    Looking at potential price ranges, it is projected that Bitcoin, having closed 2024 near $99,000, may aim to maintain prices within the $110,000 to $120,000 range in the first quarter of 2025. 

    Subsequently, during the second quarter, there may be a continuation of the upward trend, with Bitcoin’s price potentially surging to the range of $131,000 to $160,000. Moving into the third quarter, it is anticipated that the price could range from $140,000 to $180,000. The peak of excitement could come in the fourth quarter, with Bitcoin possibly surging as high as $200,000.

    Price Prediction 2026

    Based on historical data from the rainbow chart, it is projected that Bitcoin’s current bull run may come to an end towards the conclusion of 2025, followed by a continuation of the bear market in 2026. 

    This pattern has been observed during the last two halving events. For instance, following the 2012 halving, BTC’s value dropped from $1,206 in 2013 to $322 in 2014. Similarly, after the 2016 halving, it decreased from $18,000 in 2017 to $4,000 in 2018.

    The trend continued to play out during the period from 2020 to 2022. The value of Bitcoin surged to a peak of $69,000 in 2021 before retreating to a low of $16,000 in 2022. Notably, during these declines, the losses were significant.

     For instance, in 2013, the value of BTC plummeted by almost 60%, while in 2018, it recorded a decline of over 73%. In 2022, Bitcoin’s value experienced a 64% drop. On average, the coin undergoes a 65% decrease during these periods.

    Considering this historical pattern, traders may anticipate a similar downturn. If Bitcoin closes at around $200,000, it is projected to return to five-figure values, potentially dropping to a range between $70,000 and $50,000.

    Price Prediction 2027

    In 2026, there was a significant decline in the value of the coin, but in 2027, it is expected to regain its lost levels based on historical trends. The market pattern suggests that the period leading up to the next halving will be relatively calm with small uptrends.

    For instance, in 2019, the leading cryptocurrency surged from $3,694 to $7,168, marking a 94% increase. In 2023, it recovered from $16,530 to $42,258, representing a 155% increase. On average, the asset gains over 124%. This forecast indicates that the largest cryptocurrency will likely reach six figures, with a projected close of around $140k in 2027.

  • Top Five Cryptocurencies to Watch This Week (June 25)

    Top Five Cryptocurencies to Watch This Week (June 25)

    The crypto market started recovering from the previous day’s decline that saw it lose more than 3% of its worth. The global cryptocurrency market cap dropped to a low of $2.2 trillion, the lowest in more than a month.

    News of the Mt. Gox settlement and the German government’s sale of $300 million worth of BTC were the most popular stories during the previous intraday session. Miners also announced the sale of $2 billion worth of Bitcoin. The trade was gradual and took place over the last twenty days.

    With a breath of fresh air, most cryptocurrencies are looking to reclaim lost levels. This is amidst the threat of the German government resuming sales. How will the market react?

    Top Five Cryptocurrencies to Watch

    BTC/USD

    Bitcoin lost almost 5% during the previous intraday session as it retraced below $60k for the first in over a month. The coin also became oversold due to massive and consistent declines. The apex coin dropped to a low of $58,400 but saw a small recovery and closed at $60k. The latest dip continues Sunday’s decline, which saw BTC lose $64k and close at $63,154.

    Nonetheless, the coin ended the bearish trend with its notable push to reclaim the lost levels. It briefly surged above $62k and reached a high of $62,395. Currently, it is up by almost 3%, and the bulls are looking to completely soak up the excess supply the asset had.

    The relative strength index is seeing notable improvement following its plunge below 30. Sinking to a low of 25, the metric is back above 30 in response to the most recent change in sentiment. The accumulation and distribution channel also suggests that the price increase may continue. The indicator is on the uptrend, showing considerable trading volume.

    With the notable decline in selling volume over the last 24 hours, the coin’s trading volume is down by over 20%. Nonetheless, several indicators are silent regarding next price action.

    Bitcoin will look to continue the hike and retest the 50-day exponential moving average. A climb above $64k will also guarantee an attempt at the pivot point around $65k.

    However, with the news of more selling pressure, the cryptocurrency will may retest $60k before the en of the week.

    ETH/USD

    Ethereum has shown signs of recovery after a recent downtrend. It started trading at $3,418, but then dropped to $3,233, marking its first instance of closing below $3,400 in over a month. Despite experiencing losses of more than 2% on Sunday and nearly 2% on June 24, bulls rallied the coin, leading to a recovery.

    The largest altcoin has since regained the $3,400 support, indicating that previous losses have been successfully corrected. 

    The relative strength index has dropped to its lowest point since May, signaling nearly equal selling pressure, but there is an upward trend in buyback activity.

    With the bulls regaining composure above $3,400, they will likely try to sustain this momentum. Traders are closely watching the coin’s pivot point at $3,515, which is considered a pivotal level by many. 

    The Fibonacci retracement level suggests that surpassing $3,450 could give the climb to this critical level an additional boost due to significant demand concentration.

  • Crypto Analysis 25/6: BTC, ETH, BNB, SOL, XRP, TON

    Crypto Analysis 25/6: BTC, ETH, BNB, SOL, XRP, TON

    On June 24, the crypto market experienced one of its ‘bloodiest’ phases with BTC at the forefront. It bled and lost over 5% of its value.

    It saw considerable declines over the last seven days. Trading started at $2.33 trillion on June 18 but faced a gradual descent and hit a low of $2.2 trillion during the previous intraday session. The current valuation places the losses at over 5%.

    The German government was one reason for the decline. It announced on Monday that it sold over $300 million worth of Bitcoin it seized from a piracy website in January. The website allegedly had over 50,000 units of the asset in store.

    Nonetheless, on-chain data shows that the government is not done selling. It plans to continue the sale as it transferred more funds to two exchanges early on June 25. Nonetheless, the amount is smaller, and the market failed to react.

    With a brief overview of what happened in the crypto market, Let’s see how some assets performed.

    BTC/USD

    Bitcoin is seeing notable improvement in price following the previous day’s massive decline. It is up by almost 3% at the time of writing as it sees notable buyback as the bulls soak up the supply.

    The previous day is one traders will talk about for an extended period as the coin sank to levels it was believed to have exceeded and will not return to. It dropped below $60k and edged close to its 2-month low. The apex coin hit a low of $58,456 and lost almost 5%.

    Aside from the German government, miners were also responsible for the massive dumps in June. For example, they sold 30,000 BTC worth over $2 billion. The latest sale reduced these miners’ reserves as the plan to dump.

    Nonetheless, the asset became oversold due to the most recent dump. The relative strength index dropped below 30 and hit a low of 25. It is back above 30 as the bulls continue to soak up the supply. Currently at 35, it is seeing notable buying pressure but still under bearish dominance.

    The largest cryptocurrency hit a high of $62,300 a few hours ago. However, it hit a brick wall, and is exchanging at $62k at the time of writing. The latest move is an attempt by the bulls to reclaim $65k. Indicators are silent as to if they’ll achieve it.

    ETH/USD

    Ethereum continues to recover from the downtrend from the previous day. It started trading at $3,418 but retraced to $3,233. The latest decline saw the asset attain a deeper low and close below $3,400 for the first time in over a month. The dip occurred barely a day after the asset incurred a more than 2% loss on Sunday.

    The asset registered losses of almost 2% on June 24 as the bulls rallied the coin following the dip. The recovery is ongoing as the largest altcoin regained the $3,400 support. The current day’s candle suggests that it successfully eliminated the previous losses.

    Nonetheless, the relative strength index dropped to May’s low, indicating almost equal selling pressure. It is also on the uptrend as buyback continues. After regaining composure above $3,400, the bulls will attempt to continue the attempt.

    The coin’s pivot point is set at $3,515. Many traders consider this a safe point, so the asset will look to climb above it. The Fibonacci retracement level suggests that the climb to this critical level will get an extra boost if it climbs above $3,45 due to notable demand concentration.

    BNB/USD

    Binance coin is not exempt from the massive declines the crypto market experienced. The previous intraday session marked the second day of consecutive declines as it lost over 4% cumulatively. Nonetheless, it lost its pivot point on Sunday.

    It started June 24, exchanging at $577, but retraced as the selloffs hit. It sank to a low of  $550 for the first since May 3. Recovery started towards the end of the day, and the asset closed at $568 with losses of almost 2%. It eliminated the loss of the previous day at the time of writing.

    The accumulation and distribution chart suggests the hike is sustainable as it is driven by volume. The metric is on an uptrend in response to the latest price improvement and may continue this trend if volume increases.

    Price will also move in reaction to the change. It is worth noting that the coin may continue to hold $560. This is due to the 23% Fibonacci retracement being at $563.

    Pushing upwards, the bulls will look to reclaim $600. However, it must reclaim the pivot point at $587. Previous price movement suggests that this mark will serve as an accumulation point and a level for momentum build-up.

    SOL/USD

    Solana is seeing notable price improvements at the time of writing. It was one of the top gainers in the top 10 during the previous intraday session. Nonetheless, the asset was not exempted from the massive bearish sentiment.

    It started the previous day at $128 but retraced. It retraced to a low of $122, the lowest since May. Nonetheless, the coin saw a swift recovery as the selling volume cleared. It reclaimed $130 and ended the day at $132, gaining almost 3%.

    The bullish trend is ongoing, and the coin is looking to reclaim more levels. Since bouncing off the first pivot support, the bulls we look to regain composure above the pivot point at $157. It is also worth noting that the altcoin tested $140 but experienced small corrections.

    If SOL gains stability above $140, it will have ample support at the 38% fib level at $137 as it possesses notable demand concentration. Nonetheless, flipping $150 may not be possible this week as previous price movements suggest an upcoming horizontal price trend.

    Solana may trade between $140 and $150 for an extended time before a final breakout next week if the bullish trend continues.

  • Solana Price Prediction 2024, 2025, 2026, 2027

    Solana Price Prediction 2024, 2025, 2026, 2027

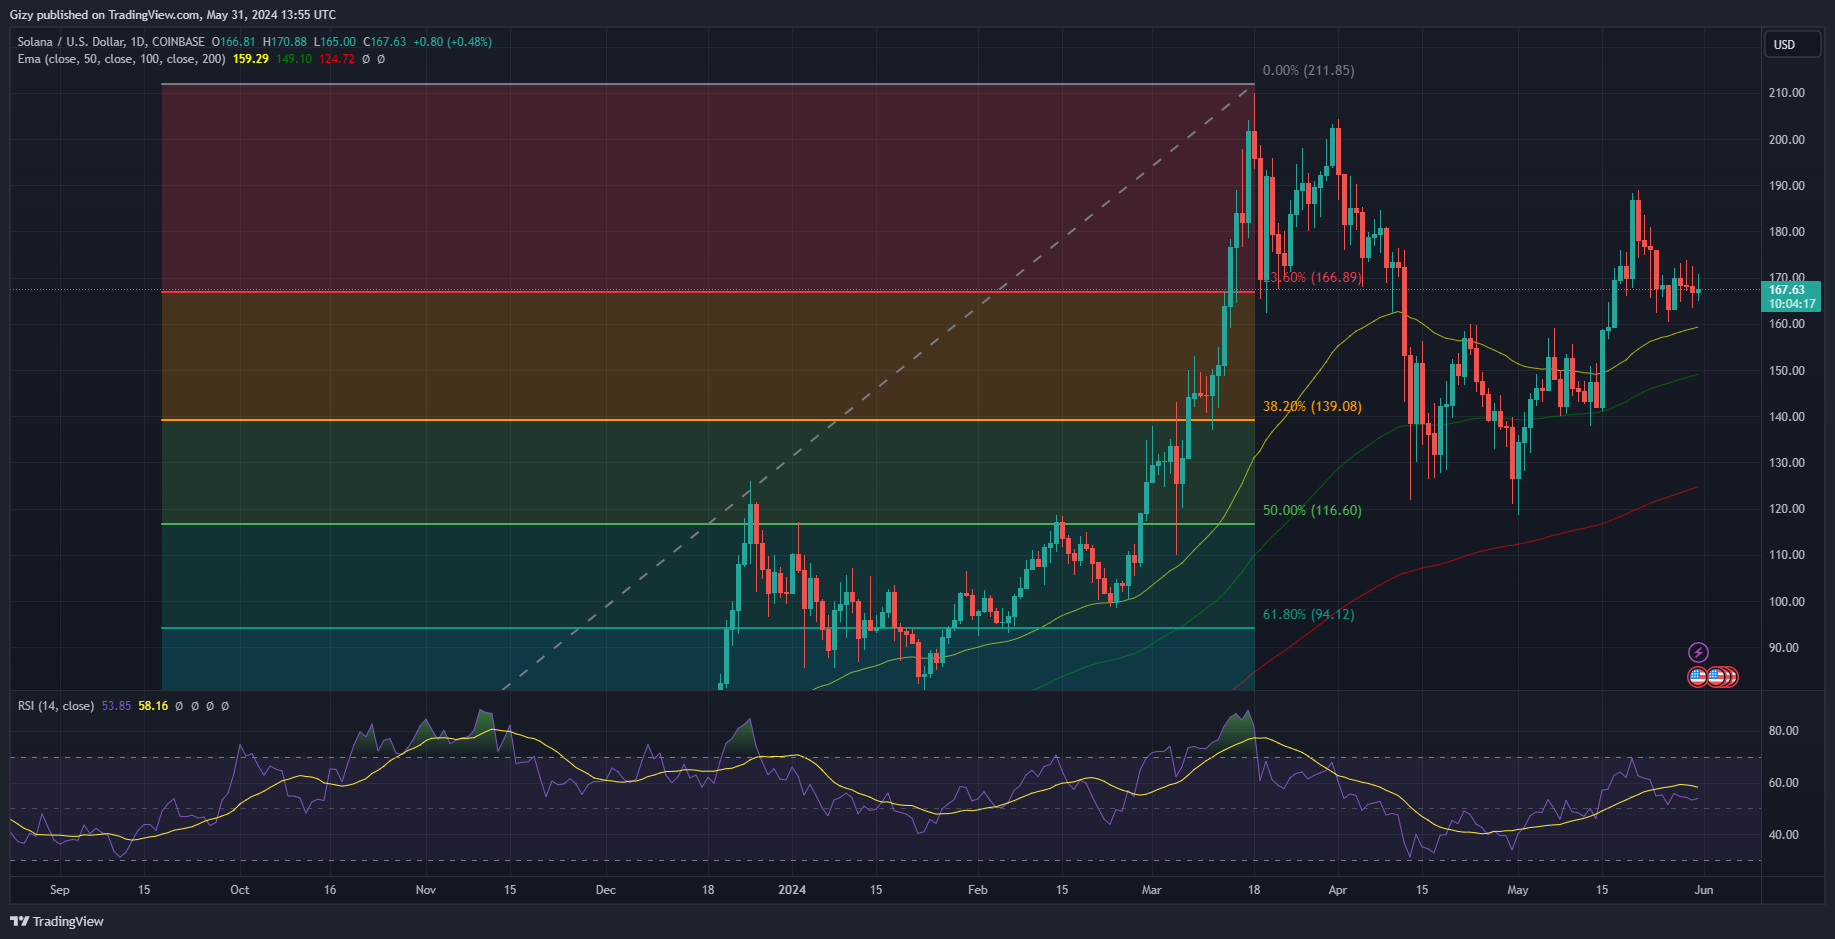
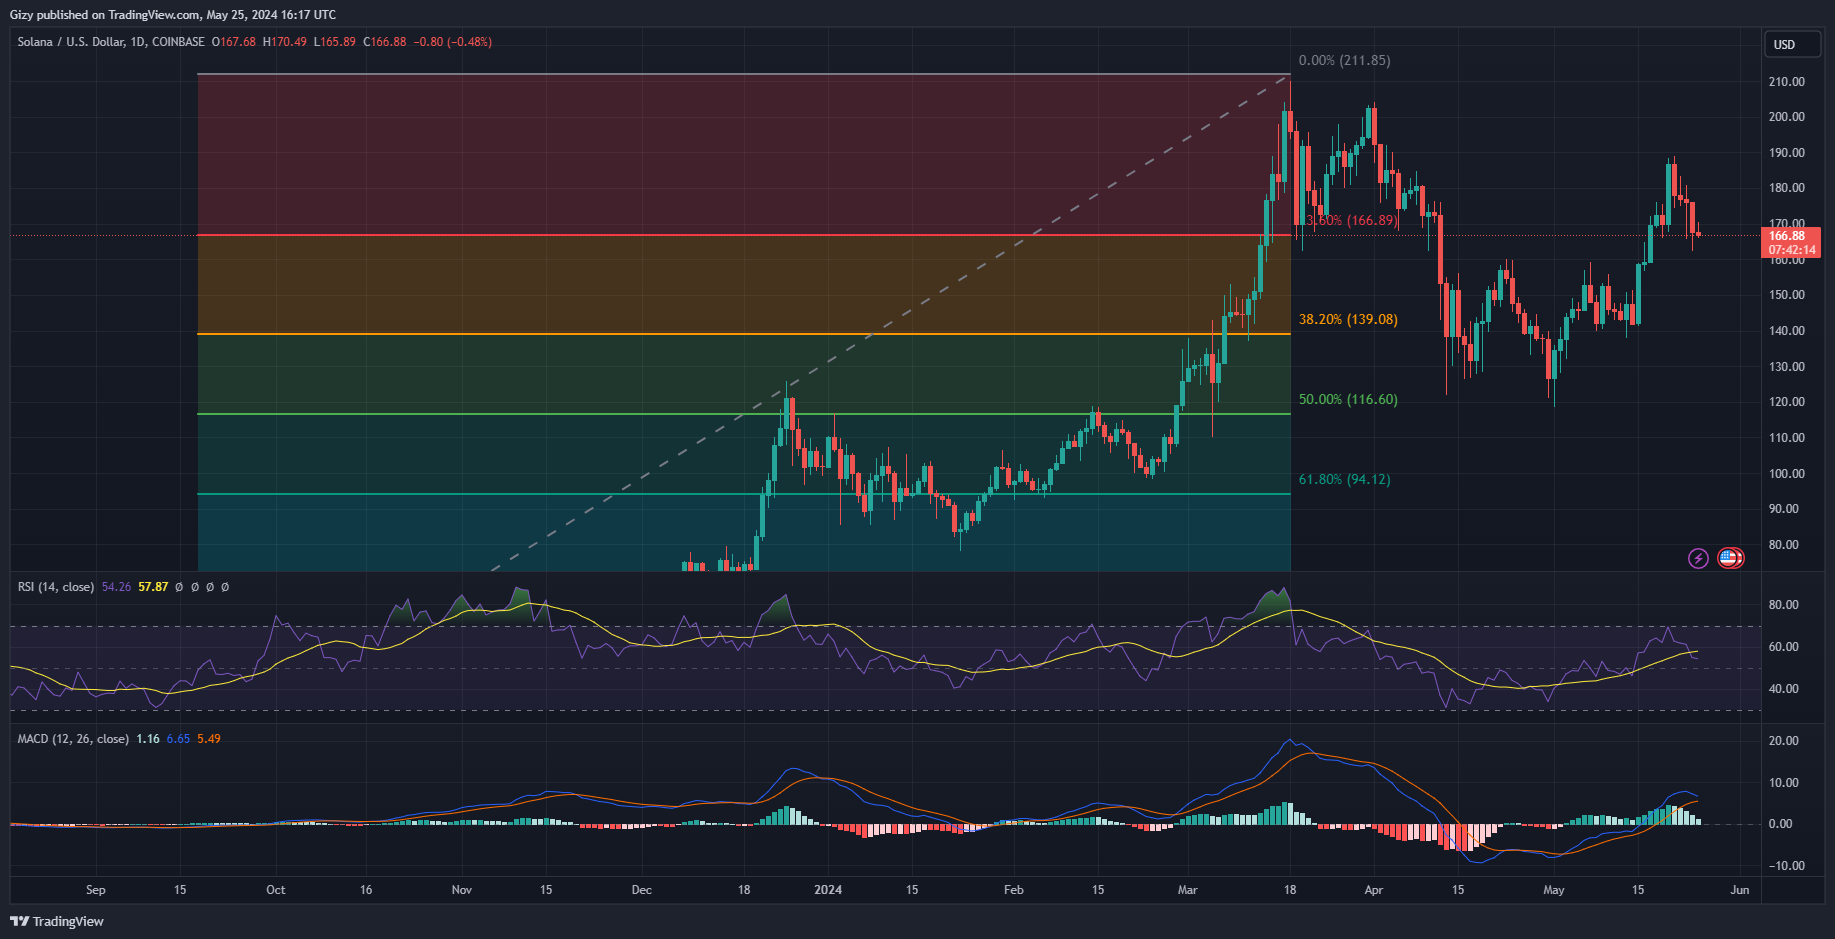
    At the time of writing, Solana is trading at $169. Following three days of slight price declines, the coin may be heading for its first green.

    The chart shows a lot of uncertainty. It appears the bulls are trying to consolidate their gain but are doing a poor job at it. This comes after a massive 10% dip between May 21 and May 24.

    The coin had several dojis following the drop in the last three days, signaling no significant price improvement. Despite the overall bearish trend in the cryptocurrency market, the altcoin seems relatively unaffected.

    However, the previous drop 10% decline is in response to fundamentals

    FTX Bailout Threatens Price

    FTX has recently announced that it has sufficient funds to pay off all its creditors and customers, with over 18% of the total funds remaining after the payout. The firm anticipates having $16.3 billion after selling off its assets to settle its $11 billion debt.

    Following this announcement on May 7, SOL experienced a more than 3% price decline due to the company’s plans to sell off its holdings to pay its debts. It’s worth noting that over 34% of the American cryptocurrency exchange’s total reserve comprises Solana.

    In April, FTX sold two-thirds of its holdings at a 63% discount to Galaxy Trading, Pantera Capital, and Neptune Digital Assets. This sale resulted in the cryptocurrency closing the month with losses exceeding 37%.

    The recent announcement has raised concerns among traders, with many anticipating another decline when FTX decides to sell its remaining holdings, although no specific timeline has been provided for this.

    Following its announcement of paying off creditors, the firm recently sold 784,000 SOL. The buyer was Figure Market, which announced that it bought the coin for a discounted price of $102 per unit. This meant it spent $80 million on the purchase.

    The auction, which took place on May 22, had other audiences as the firm called on other stakeholders to join. The total amount of Solana FTX sold might be higher. Additionally, the new buyer failed to disclose what they intend to do with the asset.

    In addition to FTX’s challenges, Michael Saylor has announced that the SEC will target several coins and tokens, identifying Solana as one such asset.

    Following Saylor’s comments, Gary Gensler, the SEC chairman, announced on CNBC that regulators would be targeting specific cryptocurrencies.

    Given the potential for further regulatory challenges, the cryptocurrency market is expected to experience significant declines and increased volatility.

    Solana’s Current Price Trend

    Solana is seeing small increases as the bulls attempt recovery. However, the price change is not significant, and it is printing a doji. Nonetheless, this is a green doji, which indicates small bullish actions. The small hike comes amidst a 6% drop in trading volume.

    Looking at the broader picture, the asset is trading above the 100-day EMA, signaling a bullish trend, and above the 200-day EMA. Additionally, it is trading above the 50-day EMA, indicating that the asset is maintaining its bullish posture.

    In response to April’s decline, the moving averages show mixed signals. For instance, the 50-day MA is declining, but the altcoin is trading below it.

    Despite the downtrend, SOL continues to trade above the 200-day MA. If the 50-day MA continues its decline, the asset may experience a death cross.

    Solana Price Prediction 2024

    The future for SOL looks uncertain as further price declines are expected, with bulls trying to prevent a downtrend at various critical levels. Following its recent downtrend, the altcoin aims to keep prices above the pivot point at $150. The relative strength index is trending almost parallel, indicating no large pressure from the bulls or bears.

    Price have remained stable above $166 with small declines. Price movement suggests significant demand concentration at the mark. Adding to the strength of the level is the Fibonacci retracement level. It is currently holding on to the 23% Fib level.

    Traders may gear up and prepare for a potential drop to $160. Breaking the 23% Fibonacci level could cause the altcoin to retest May’s at $140.

    On the other hand, the cryptocurrency will attempt to regain lost levels and target the first pivot resistance at $180. Historical price movements suggest that the coin may stabilize around this level for an extended period before making further attempts. Once stability is achieved above this mark, the coin will aim to surge to as high as $200.

    As the overall crypto market gains momentum, Solana will attain a new all-time high (ATH) before the year ends, with a potential test of $300 for the first time.

    Price Prediction 2025

    Many are expecting a continuation of the bullish trend that closed out 2024 in the upcoming year. According to an analyst’s previous prediction, several assets, including SOL in the crypto market, are projected to experience a significant increase in value in 2025.

    On the weekly chart, SOL is recovering from a bearish divergence, with the MACD showing a downtrend. However, it’s anticipated that this will change once the bull run begins, resulting in a bullish divergence.

    Historically, when SOL experienced a similar interception in the 1-week timeframe, it saw a gain of over 1000%. While such a substantial increase may be unlikely in 2025, the asset is anticipated to see surges ranging from 200% to 500%. Similar patterns support this trend played out in 2021.

    Drawing a parallel to Bitcoin’s historical performance, following its previous halving, the asset surged by over 500% before undergoing a correction. With a projected 200% increase in 2025, SOL could reach as high as $800 from its 2024 closing price of around $300.

    The pivot point standard also suggests a potential support level of $264, which could serve as a launchpad for SOL’s performance in 2025.

    Price Prediction 2026

    It’s anticipated that the period approaching 2025 will likely experience a bearish trend.

    Additionally, the outlook for 2026 suggests a bearish market for SOL. Historical data indicates that the second year following a halving tends to be the most negative.

    This trend is evident in Ethereum’s performance during similar periods, such as the over 82% dip in 2018 and the over 67% loss in 2022. Similarly, Solana experienced a decrease of over 90% in 2022.

    With a potential closing range of $500 to $700 in 2025, the altcoin could retrace to as low as $200 once the bear market commences.

    However, the coin could rebound to around $250, as indicated by the critical level of $264 highlighted by the PPS.

    Price Predictions 2027

    Historically, the year following a bear market tends to be mildly bullish on several cryptocurrencies as they attempt to recover and reclaim lost levels.

    For instance, the value of the apex altcoin surged from $130 to $363 in 2019 and from $1,192 to $2,447 in 2023. Similarly, SOL experienced a significant 900% gain in 2023. If this trend continues, the asset may reach between $300 and $500 by the end of 2027.

  • Crypto Analysis 28/5: BTC, ETH, BNB, SOL, XRP, DOGE, TON

    Crypto Analysis 28/5: BTC, ETH, BNB, SOL, XRP, DOGE, TON

    Many traders eagerly await the impact of recent developments on the price of BTC in the upcoming days. The news of significant movements of Mt. Gox assets has caught the attention of the crypto community. On May 28, on-chain data indicated the transfer of over $9 billion worth of BTC from multiple wallets controlled by the exchange.

    The accumulation of funds is linked to the forthcoming payout to creditors affected by the previous hack. There is speculation about whether the payout will be made in cryptocurrency or cash. If it’s a cash payout, it could potentially lead to a further decline in the price of Bitcoin.

    Following this news, the global cryptocurrency market cap experienced a decline of over 2%. The market has shown minimal volatility over the past seven days.

    Given the uncertainties surrounding these developments, it’s uncertain how the crypto market will react in the coming week.

    Top Five Cryptocurrencies to Watch

    BTC/USD

    Bitcoin is currently showing a doji pattern on a weekly scale, indicating a lack of significant price movement over the last 48 hours. If the doji closes with a red candle, it would mark the end of a two-week uptrend during which Bitcoin gained over 3% and reached a high of $72,000.

    Bitcoin peaked at $70,600 in the previous session but closed below that level, ending the day with nearly 2% gains. However, the current session is witnessing a reversal, with Bitcoin losing all its gains. The price dropped to a low of $67,000 and is now trading at $68,200, down almost 2%. Indicators suggest the possibility of further price declines.

    The moving average convergence divergence (MACD) is signaling sell orders, with the 12-day exponential moving average (EMA) approaching the 26-day EMA. This bearish convergence indicates a potential downturn in the near future.

    Furthermore, the relative strength index (RSI) is also declining, suggesting an increase in selling volume. If this trend continues, Bitcoin may experience a decline to the 23% Fibonacci retracement level at $66,000, with a further drop possibly leading to a retest of the pivot point at $64,000.

    ETH/USD

    Ethereum has experienced a significant 24% increase in value over the past week, rising from $3,000 to a peak above $3,900. However, there are indications that a potential market correction may be on the horizon.

    Despite a brief uptrend in the previous session with a peak at $3,973, Ethereum is currently showing a red candle and decreased trading volume, reflecting negative market sentiment affecting significant cryptocurrencies.

    The relative strength index (RSI) has dropped from 70 to 68, suggesting a potential further decline. Since May 20, the RSI has been trending close to 70, indicating that Ethereum is overbought and due for a correction, which may occur within the next five days.

    The 12-day Exponential Moving Average (EMA) has halted its upward movement, and if the downtrend continues, a bearish convergence may occur. The $3,600 support level is crucial, and a failure at this level could lead to a decline towards the 23% Fibonacci level at $3,400. However, there could be attempts by the bulls to push the price towards $4,000 before the week ends.

    BNB/USD

    Recently, Binance Coin (BNB) has shown a lack of significant price movement, remaining within a narrow range over the last five days. Despite briefly reaching $625 at one point, it quickly retraced back to $600, maintaining its sideways trend. On a weekly scale, BNB is displaying a doji pattern, indicating a decrease in volatility. In the past 48 hours, the coin reached a high of $613 and a low of $573, with no substantial price changes.

    The relative strength index (RSI) has stayed above 50, giving an advantage to the bulls in response to the recent price behavior. However, the range-bound movement suggests an imminent breakout, raising questions about the direction it may take.

    The Moving Average Convergence Divergence (MACD) histogram has declined over the past seven days, indicating a bearish convergence. This suggests a potential downward movement, with a likely retest of the 23% Fibonacci level at $565. There is strong demand around the $575 mark, where bulls may attempt to defend the price.

    SOL/USD

    Solana experienced a 4% loss at the end of the previous week, reaching a high of $188, just $2 short of crossing the $190 mark. The bulls are trying to recover from these losses, with the coin showing signs of uncertainty while bouncing back from a drop to $164.

    The moving average convergence divergence has been indicating sell signals since last week, with the 12-day EMA intersecting the 26-day EMA. However, the current candle is impacting the divergence.

    Despite this, the coin is struggling to maintain a price above $160, and if the bulls fail to defend this level, it may retest the $160 support, potentially leading to a further decline to as low as $140. On the other hand, if the coin stabilizes above $170, it may attempt to reach $180.

    XRP/USD

    The price of XRP has been consolidating between the narrow range of $0.52 and $0.54, showing reduced volatility over the past five days. Despite this, the coin achieved a modest 3% gain over the previous seven-day period.

    Currently, XRP is forming a doji candlestick pattern, indicating indecision in the market and potentially signaling an upcoming breakout.

    However, whether this anticipated breakout will occur within the next five days is uncertain. Nevertheless, several technical indicators suggest the possibility of a further price decline.

    The Moving Average Convergence Divergence (MACD) histogram is displaying a declining pattern, suggesting a gradual convergence between the 12-day and 26-day Exponential Moving Averages (EMAs).

    Furthermore, the 26-day EMA is currently positioned above the 12-day EMA, indicating a bearish trend. Additionally, the 12-day EMA has paused its upward trajectory in response to the recent price movement.

    Considering these indicators, it is plausible that XRP may experience further downward movement, potentially retracing to as low as $0.50. The upcoming week will reveal whether the price will indeed reach this level.

    Moreover, XRP is trading below the 50-day EMA, implying a bearish sentiment. However, there is a possibility that bullish traders may endeavor to stabilize the price above $0.53.

  • Top Five Cryptocurrencies to Watch This Week (May 27)

    Top Five Cryptocurrencies to Watch This Week (May 27)

    On May 28, Mt. Gox moved over $9 billion worth of Bitcoin, causing the top coin and other assets to register significant price declines.

    The news of such a move in anticipation of a selloff also affected the global cryptocurrency market cap. It failed to register any significant changes in the last 24 hours. Nonetheless, a closer look at the chart suggests a gradual decline in the market cap.

    Aside from the small decline some cryptocurrencies experienced during the current intraday session, the question of how the crypto market will perform in the coming days arises.

    Top Five Cryptocurrencies to Watch

    Bitcoin (BTC)

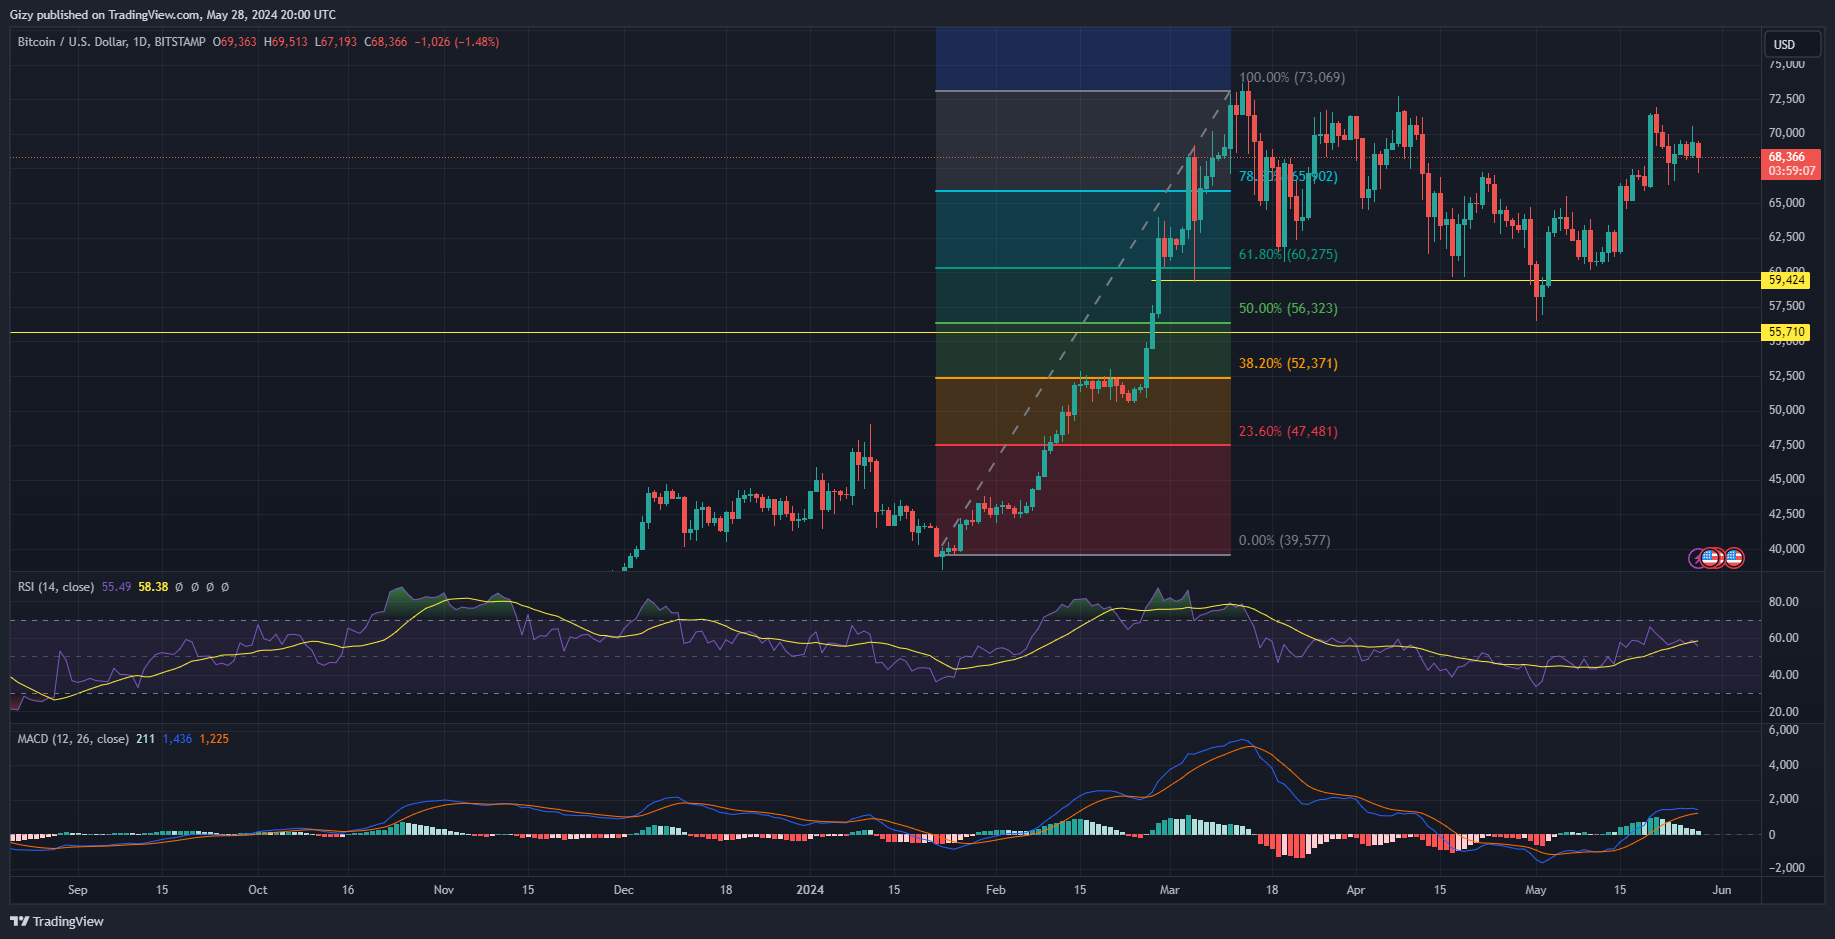
    Bitcoin is currently experiencing an over 2% decline at the time of writing. It was the worst-hit asset in the top 10 as the negative fundamental was centered around it. It has dropped to a low of $67,100 and is struggling to keep prices above $68k.

    The most recent trend is the opposite of what transpired during the previous intraday session. BTC was mostly bullish as it climbed above $70k after more than four days below it. However, the stay above the mark was shortlived as it faced massive rejections at $70,600.

    In the last five days, price action has been range-bound as the coin failed to decisively flip the first pivot resistance. During the period under consideration, it tested the mark consecutively, faced rejections, and lost momentum.

    BTC’s latest low indicates that the asset is edging close to testing the pivot point at $64,100. In response to the most recent trend, the relative strength index is also on the decline. It dropped 54, which still places the bulls at an advantage.

    Nonetheless, the bears may seize the initiative as the moving average convergence divergence is displaying sell signals. The 12-day EMA is close to intercepting the 26-day EMA. With the bearish convergence almost complete, the divergence will take place.

    A continuation of the most recent dip will expedite the process, and the apex coin may drop as low as $64k before recovery.

    Dogwifhat (WIF)

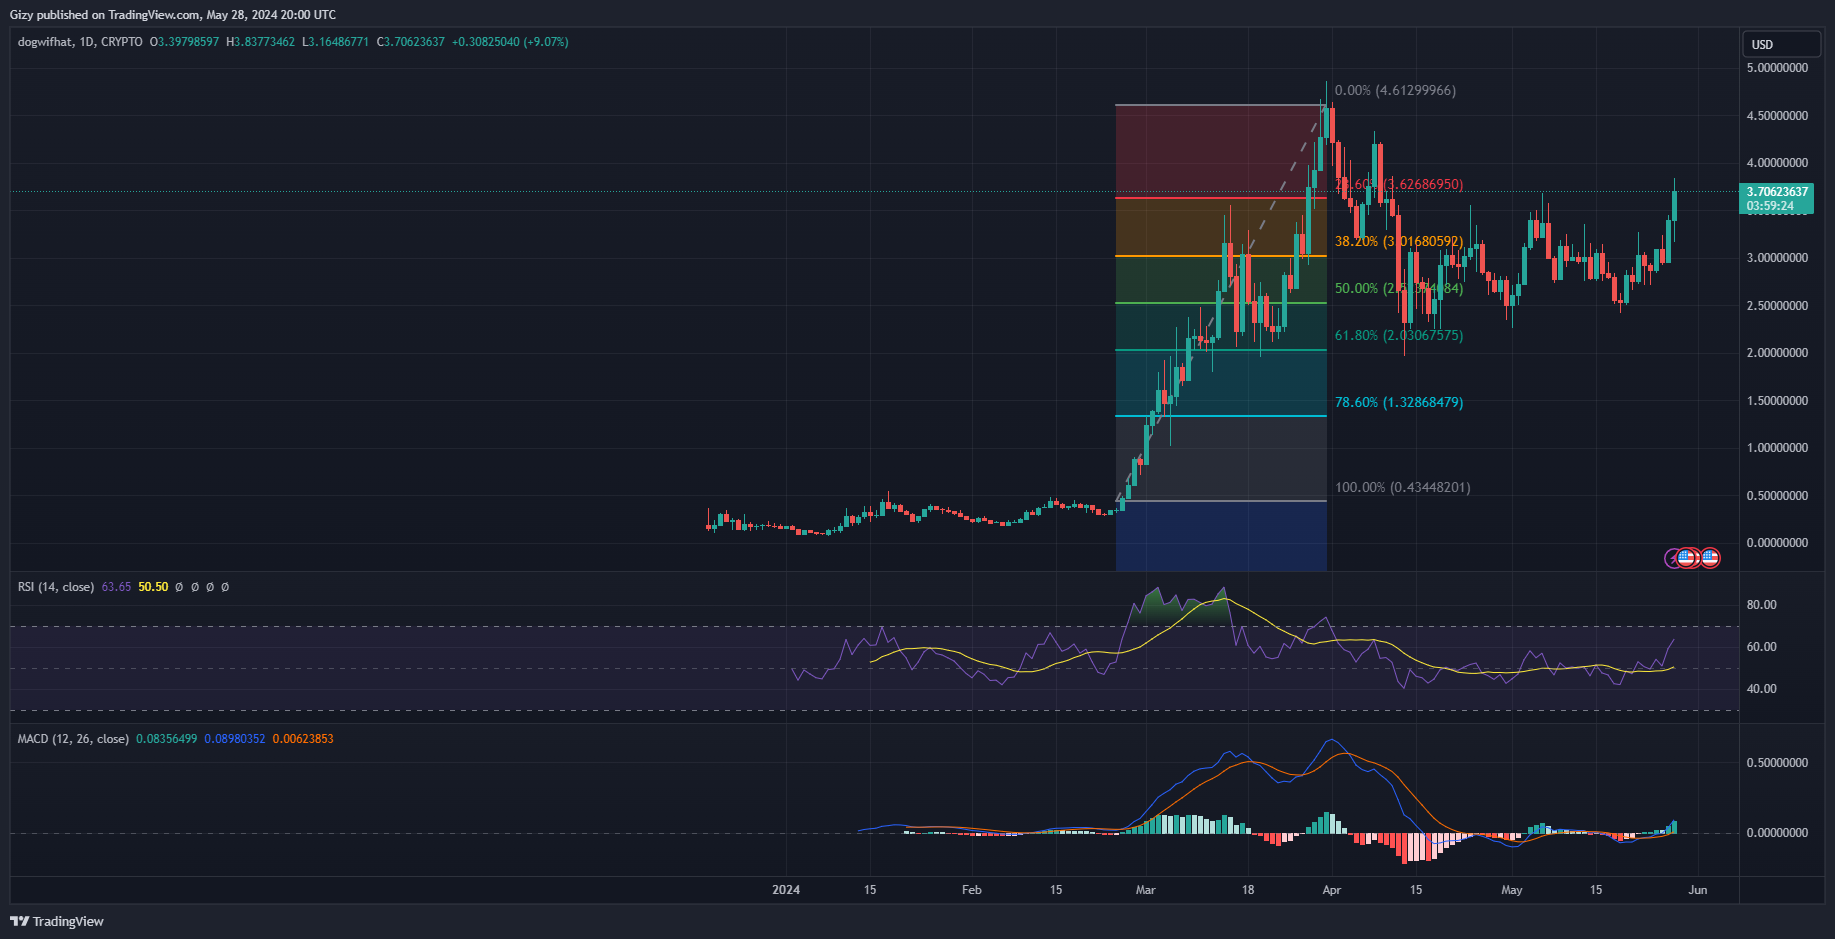
    WIF is experiencing more bullish actions than prevalent sentiment. It edged closer to testing the first pivot resistance but faced major rejections at $3.83. Nonetheless, it dropped to a low of $3.16 a few hours ago before rebounding.

    The most recent surge continues the previous day’s bullish trend. It peaked at $3.44 after kicking off at $2.95. It also ended the period with gains exceeding 15%. Following the hike, it decisively flipped its pivot point.

    With the continuation of the uptrend, the token is edging close to testing the next pivot level at $4.10. Currently up by 9%, the RSI is on the uptrend in reaction to the massive increase in buying volume. WIF saw a more than 60% increase in trading volume in the last 24 hours. The metric is at 63, which points to room for more price hikes.

    The current price $3.70, is above the 23% Fibonacci retracement level. This means it may form a new support around the mark due to the demand concentration present.

    MACD is printing no new signals, which may indicate the continuation of the uptrend. The bulls will look to close the week above the first pivot resistance.

    Stacks (STX)

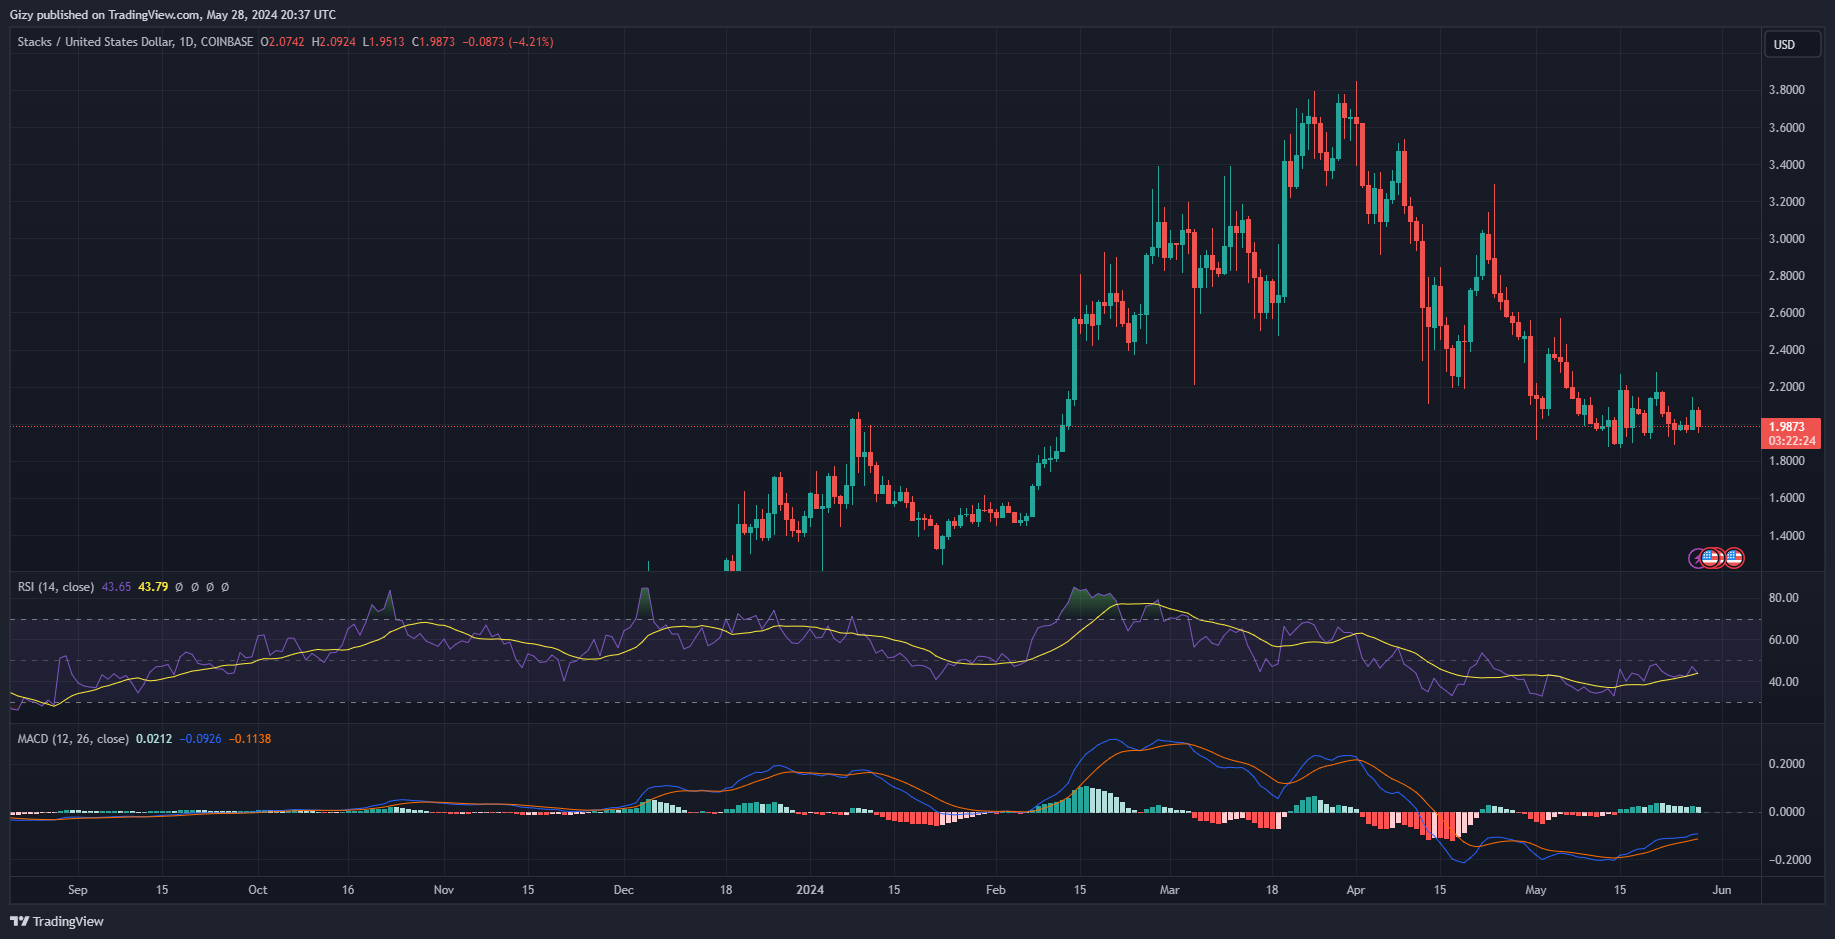
    Stacks is gradually picking up volatility after over four days of reduced movement. However, the last 48 hours were marked with both ups and downs. For example, the previous intraday session saw the asset gain over 5% as it peaked at $2.14. However, it is losing more than half the gains it accumulated during the previous day.

    Trading at a loss of more than 4%, STX may be gearing up for another decline. Currently trading at $1.98, it briefly lost the $2 support.

    The relative strength index points to a notable increase in selling pressure as the culprit of the most recent decline. This comes amidst the over 30% increase in trading volume it saw in the last 24 hours. the metric is at 43 due to this trend.

    MACD is still on the uptrend but will print a sell signal if the bulls fail to stage a buyback. The histogram accompanying the indicator has been almost equal over the last five days. However, if the price decline persists, the 12-day EMA will start a downtrend and intercept the 26-day EMA this week.

    Stacks will retest $1.80. It remains to be seen if it will rebound at this mark. On the other hand, the bulls may stage a buyback and send the asset above $2.10.

    Floki inu (FLOKI)

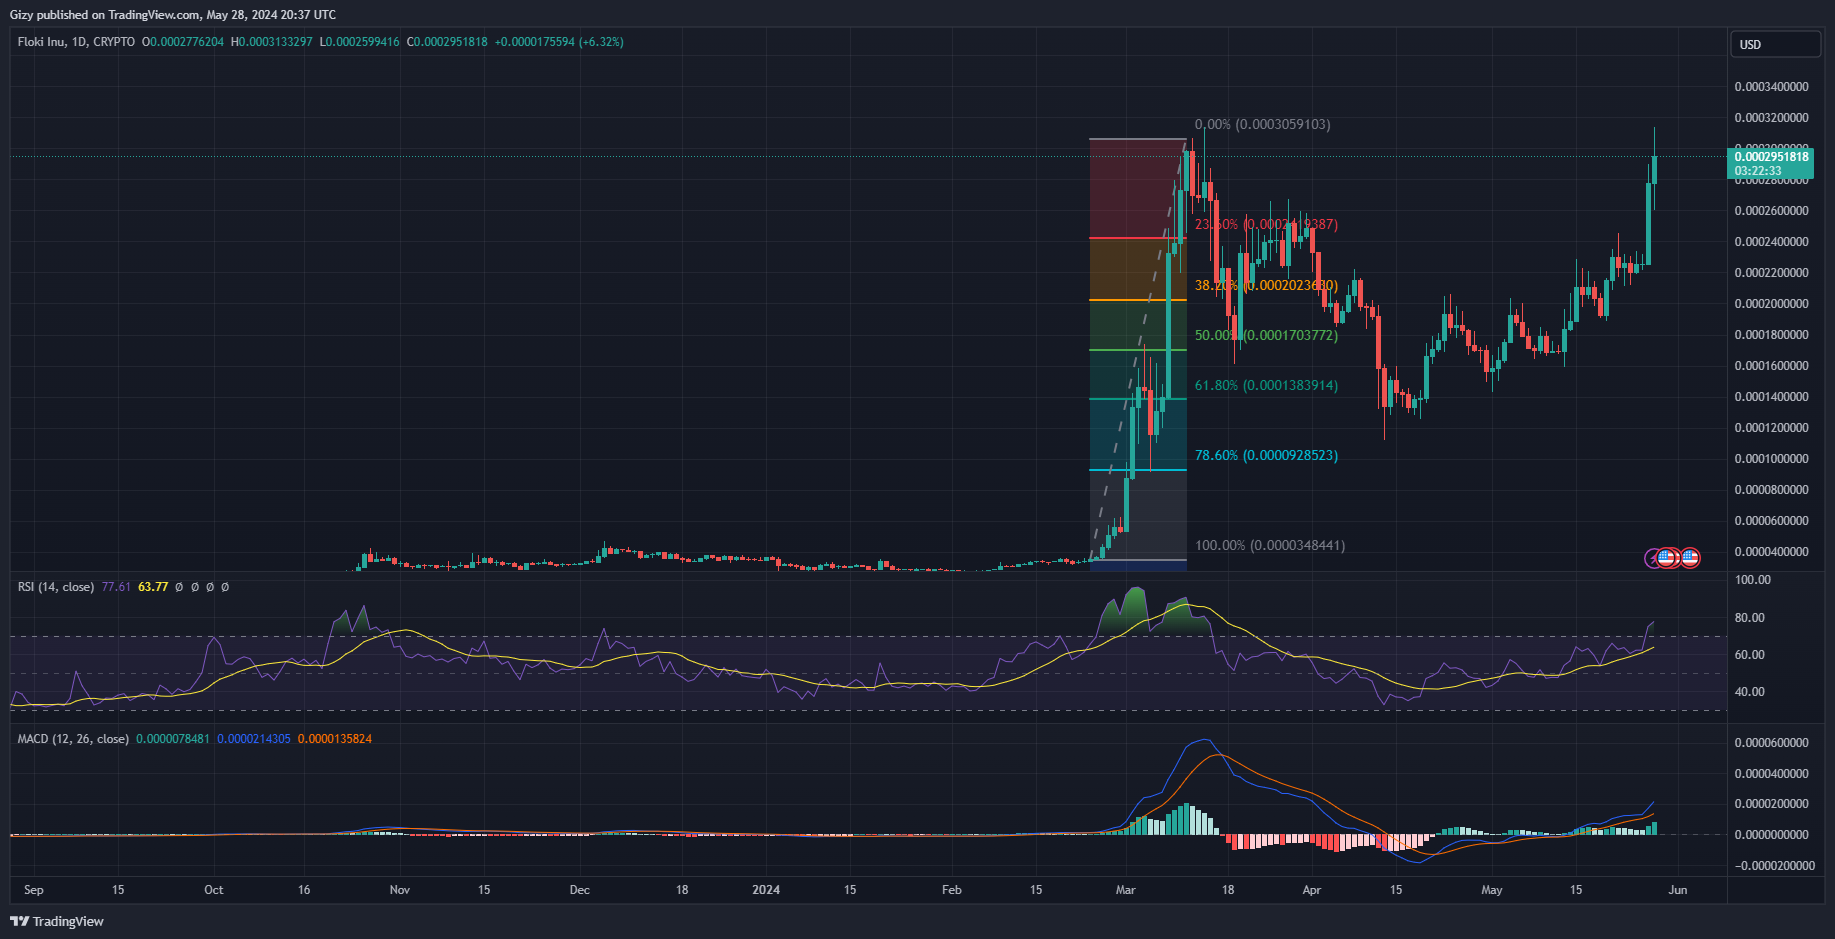
    Floki is up 30% this week, up 16% from the previous week. This comes after it started trading at $0.00019 and peaked at $0.00024.

    The previous intraday session saw volatility return to the altcoin after more than three days of being range-bound. It kicked off the day at $0.00022 and surged to a high of $0.00028. Nonetheless, it ended the day less than its peak but registered gains of over 23%.

    The current price movement suggests that the uptrend is coming to a grinding halt. It surged close to its all-time high but failed to flip it. It faced small corrections and is trading at $0.00029. Nonetheless, the hike comes amidst a decline to $0.00025.

    Currently up by over 5%, the asset is heading to another green close. However, RSI is above 70 which may mean sell signals for many. At 77, the altcoin is under consideration is overbought and further corrections are incoming.

    Nonetheless, the moving average convergence divergence is silent. The 12-day EMA is still on the uptrend.

    With the impending downtrend, FLOKI will drop to the 23% Fib level at $0.00024. Further slip may result in a drop below $0.00022. However, the asset may register a new ATH before the decline starts.

    Sei (SEI)


  • Crypto Analysis 24/05: BTC, ETH, BNB, SOL, XRP, DOGE, TON

    Crypto Analysis 24/05: BTC, ETH, BNB, SOL, XRP, DOGE, TON

    ETH has been the center of attention in the last seven days. Following several months of uncertainty, the US Security and Exchange Commission finally approved a spot ETF.

    In the days leading up to the approval, the regulators quelled the uncertainties by contacting filers to update their request, increasing odds from 25% to 75%. The market responded with massive surges as several assets reclaimed their 2024 highs. It also gained almost 5% in 24 hours.

    Ethereum products like PEPE and FLOKI  surged to their peak as the first registered a new all-time high. Aside from these ETH products, BONK gained a whopping 20% as it surged past its two-month high.

    The past seven days were some of the most profitable for the crypto market. Let’s see how the top 10s performed

    BTC/USD

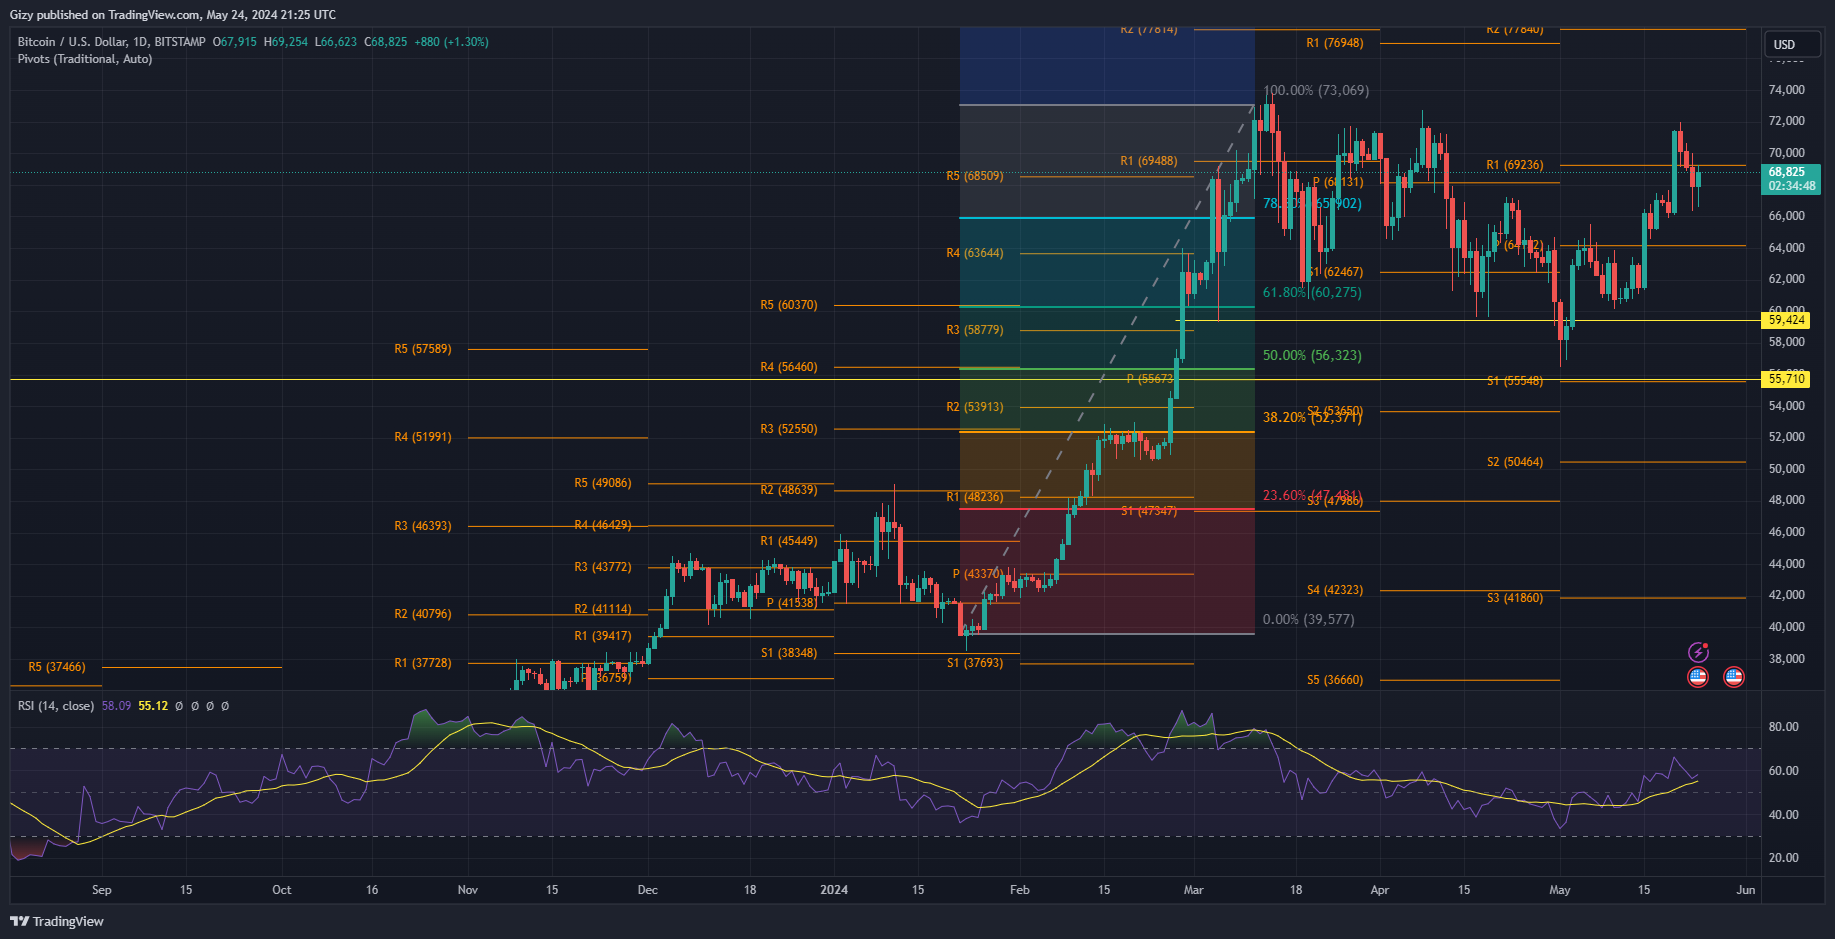
    Bitcoin is up by over 2% in the last seven days. The apex coin is experiencing significant downtrends the massive surge it had on May 20. It peaked at $71,500 after starting the day at $66,255. It also ended the session with gains exceeding 7%.

    Currently printing green candle, this is the first such cand as it registered significant declines over the last three days. During this period, the coin lost almost 5% as it gradually lost levels it attained during the previous hike. It dropped to the lowest mark on May 23 as it rebounded at $66,600.

    A few hours ago, the asset dropped to this level again. Nonetheless, as with the previous day, it rebounded and is edging towards $69k.

    The $67k mark is losing its value as many analysts previously predicted that it was critical for an attempt at $70k. However, the $66k support has remained instrumental in maintaining the momentum to retest the highlighted resistance.

    The Fibonacci retracement points to the continuation of the two-day trend as the highlighted support is close to the 78% Fib level. This means there is notable demand concentration there.

    Nonetheless, BTC is trading at $68,921, which shows it is edging towards its first pivot resistance at $69,200. A decisive flip will see the cryptocurrency surge above $70k before the week ends.

    ETH/USD

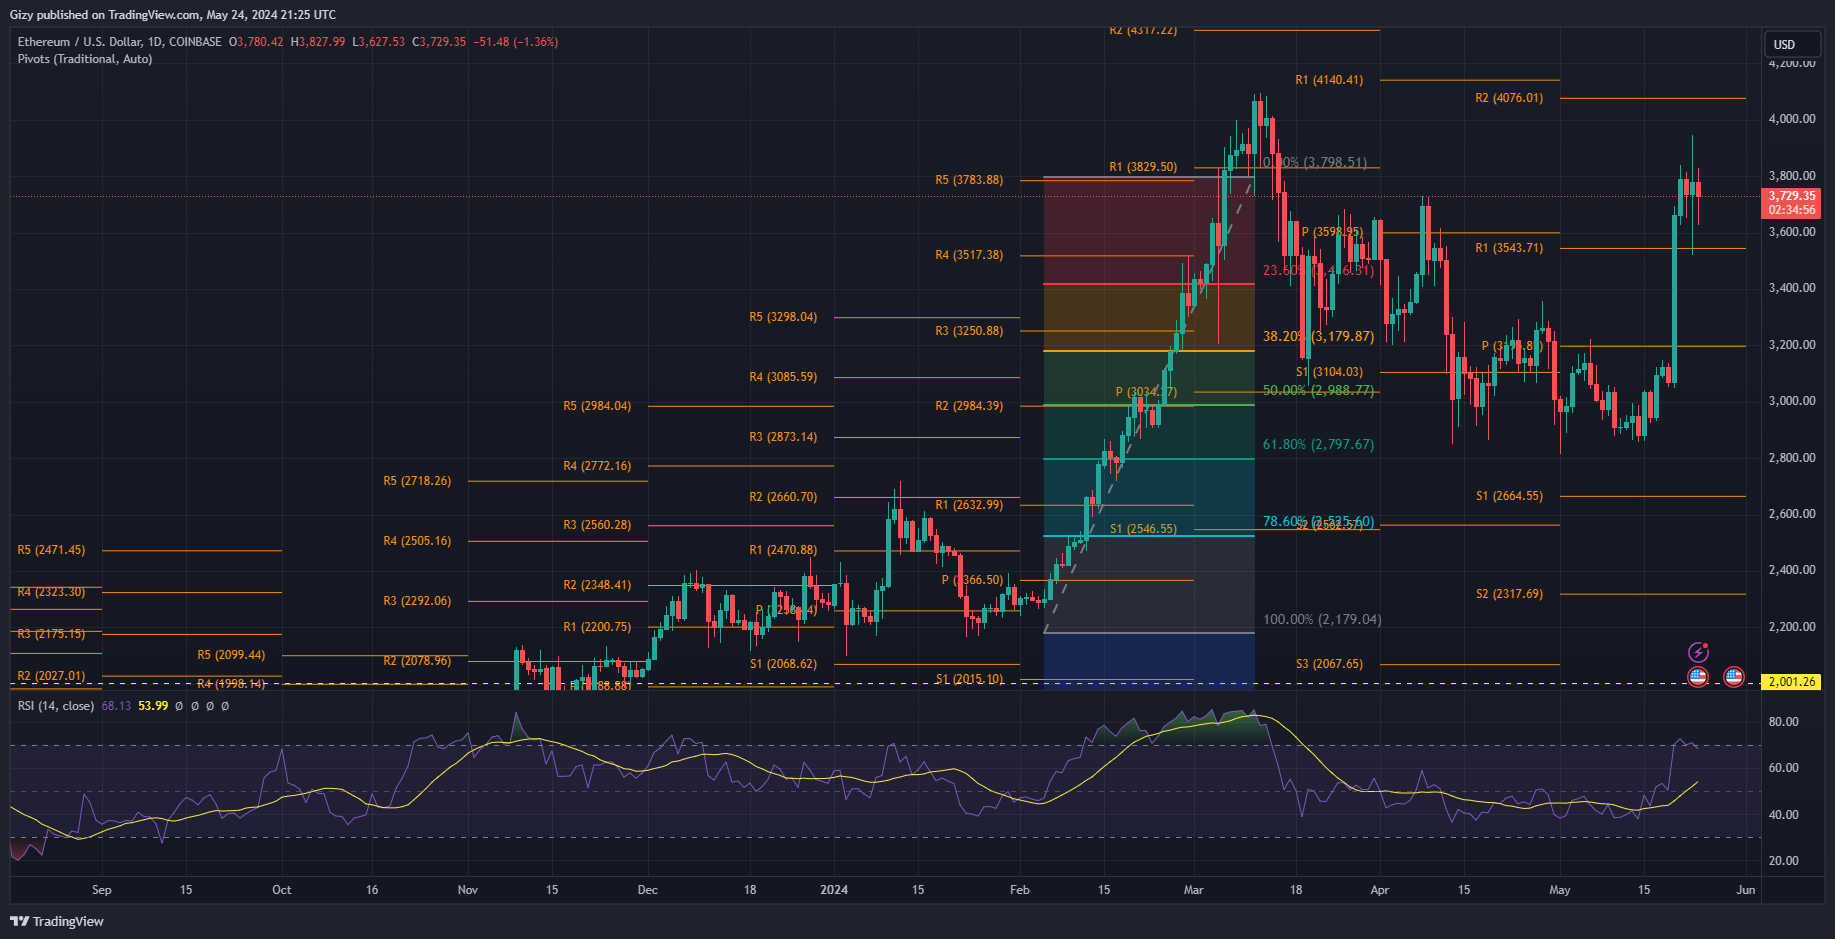
    May 20 saw Ethereum attempt its 2024 high. In a massive surge, it gained a whopping 19% as it climbed from $3,070 to a high of $3,695. During the rally, it climbed above several pivot levels. One such is the pivot point, which served as resistance for over fourteen days before the hike. The first pivot resistance is another critical level that broke.

    Since climbing above these levels, the coin has maintained trading above them. Nonetheless, during the previous intraday session, it slipped below them. Following its failed attempt at $k, it dropped to $3,521 and peaked at $3,947.

    Currently printing a red candle, the asset is recovering from a drop to $3,700 and is yet to fully achieve this bid. However, the most recent trend is the opposite of what many expected, as the ETH ETF got its approval during the previous intraday session. The surges they anticipated never came as the altcoin is struggling to gain stability above $3,800.

    Nonetheless, the relative strength index suggests further price declines. At 68, it is falling below 70 for the first time in almost four days. This will mean a drop below $3,500 may take place in the coming days.

    BNB/USD

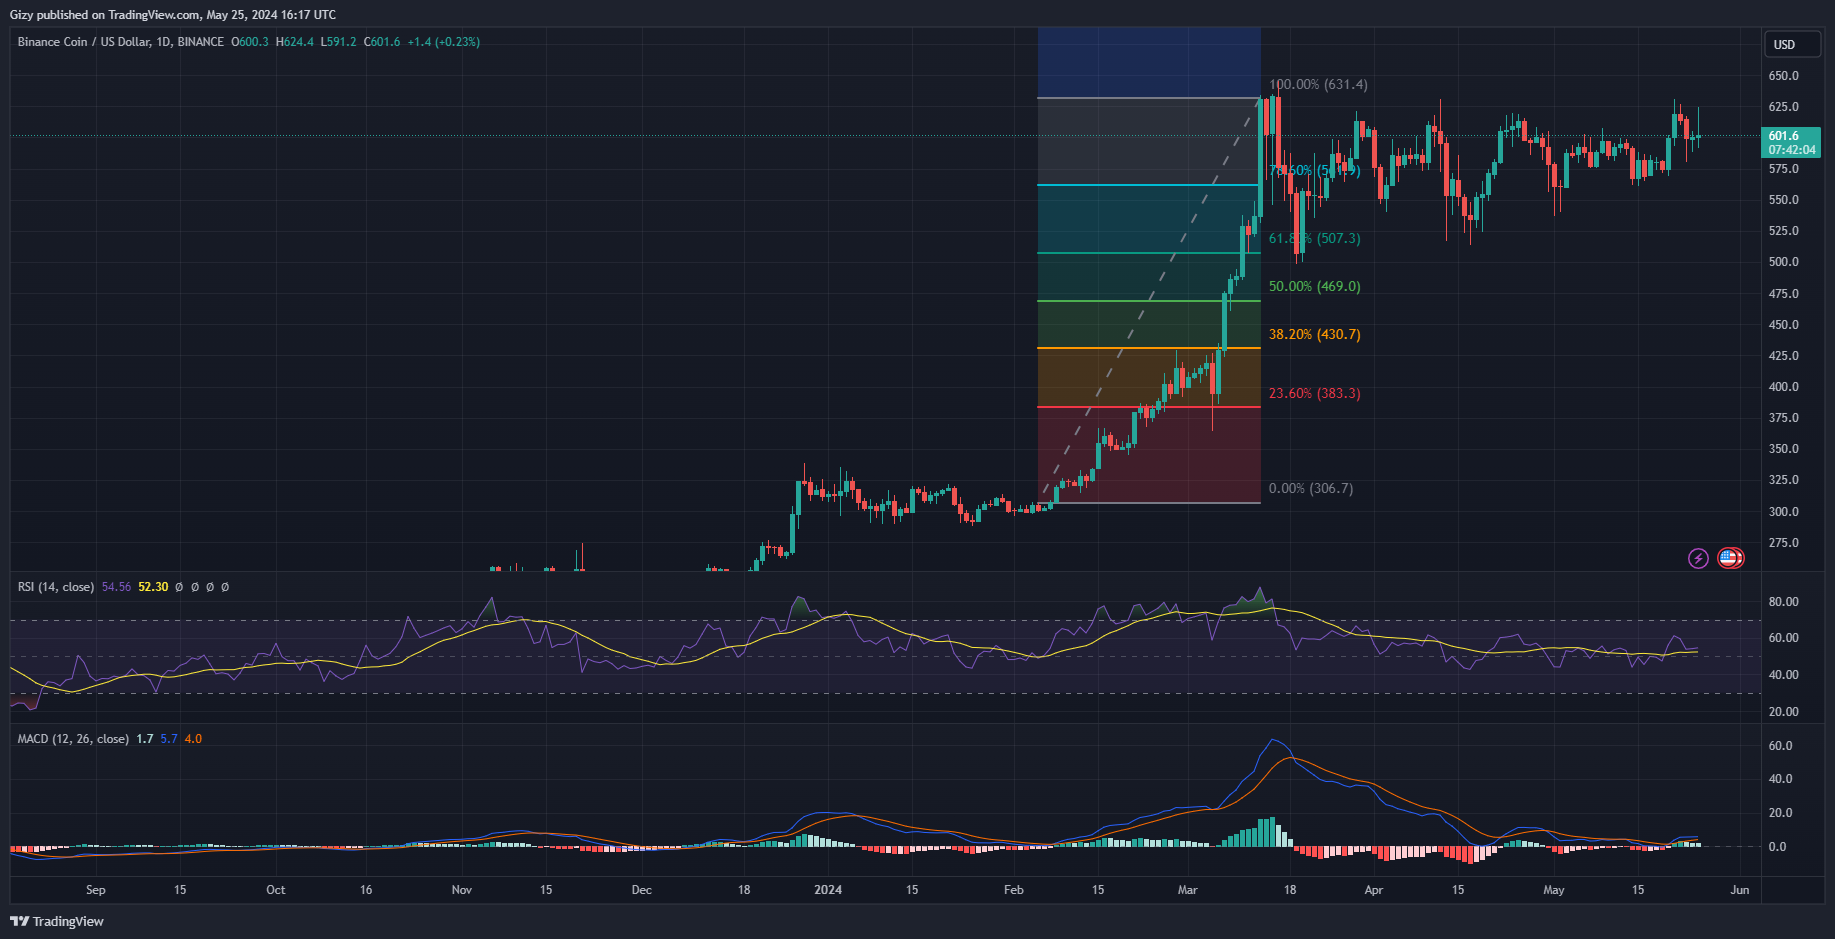
    Binance coin is on the downtrend and has yet to recover. Nonetheless, May 20 and 21 were some of the most bullish periods of the last seven days. It gained over 7% as it peaked at $631 after bouncing off its pivot point at $574.

    It edged close to retesting this level during the previous intraday session. It dropped to a low of $580 but recovered and closed at $599, recording losses of over 2%. It is currently printing a doji as the bulls attempt to halt the downtrend it experienced during the last two days.

    Nonetheless, price movements suggest a retest of the pivot point in the coming days. This comes as price movements remain flat in the past 24 hours. Additionally, the relative strength index halted its descent and is currently trending in an almost straight line. This illustrated an equal pressure between the buying and selling pressure.

    The 12-day EMA is also moving in the same pattern as RSI. Additionally, the 26-day EMA is on an uptrend which suggests an impending bearish convergence if the trend continues. This may lead to BNB retesting its 50-day exponential moving average.

    SOL/USD

    The current candle shows that Solana bulls are staging a buyback. However, it appears unsuccessful as it has yet to register any significant price improvement. As a result, it is printing a doji. Additionally, RSI halted its decline in response to the latest attempt.

    The most recent price movement is an improvement from the last four days as the asset will likely register its first green. The previous intraday session was the worst of the period as it registered one of its biggest dips. It lost almost 5% as it retraced to a low of $162.

    The move brought it close to breaking the $160 support and testing the 50-day EMA at $157. Nonetheless, RSI points to the possible reasons for the latest decline. A few days ago, the metric surged to 70 which meant it was seeing maximum buying pressure. Further uptrends would make the asset overbought. It also meant that the asset was due for corrections.

    The moving average convergence divergence indicates further downtrends. The 12-day EMA is on the decline and will intercept the 26-day EMA in bearish convergence. This will mean a drop below the 50-day  EMA is almost inevitable.

    Currently trading close to the 23% Fib level, it will lose the mark. The next critical level to watch is the 38% Fib mark at $140.

    XRP/USD

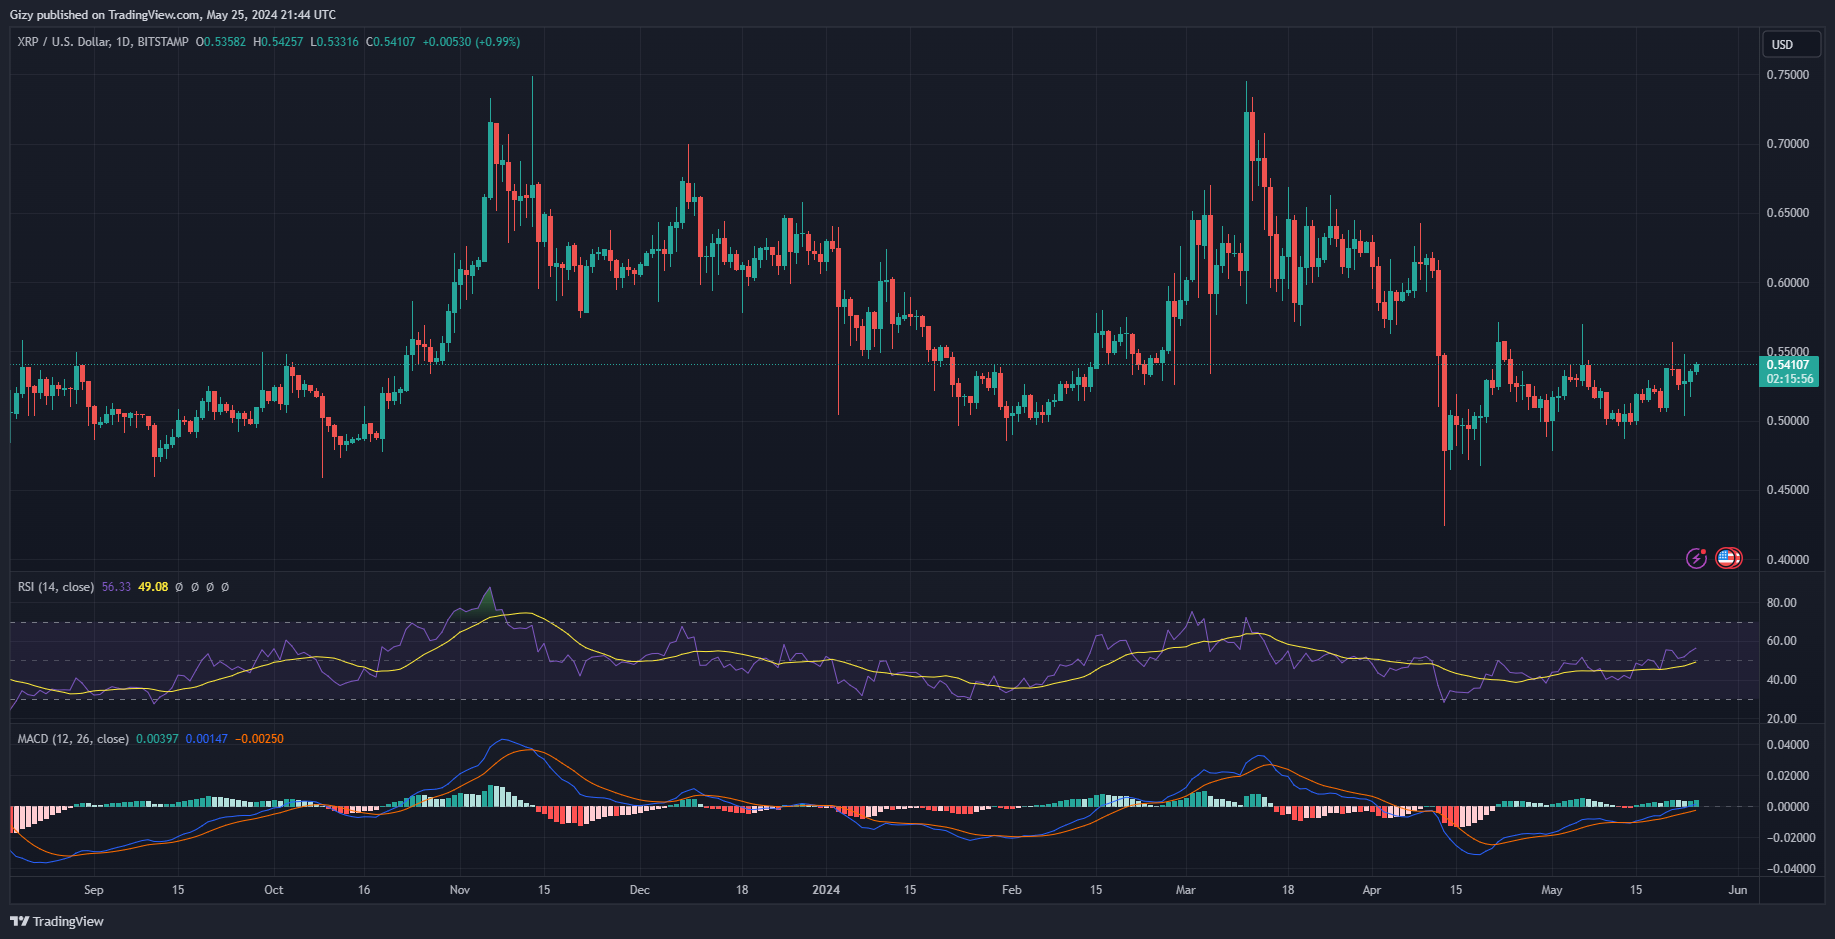
    XRP is looking to continue its growing uptrend.  A green close on May 25 will mark the third consecutive day with minute price improvement. Currently displaying one of the tiniest candles on the chart, the asset is holding on to $0.53.

    Nonetheless, since May 2, it has struggled to keep prices above $0.52. It enjoyed surges that saw it close with gains of more than 5%. It is worth noting that two days ago, the coin retraced to retest the $0.50 support but rebounded.

    The current price trajectory suggests that the asset will test $0.55 if the uptrend continues. It will continue to hold on to the pivot point at $0.52.

    The relative strength index is at 55 which places the bulls at an advantage. Additionally, it is on an uptrend which indicates growing buying pressure. Nonetheless, the accumulation and distribution chart suggests a gradual drop in trading volume.

    Additionally, the moving average convergence divergence is silent following the bullish divergence a week ago. Both the 12-day and 26-day EMA are on the uptrend which tells that XRP is maintaining its bullish posture.

    DOGE/USD

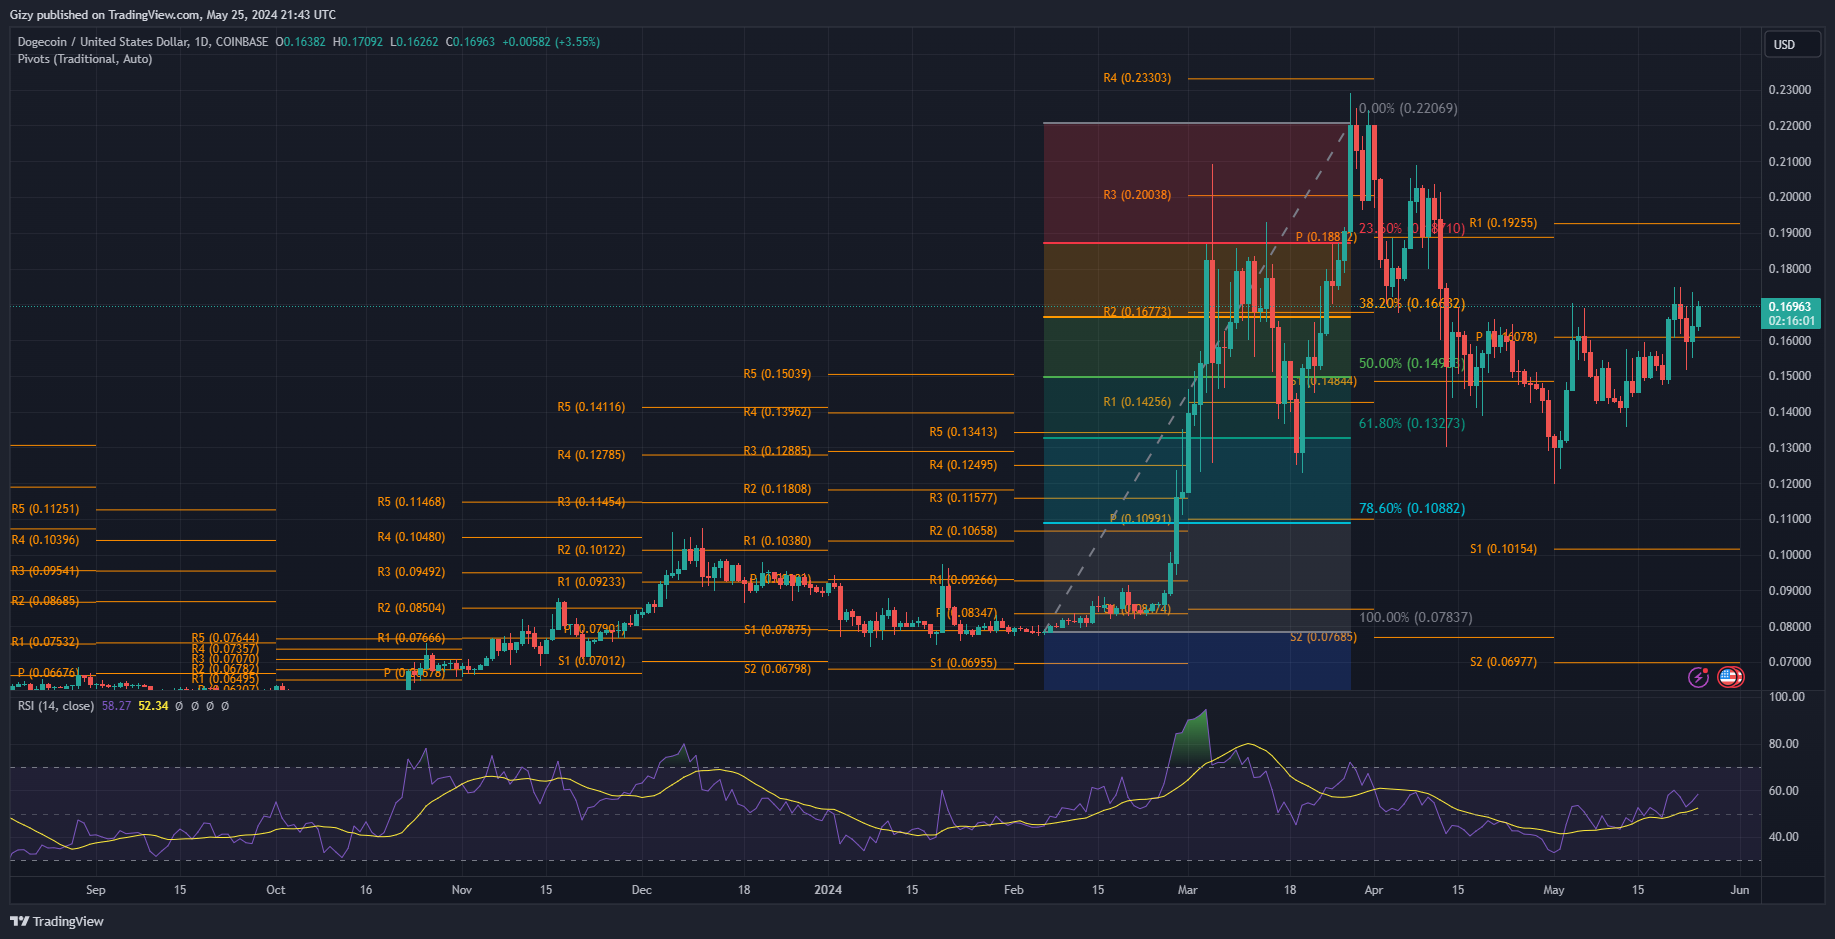
    Dogecoin is seeing significant price changes at the time of writing. It is up by almost 4% as it edged closer to testing its seven-day high.

    The most recent hike is a continuation of the previous day’s surge. It peaked at $0.173 and retraced to a low of $0.155. Nonetheless, it closed with gains of almost 3%. The current day’s increase confirms the coin’s U-turn from its downtrend.

    RSI resumed its uptrend following the increase in buying volume. The change comes amidst the massive decline in trading volume. The volume dropped by 53% in the last 24 hours. Currently at 58, the bulls are at an advantage.

    Nonetheless, MACD is also on the uptrend. It continues its buy signals as the 12-day and the 26-day EMA are still on the uptrend. The gap between the two metrics grew wider in response to the previous 48-hour trend.

    Currently trading above the 38% Fibonacci retracement level at $0.166, the bulls will look to defend the mark and continue the uptrend. The mark is close to the pivot point. However, a change in market trajectory could send the token as low as low as the 50% Fib level at $0.15