On May 28, Mt. Gox moved over $9 billion worth of Bitcoin, causing the top coin and other assets to register significant price declines.
The news of such a move in anticipation of a selloff also affected the global cryptocurrency market cap. It failed to register any significant changes in the last 24 hours. Nonetheless, a closer look at the chart suggests a gradual decline in the market cap.
Aside from the small decline some cryptocurrencies experienced during the current intraday session, the question of how the crypto market will perform in the coming days arises.
Top Five Cryptocurrencies to Watch
Bitcoin (BTC)
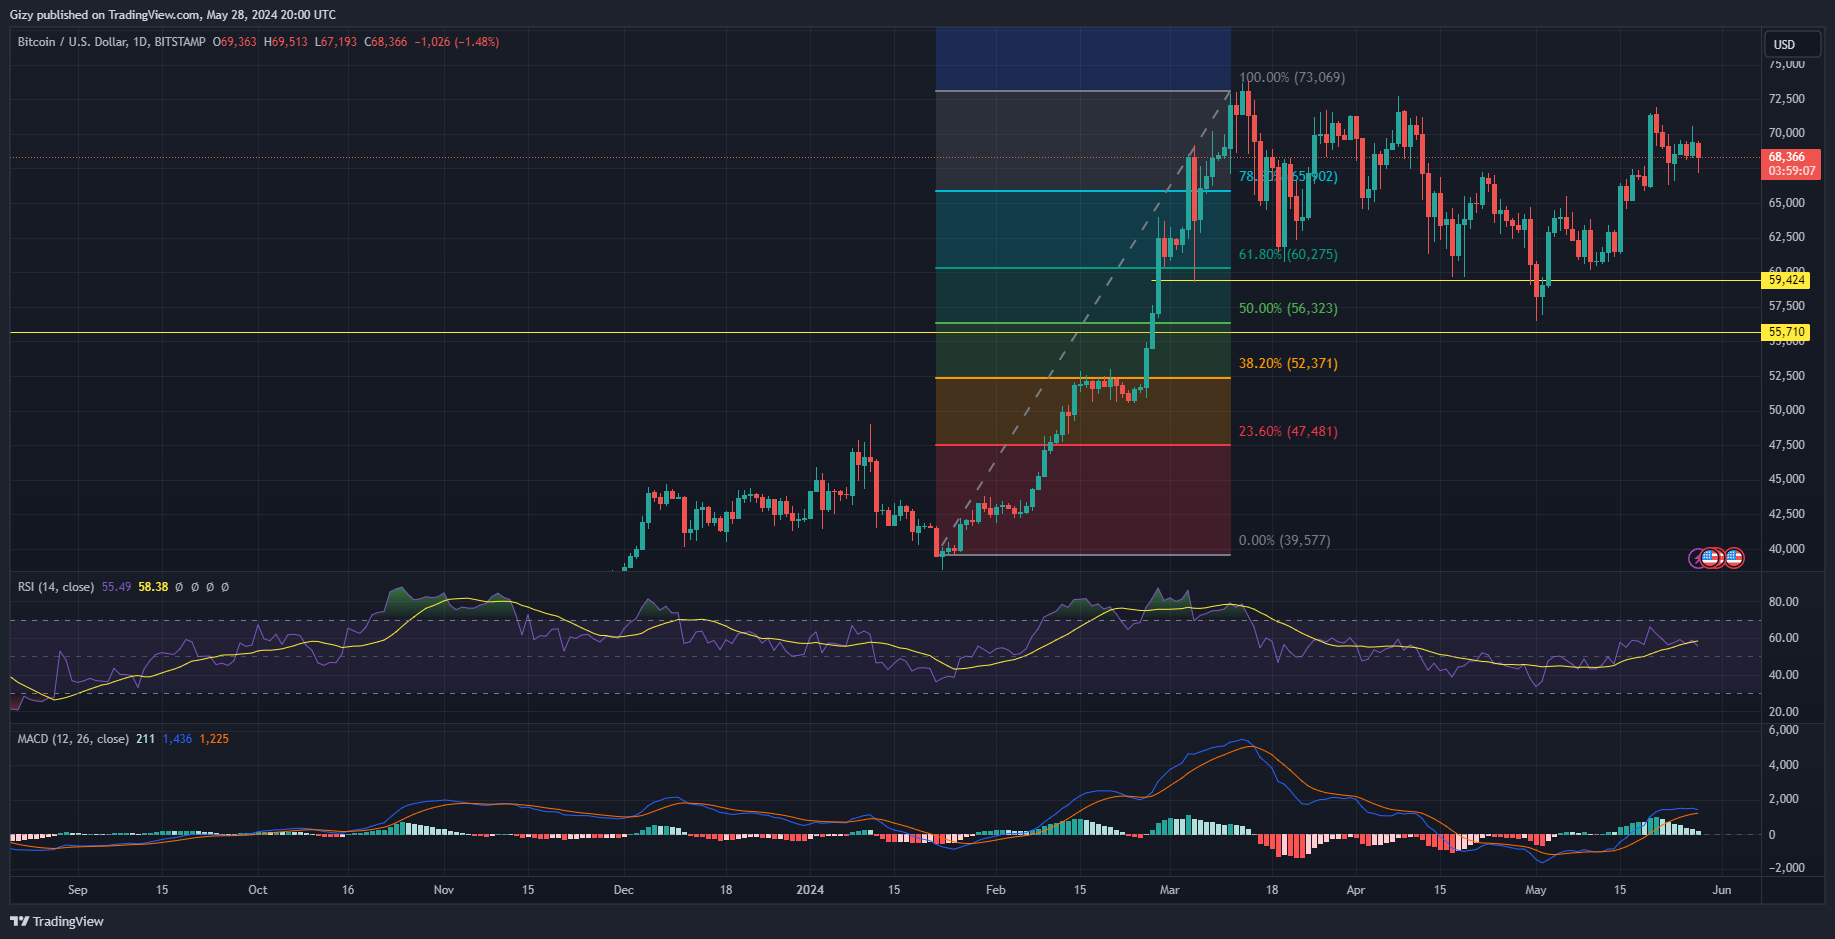
Bitcoin is currently experiencing an over 2% decline at the time of writing. It was the worst-hit asset in the top 10 as the negative fundamental was centered around it. It has dropped to a low of $67,100 and is struggling to keep prices above $68k.

The most recent trend is the opposite of what transpired during the previous intraday session. BTC was mostly bullish as it climbed above $70k after more than four days below it. However, the stay above the mark was shortlived as it faced massive rejections at $70,600.
In the last five days, price action has been range-bound as the coin failed to decisively flip the first pivot resistance. During the period under consideration, it tested the mark consecutively, faced rejections, and lost momentum.
BTC’s latest low indicates that the asset is edging close to testing the pivot point at $64,100. In response to the most recent trend, the relative strength index is also on the decline. It dropped 54, which still places the bulls at an advantage.
Nonetheless, the bears may seize the initiative as the moving average convergence divergence is displaying sell signals. The 12-day EMA is close to intercepting the 26-day EMA. With the bearish convergence almost complete, the divergence will take place.
A continuation of the most recent dip will expedite the process, and the apex coin may drop as low as $64k before recovery.
Dogwifhat (WIF)
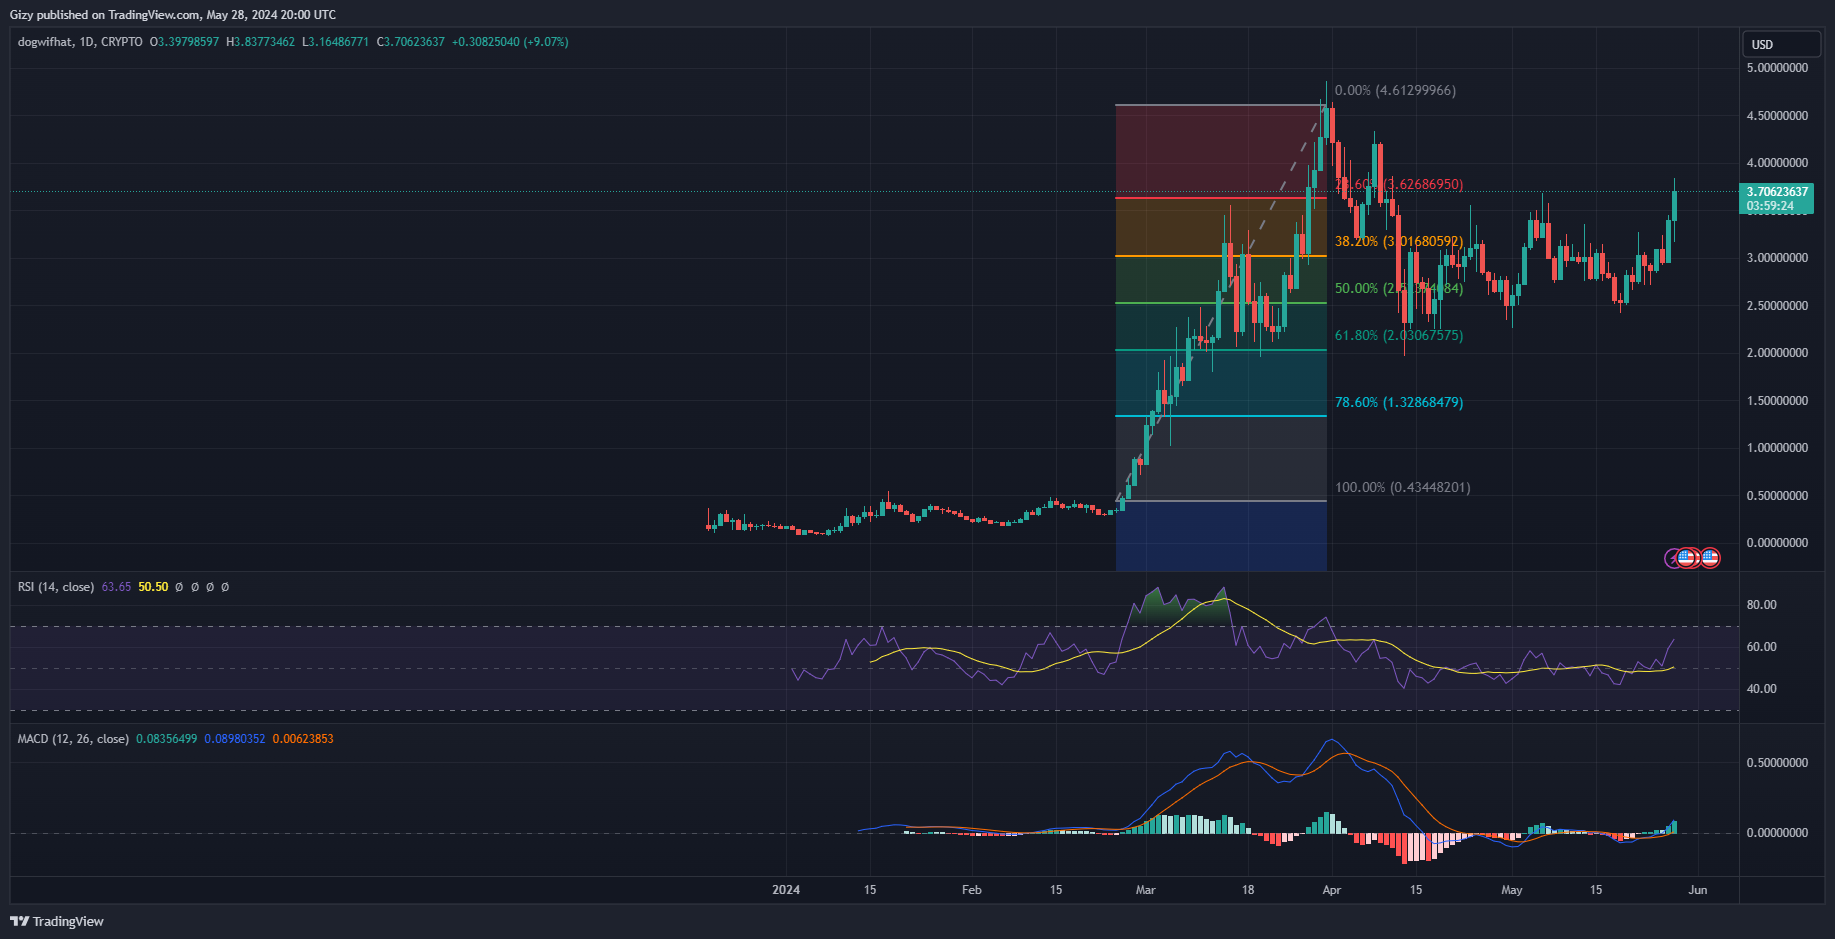
WIF is experiencing more bullish actions than prevalent sentiment. It edged closer to testing the first pivot resistance but faced major rejections at $3.83. Nonetheless, it dropped to a low of $3.16 a few hours ago before rebounding.

The most recent surge continues the previous day’s bullish trend. It peaked at $3.44 after kicking off at $2.95. It also ended the period with gains exceeding 15%. Following the hike, it decisively flipped its pivot point.
With the continuation of the uptrend, the token is edging close to testing the next pivot level at $4.10. Currently up by 9%, the RSI is on the uptrend in reaction to the massive increase in buying volume. WIF saw a more than 60% increase in trading volume in the last 24 hours. The metric is at 63, which points to room for more price hikes.
The current price $3.70, is above the 23% Fibonacci retracement level. This means it may form a new support around the mark due to the demand concentration present.
MACD is printing no new signals, which may indicate the continuation of the uptrend. The bulls will look to close the week above the first pivot resistance.
Stacks (STX)
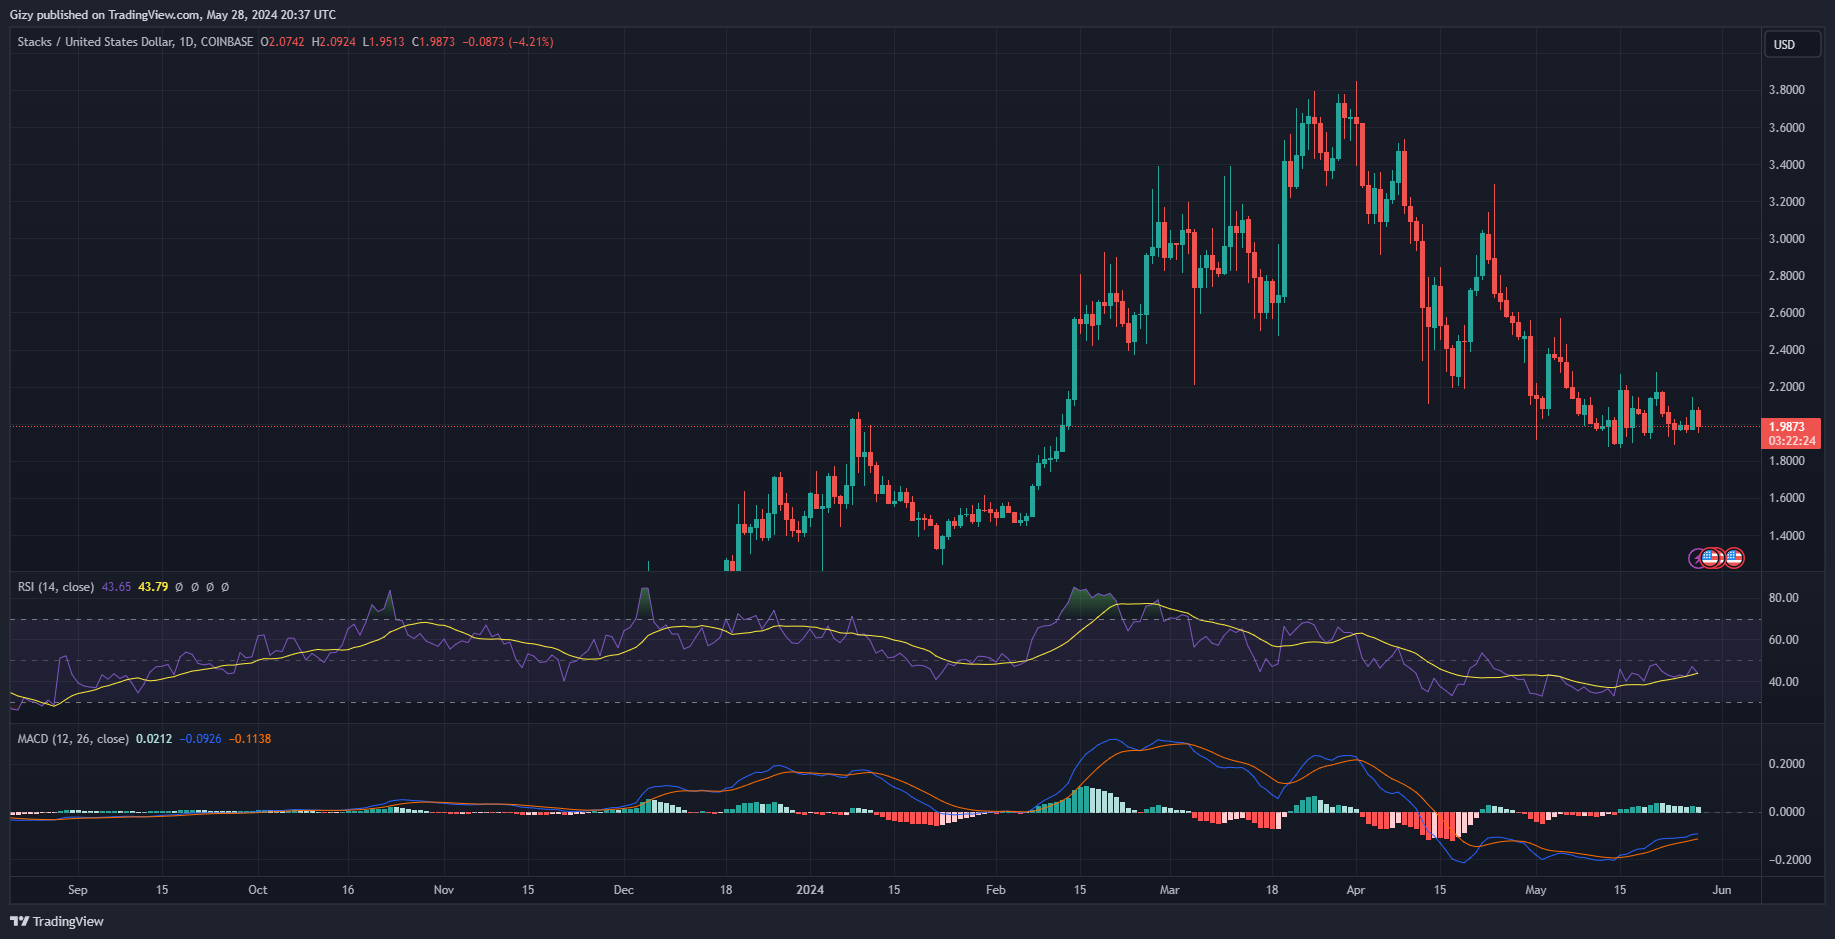
Stacks is gradually picking up volatility after over four days of reduced movement. However, the last 48 hours were marked with both ups and downs. For example, the previous intraday session saw the asset gain over 5% as it peaked at $2.14. However, it is losing more than half the gains it accumulated during the previous day.

Trading at a loss of more than 4%, STX may be gearing up for another decline. Currently trading at $1.98, it briefly lost the $2 support.
The relative strength index points to a notable increase in selling pressure as the culprit of the most recent decline. This comes amidst the over 30% increase in trading volume it saw in the last 24 hours. the metric is at 43 due to this trend.
MACD is still on the uptrend but will print a sell signal if the bulls fail to stage a buyback. The histogram accompanying the indicator has been almost equal over the last five days. However, if the price decline persists, the 12-day EMA will start a downtrend and intercept the 26-day EMA this week.
Stacks will retest $1.80. It remains to be seen if it will rebound at this mark. On the other hand, the bulls may stage a buyback and send the asset above $2.10.
Floki inu (FLOKI)
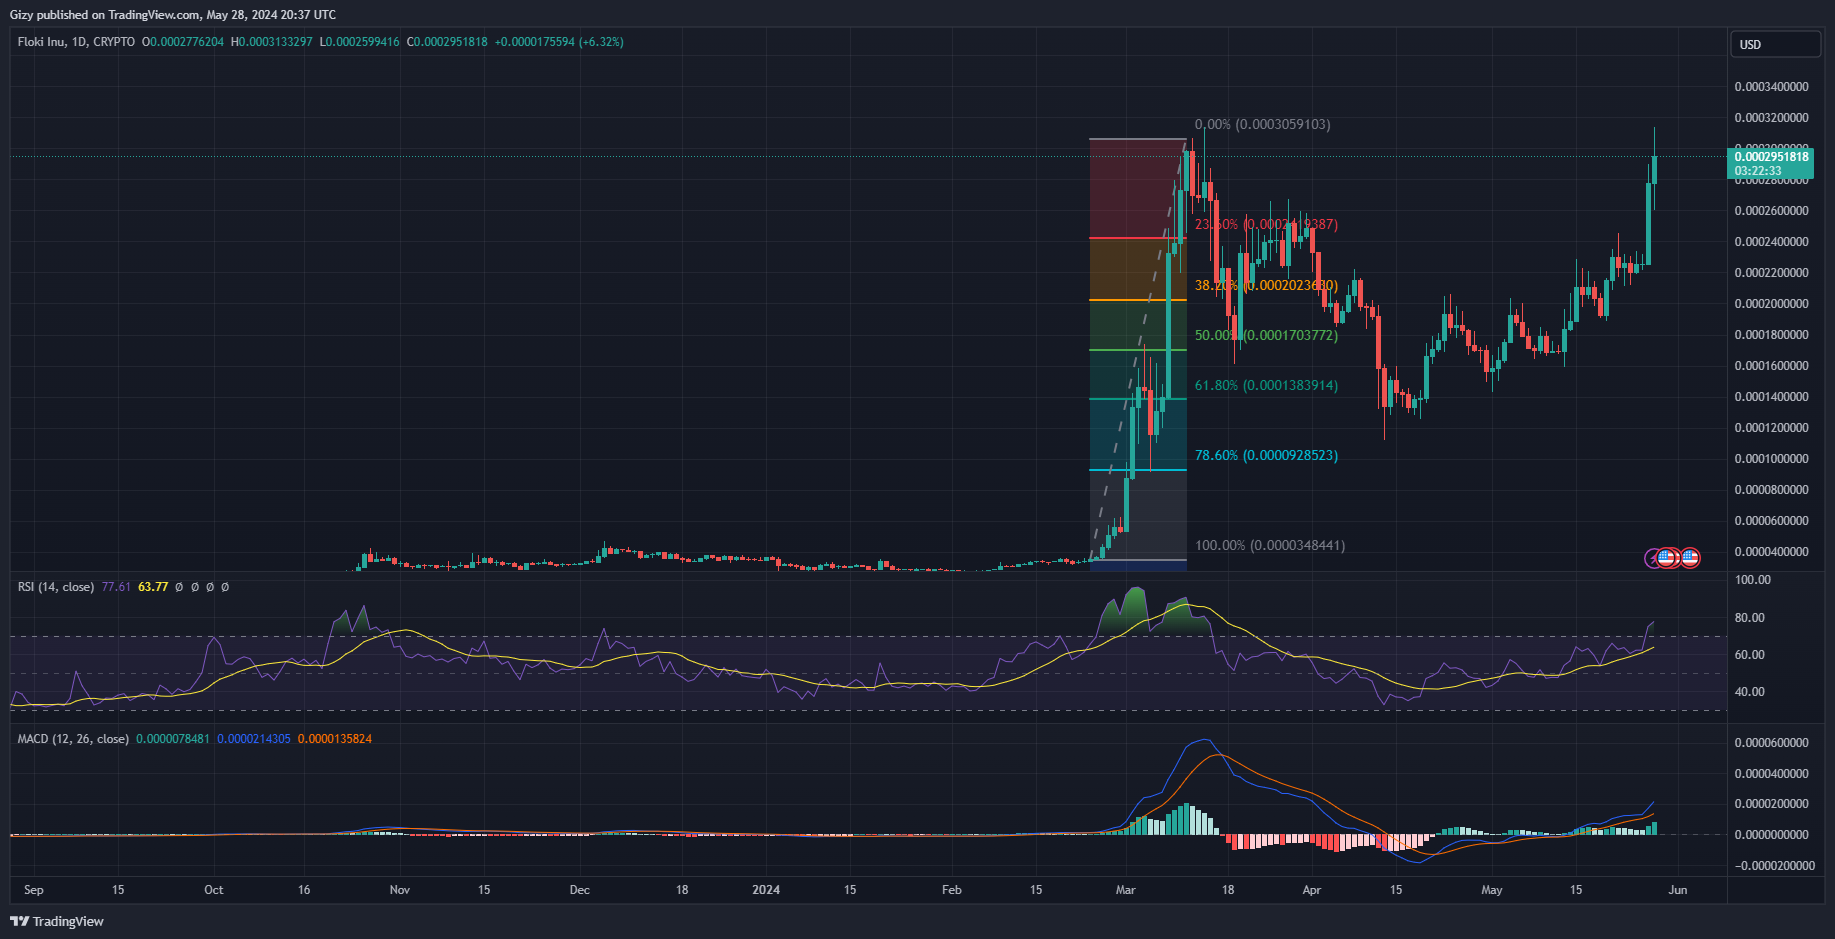
Floki is up 30% this week, up 16% from the previous week. This comes after it started trading at $0.00019 and peaked at $0.00024.

The previous intraday session saw volatility return to the altcoin after more than three days of being range-bound. It kicked off the day at $0.00022 and surged to a high of $0.00028. Nonetheless, it ended the day less than its peak but registered gains of over 23%.
The current price movement suggests that the uptrend is coming to a grinding halt. It surged close to its all-time high but failed to flip it. It faced small corrections and is trading at $0.00029. Nonetheless, the hike comes amidst a decline to $0.00025.
Currently up by over 5%, the asset is heading to another green close. However, RSI is above 70 which may mean sell signals for many. At 77, the altcoin is under consideration is overbought and further corrections are incoming.
Nonetheless, the moving average convergence divergence is silent. The 12-day EMA is still on the uptrend.
With the impending downtrend, FLOKI will drop to the 23% Fib level at $0.00024. Further slip may result in a drop below $0.00022. However, the asset may register a new ATH before the decline starts.
Sei (SEI)

