Another week comes to an end with no notable changes in the crypto market. It started Monday at $926 billion. Several cryptocurrencies failed to surge and experienced intense selling pressure.
As a result, the global cryptocurrency market cap retraced to a low of $729 billion. Nonetheless, it recovered and peaked at $970B as the week progressed. A closer look at the chart several massive dips.
The week is coming to an end with the sector’s valuation at $944 billion. Notably, several assets contributed to the state of the entire industry. The top gainer over the last seven days is Casper.
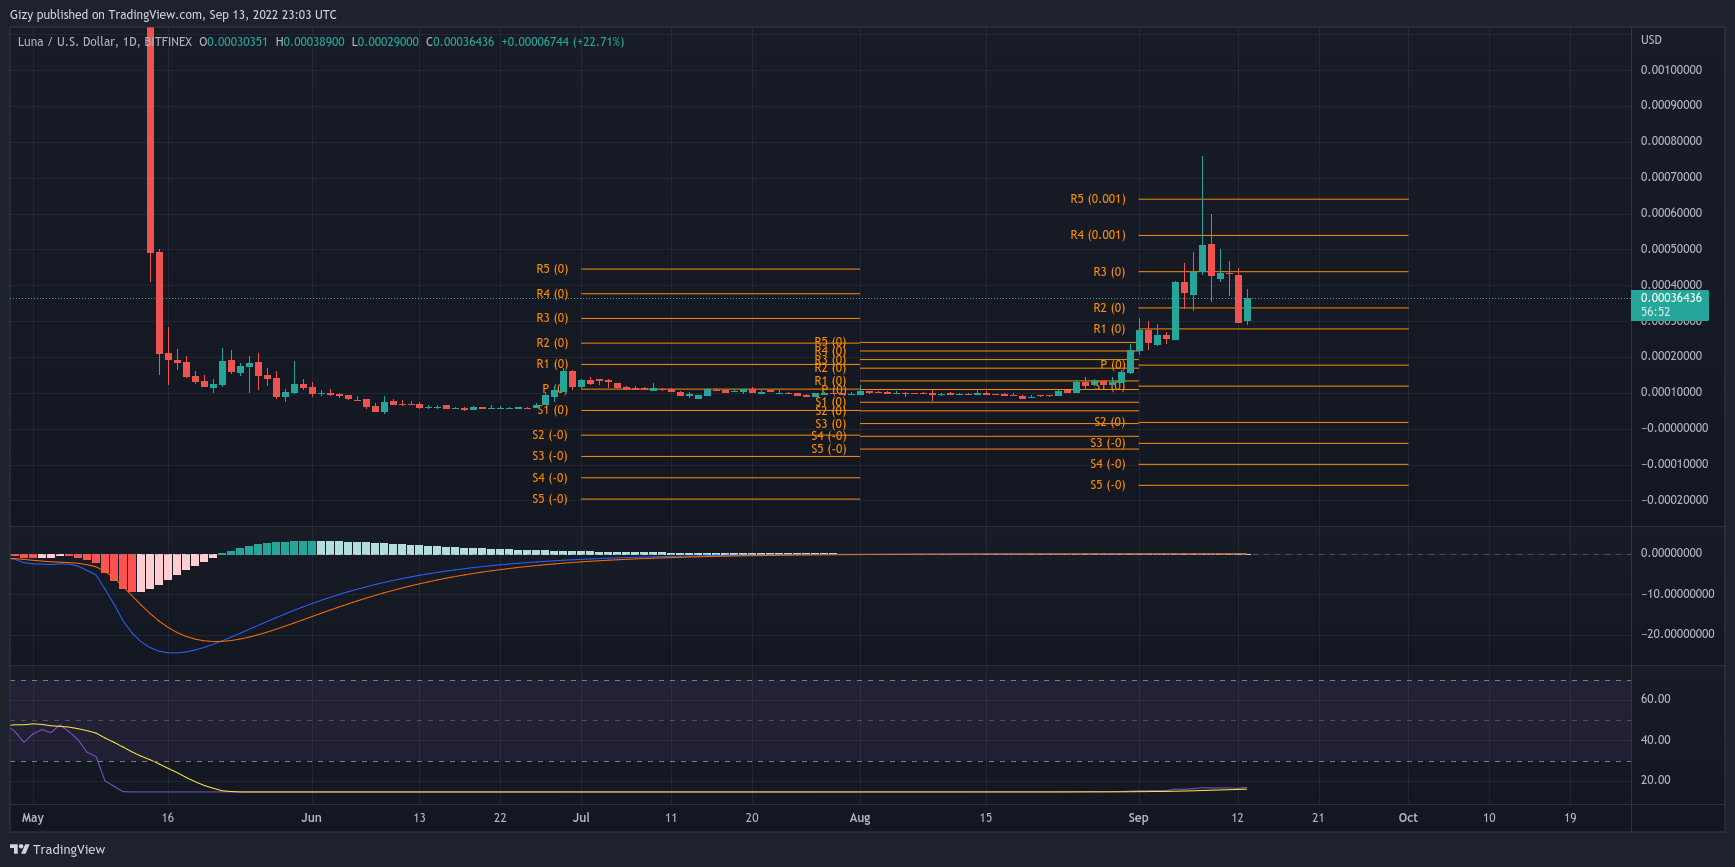
The cryptocurrency may end the intraweek session with gains exceeding 22%. On the other hand, the biggest loser during the period under consideration is Reserve Rights. The token is currently down by 19%.
Terra Classic ranks second with losses exceeding 9%. On the part of fundamentals, it is safe to conclude there were no massive stories. Nonetheless, Dogecoin get a massive push from Elon Musk’s renewed interest in Twitter.
Another news that shocked many was that Binance was hacked. The hackers charted away $570 million in crypto and are still unknown as no group claimed responsibility for the attack. What does the new week hold?
Top Five Cryptocurrencies to Watch
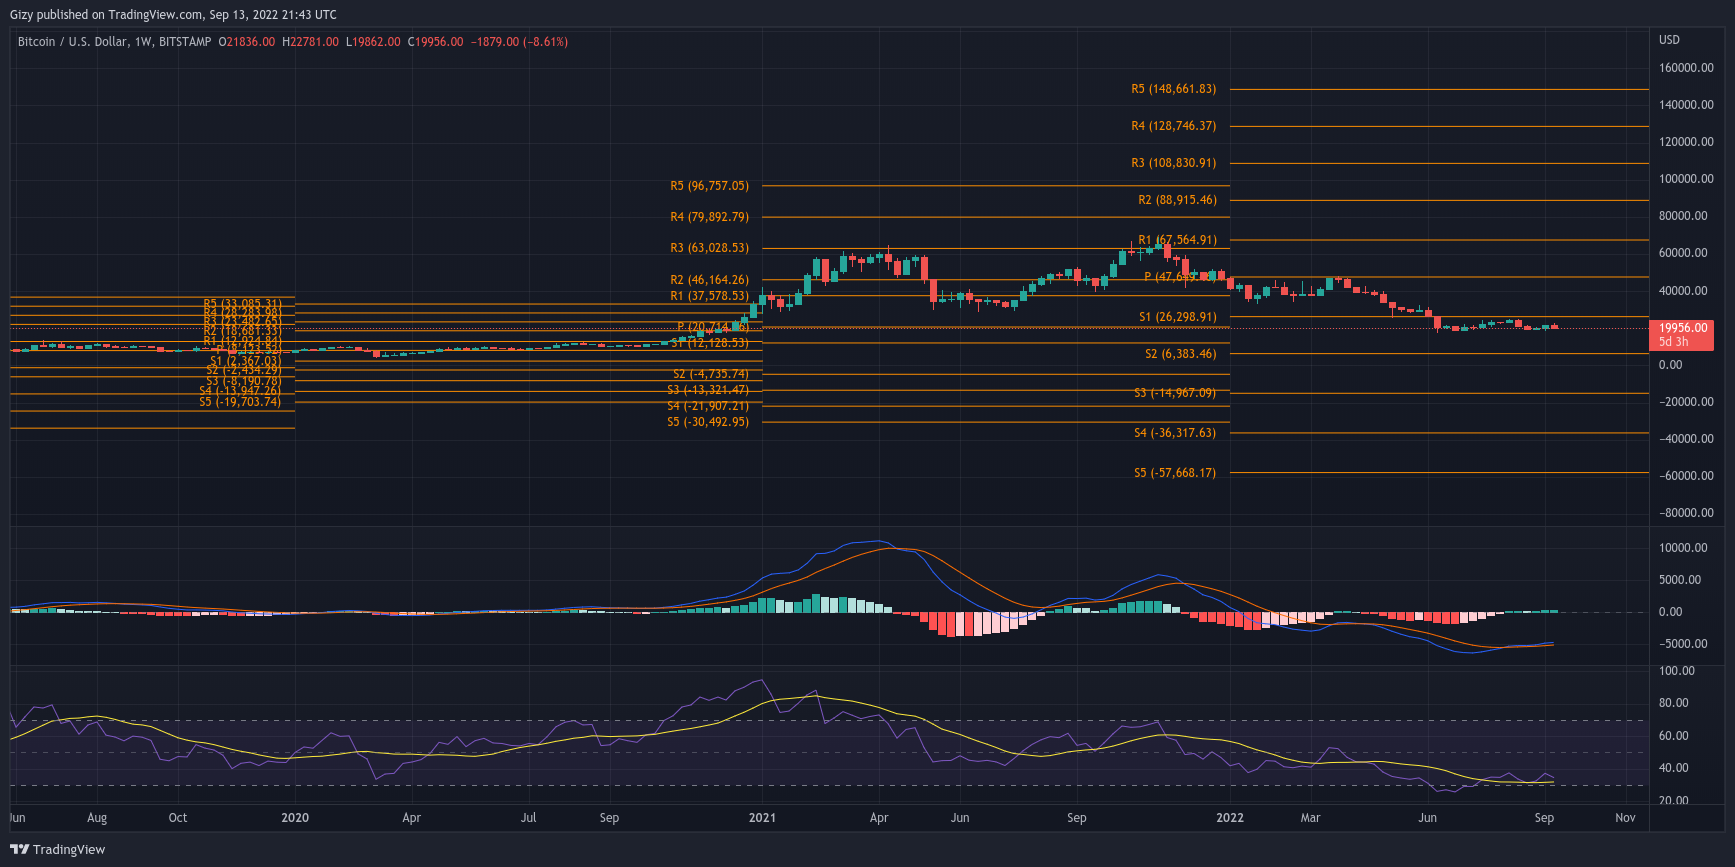
Bitcoin had a series of low volatility days during the previous week. However, this is the exception for Monday and Tuesday. We observed the cryptocurrency recorded notable gains during this period.
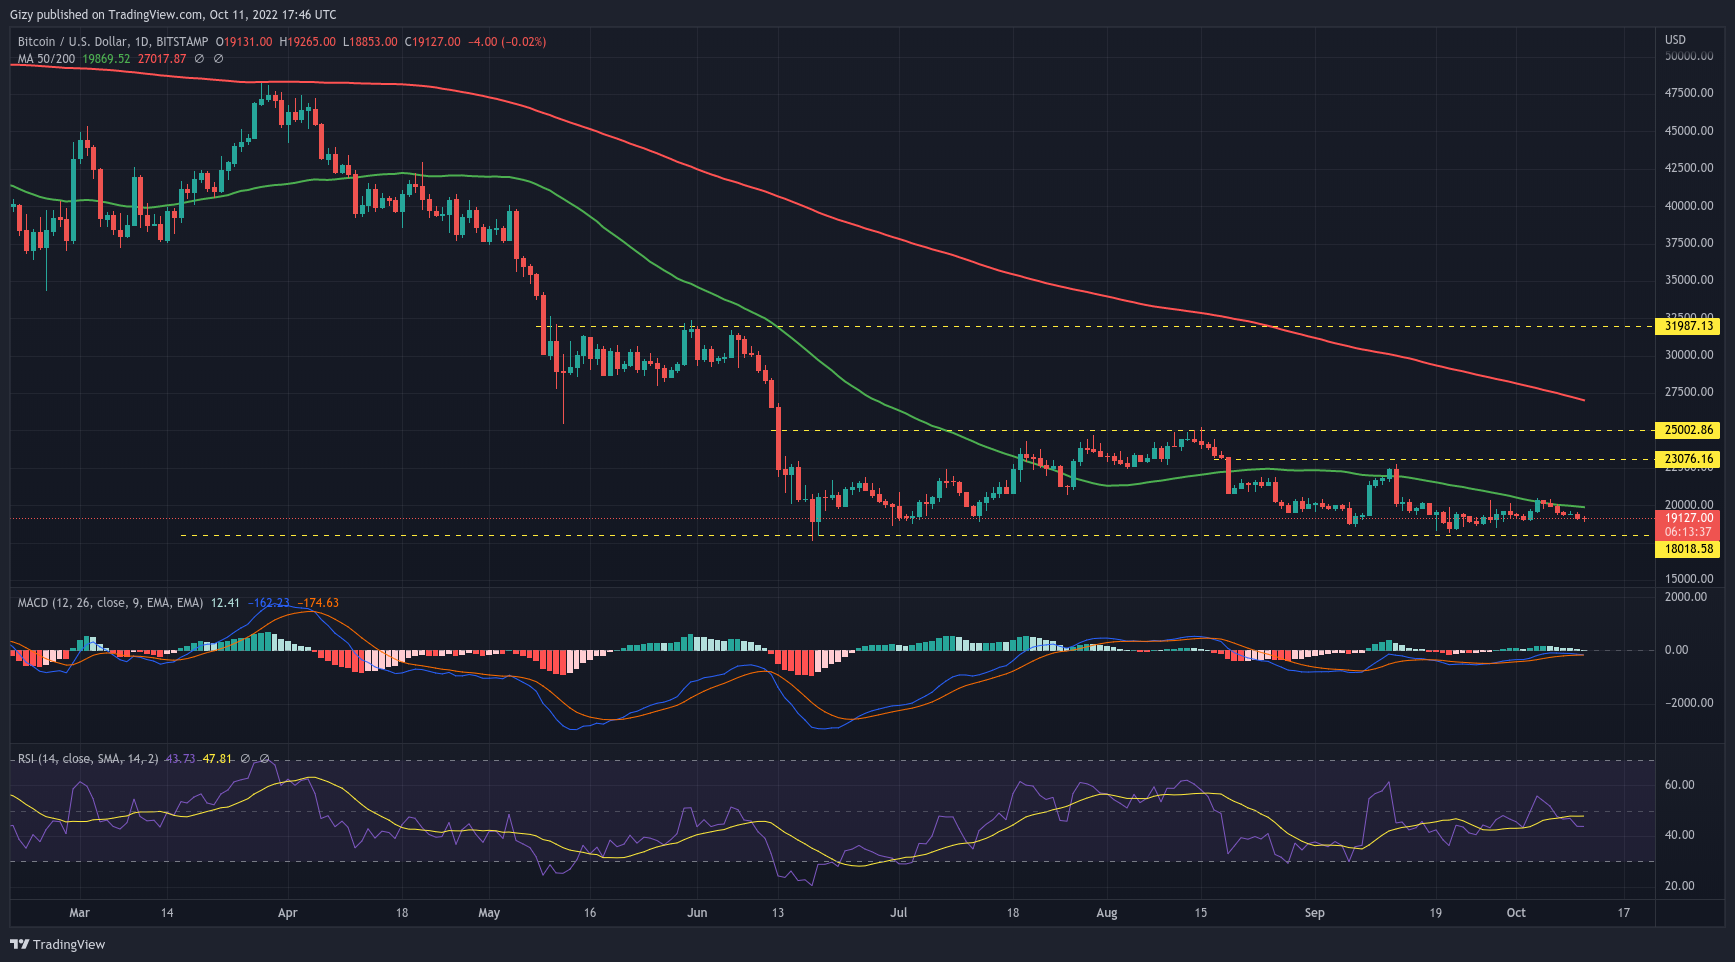
For example, the first day of the week ended with a positive change of more than 3%. The next day also ended with an almost equal margin. Following days of consistent uptrends, the bears responded.
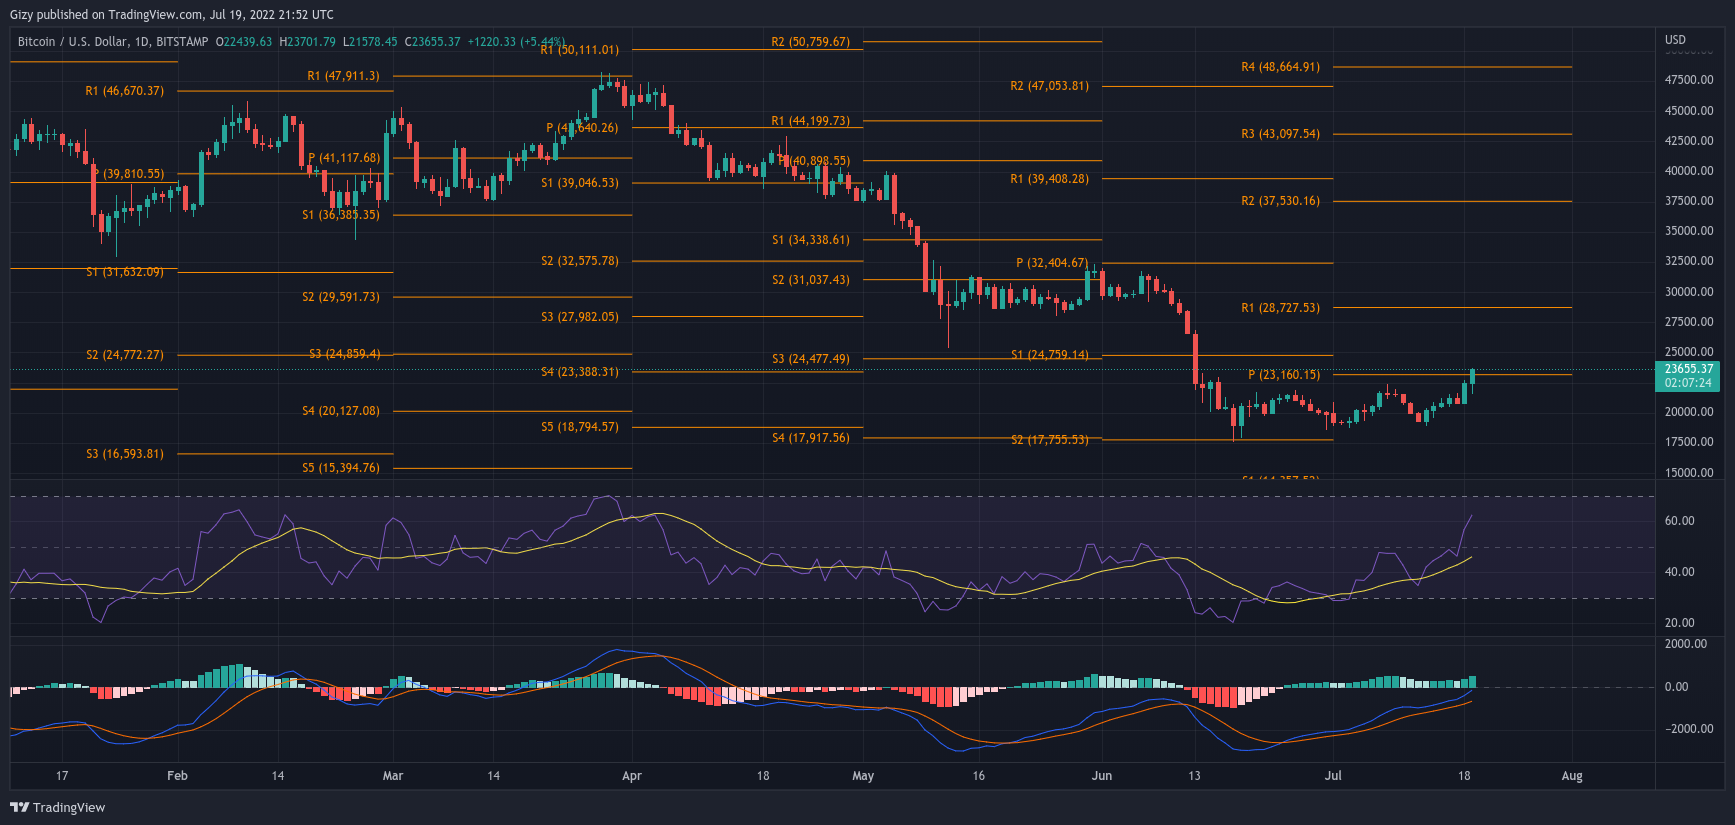
The next four days were marked with red candles. On the last day of the week, the apex coin has little or no volatility. A closer look at the daily chart displays the entire picture as we observed a tiny line representing that intraday session.
On the part of the indicator, there were no massive movements. However, the top coin briefly flipped the 50-day Moving Average. MACD also ended the period under consideration with a bearish convergence.
Such a phenomenon is a clear indication that BTC will experience more downtrends. We are seeing this prediction come true as the apex coin is down by a few percent yesterday. Interestingly, there is no change in sight.
The asset is also seeing small losses and is yet to pick up momentum. To this effect, we may expect little downtrends over the next few days. We observed that the $18k support held out last week, it may do the same during the current intraweek session.
Due to the most recent state of the market, a bearish divergence is imminent. It had to predict the extent to which the selling pressure would hit BTC. Nonetheless, once the coin picks up momentum, it may return above $20k before the current seven-day period ends.
It is also worth noting that the Relative Strength Index is at 43. It may dip below 30 if current market conditions persist.
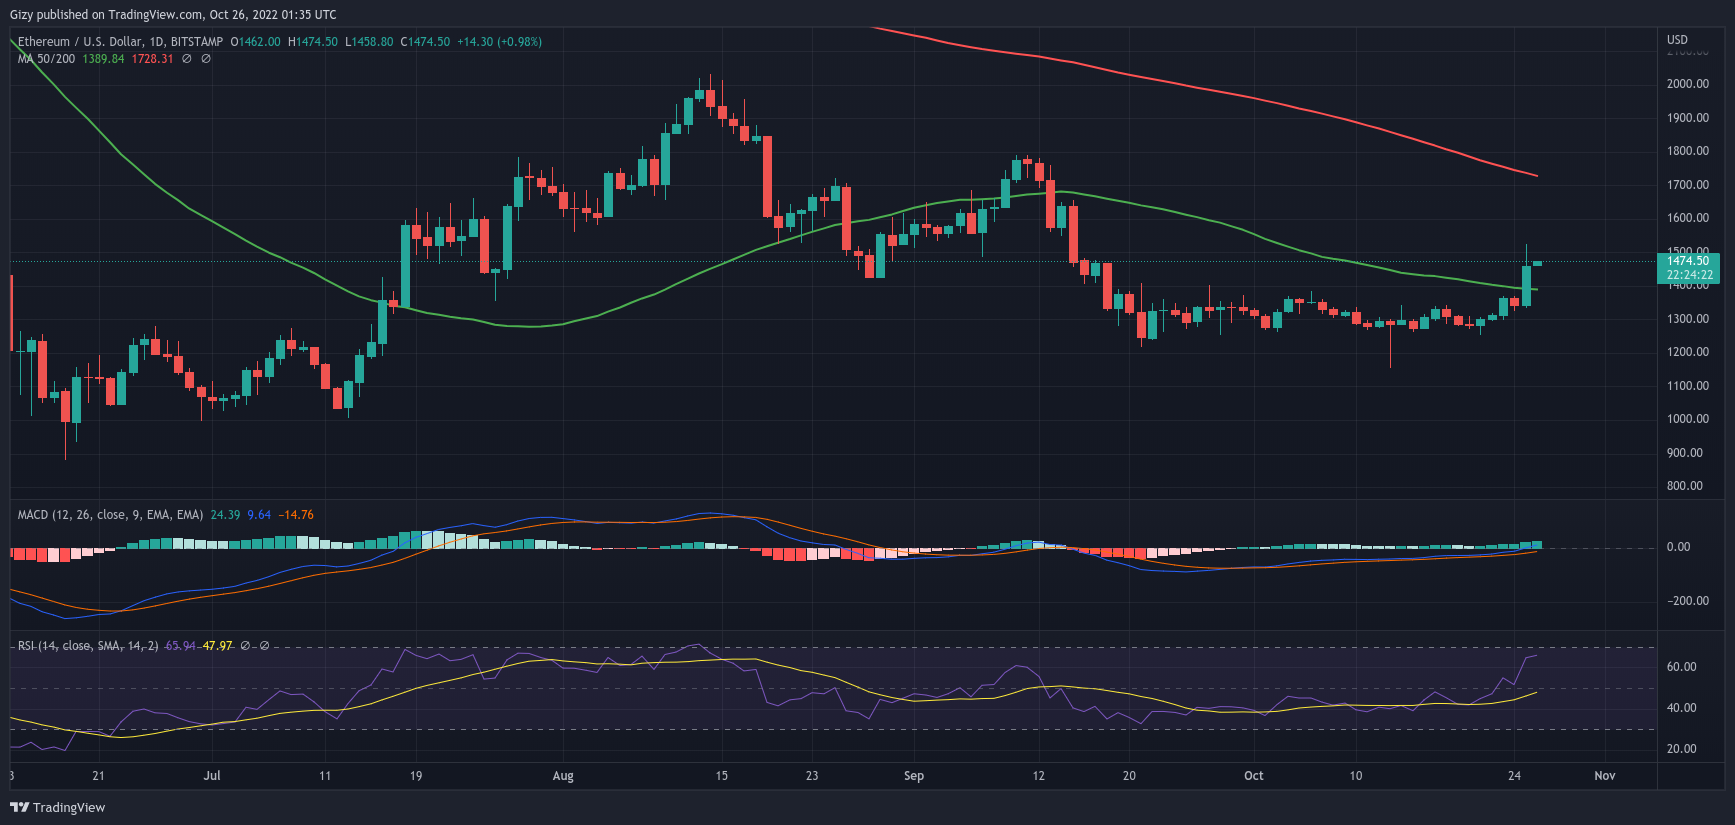
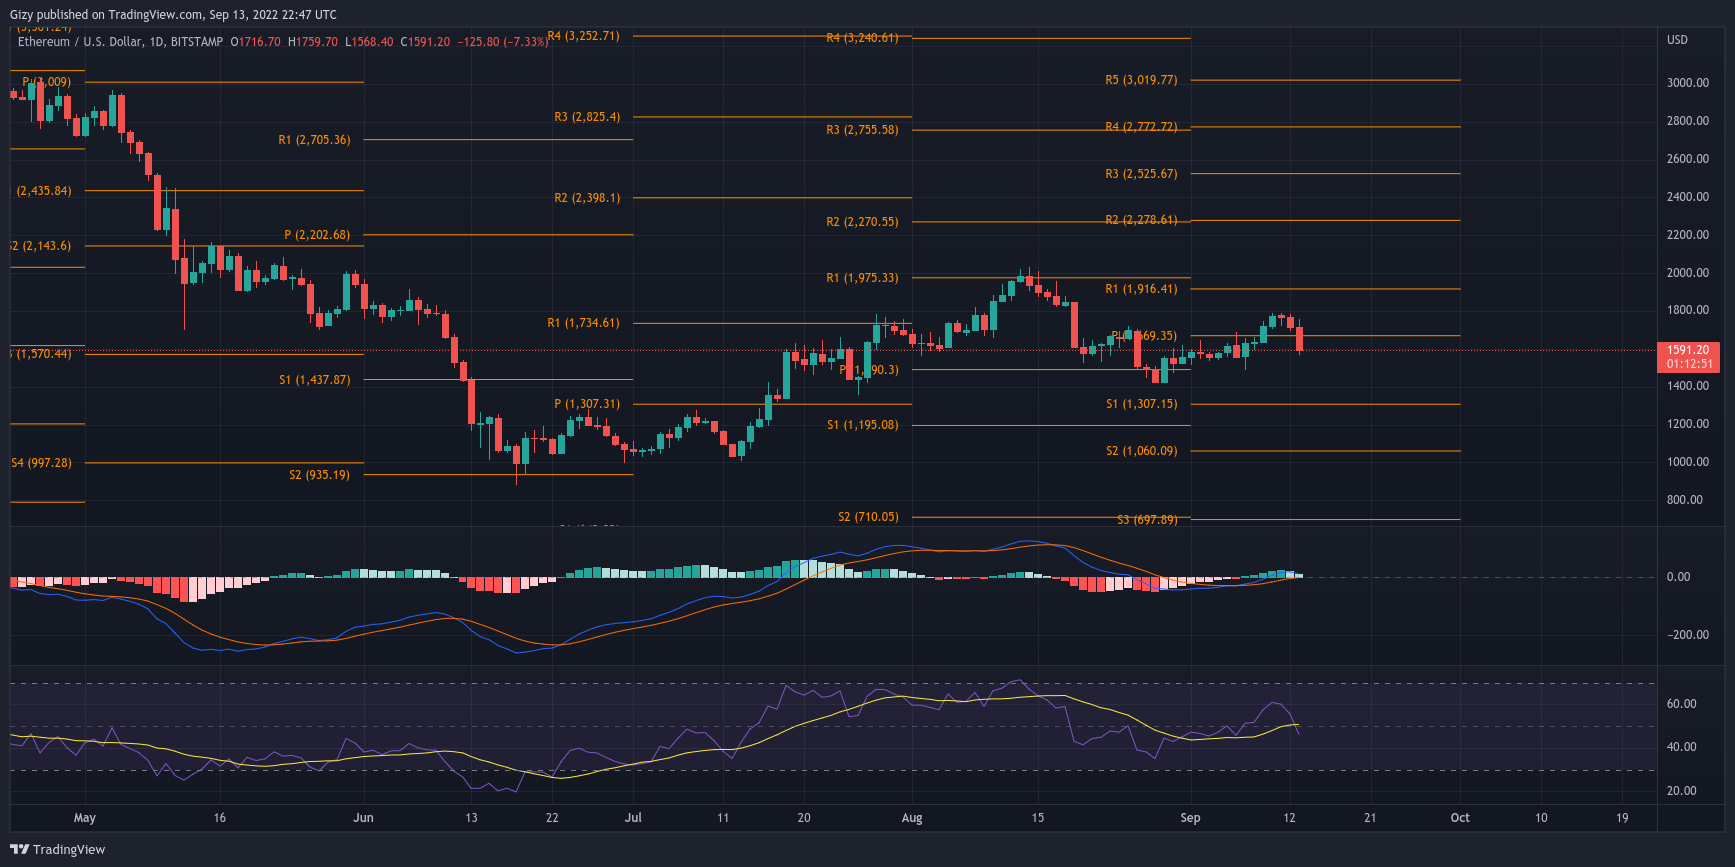
Ethereum also had a volatility-filled week. Price’s actions during this period were intriguing as the bearish moments outweighed the bullish ones. However, in the end, the largest altcoin ended with notable gains.
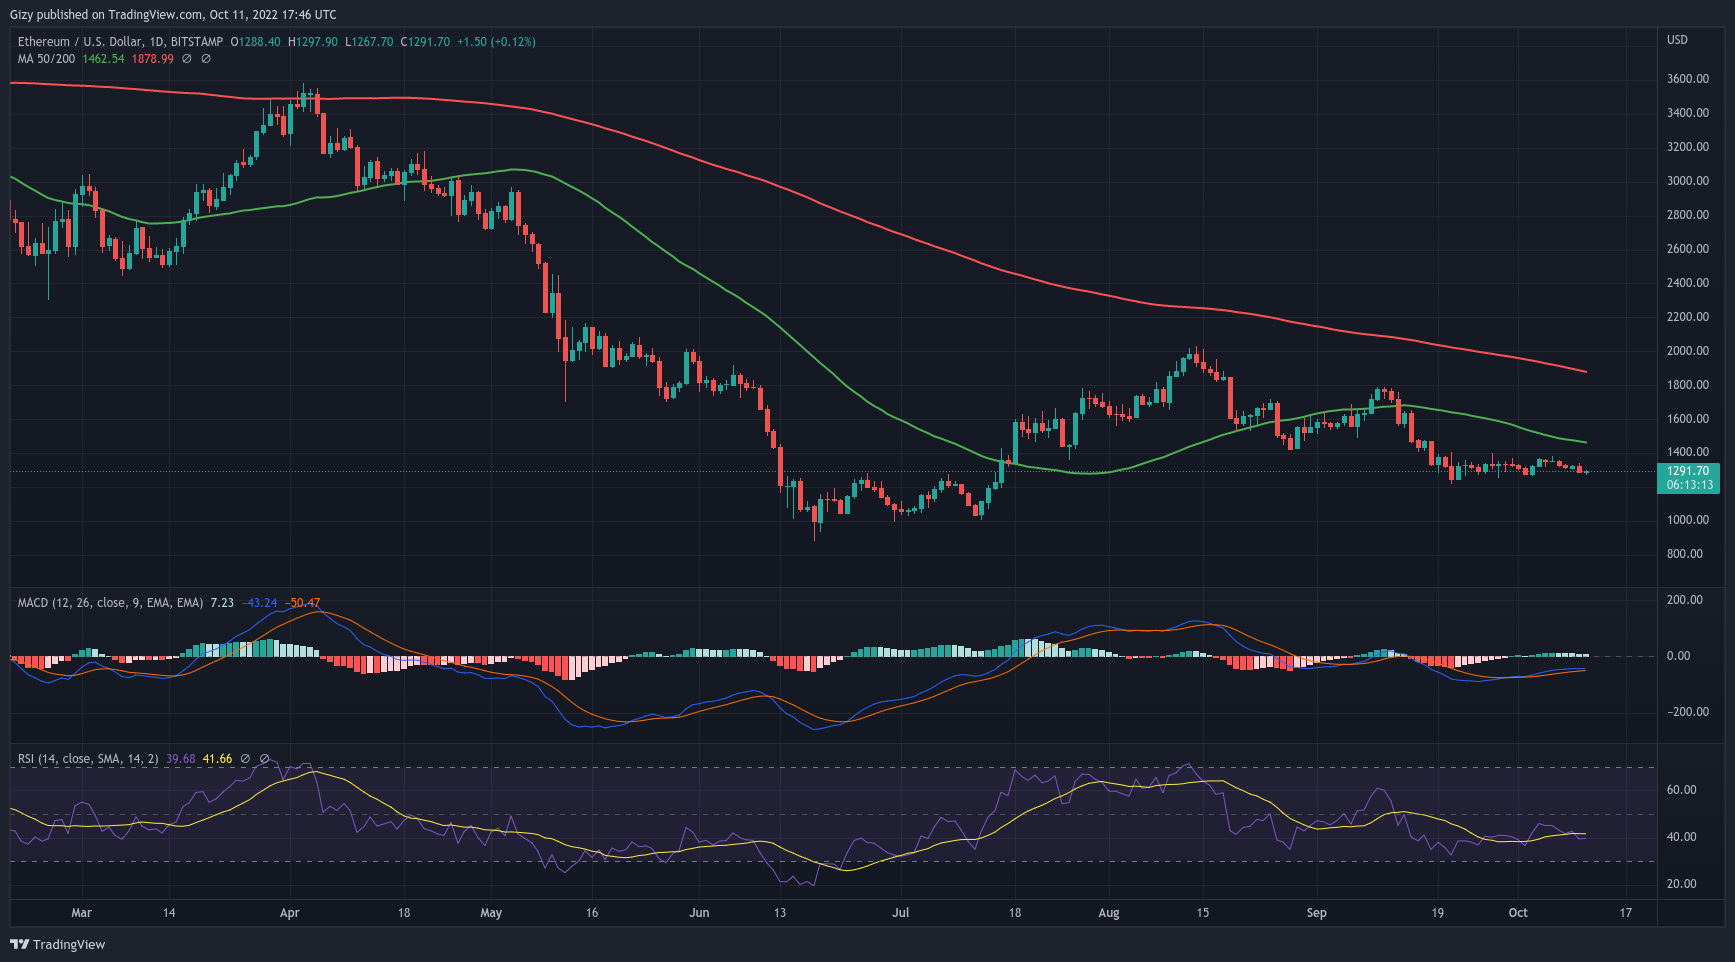
A quick breakdown of what transpired during the period under consideration. Last week Monday, the coin saw a considerable push to the top as we observed it ended the intradar=y session with gains exceeding 3%.
The bulls built on this lead the next day as ETH made an attempt at the $1,400 resistance but failed. It peaked at $1,370 and closed with gains exceeding 3%. The Candlestick patterns on Wednesday hinted at the end of the uptrend.
The candlestick was a hammer. This proved true as the top asset failed to record any notable gains or losses the next day. The next few days were also marked with consistent downtrends. In the end, the largest alt closed the week with gains of more than 3%.
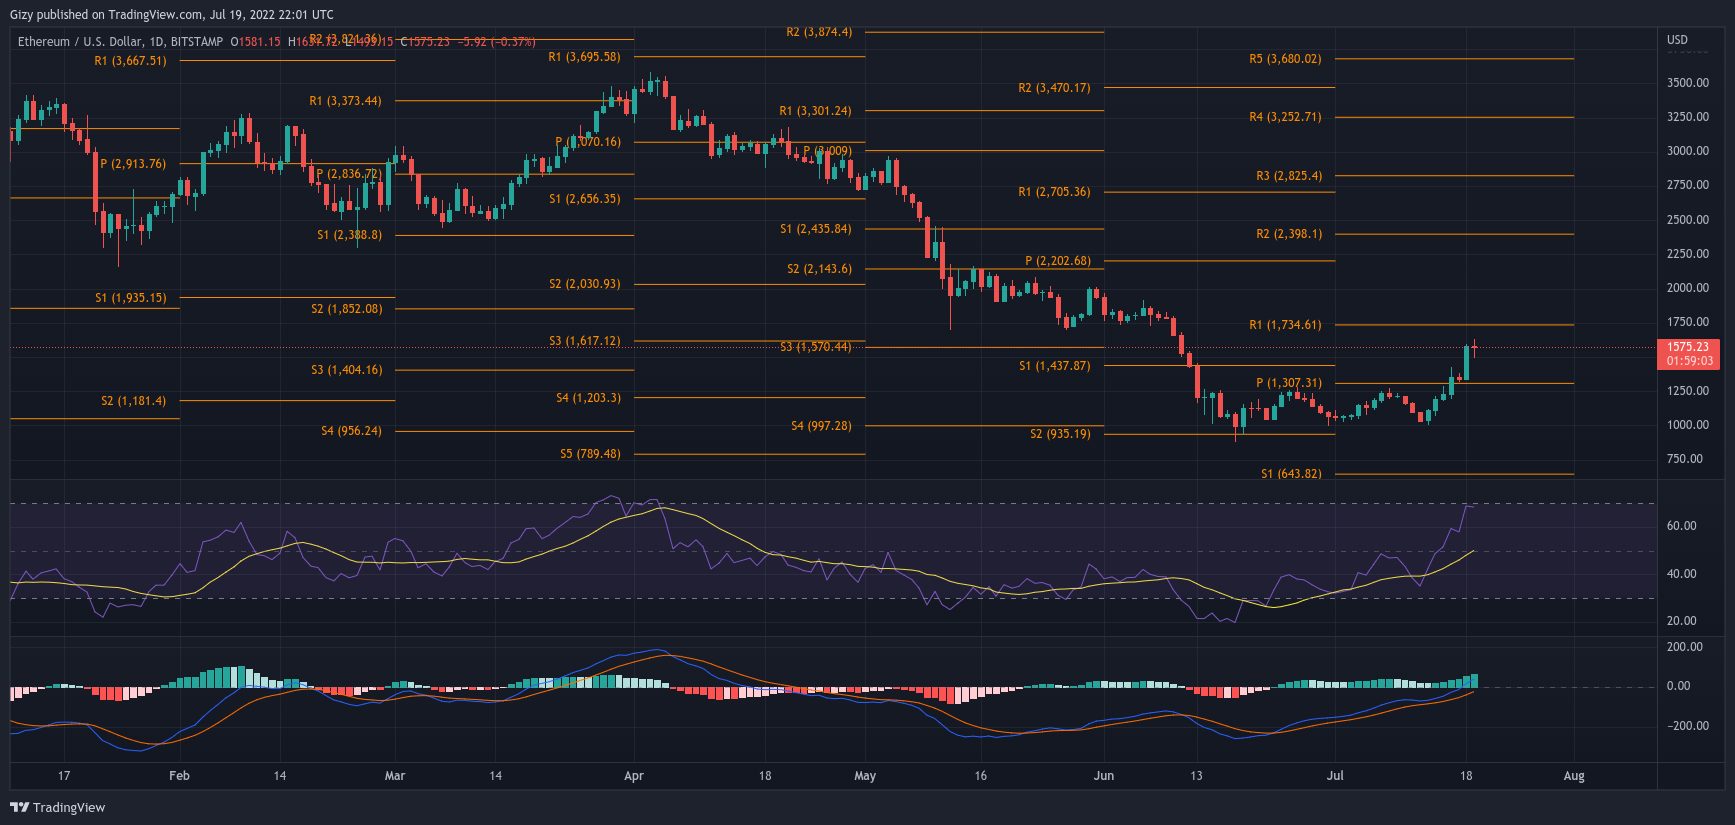
A closer look at the indicators showed factors that may affect the current intraweek session. For example, the Relative Strength Index closed at 42. We also note that the Moving Average Convergence Divergence stopped its uptrend and hinted at an impending bearish convergence.
This is what is playing out as at the time of writing. The 12-day EMA is set to intercept the 26-day, which will be followed by divergence. It is safe to conclude that indicators are not looking bullish.
One key level ETH defended for more than three weeks is the $1,200 support. If market conditions do not improve, we may expect a retest of this mark. Nonetheless, we take into consideration the most recent market trends of ranging.
We may see the altcoin linger between $1,300 and $1,200. It may also pick momentum and make another attempt at the $1,400 resistance. As of the time of writing, RSI is at 40.
Ripple was one of the top gainers last week. The coin ended with gains exceeding 18%. A look at the daily charts revealed that it was mostly bullish. A breakdown of what transpired during that session would paint a clearer picture.
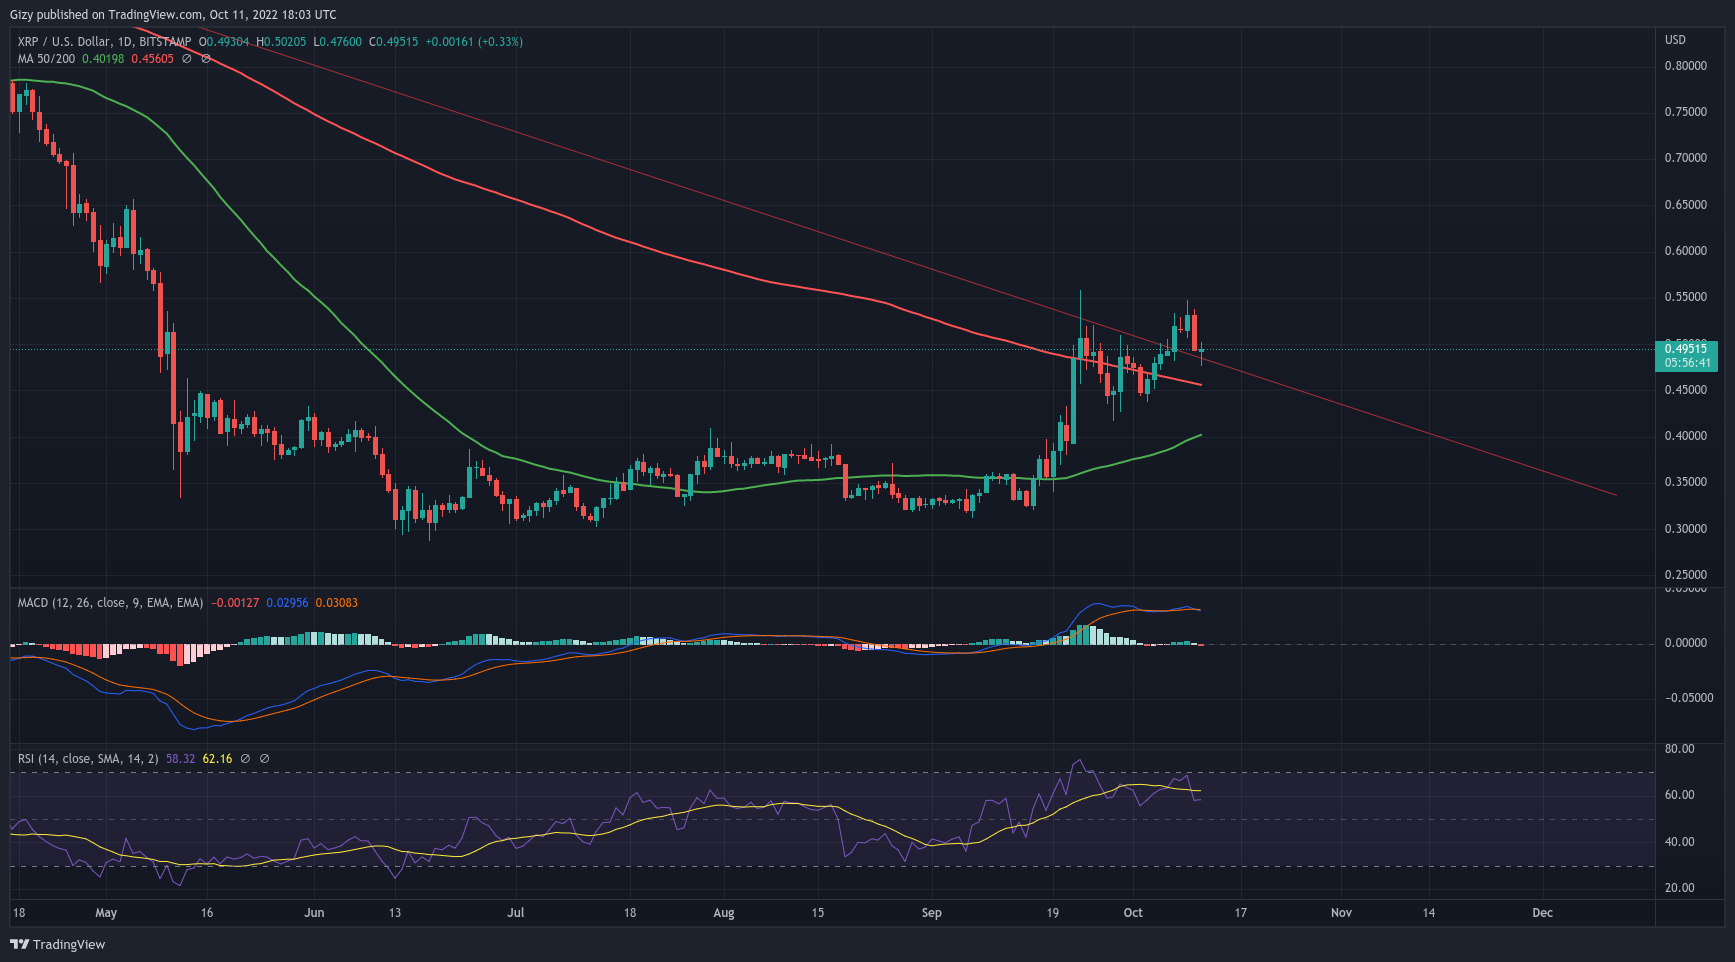
On Monday, XRP surged from a low of $0.43 to a close at $0.46. The uptrend continued as we observed another leap on Tuesday. This time, the asset reclaimed the $0.48 resistance. Additionally, it ended with gains of almost 4%.
It slowed down the next day but peaked at $0.50. Low trading extends for a few more days until the final breakout on Friday. The asset made an attempt at the $0.55 resistance but failed as it faced strong rejection at $0.53.
XRP ended that intraday session with gains exceeding 5%. On the last day of the week, the altcoin gained more than 3%. A closer look at the indicators revealed that a lot happened during the previous seven-day period.
For example, it experienced a bullish convergence and divergence in response to consistent price increases. Additionally, RSI peaked at 69 due to the massive increase in buying volume.
Many may expect the uptrend to continue. However, recent price action revealed that this may not be the case. For example, XRP saw a more than 7% drop yesterday as the bears seize control of the market.
The situation has not improved as we observe further downtrends. The asset retraced as low as $0.47 after it opened trading at $0.50. It comes as no surprise as the uptrend last week opened the coin for corrections.
It threatened to go above 70 as it enjoyed massive buying pressure. RSI is also on a downtrend at this time. One key level to look out for is the $0.45 support. Although the previous price action paints this level as weak, it is a vital mark the bulls must defend.
Quant price movement during the last seven days was intriguing. It had some moments of little or low trading volume. It also had a very good start to the week. Last week Monday, the asset surged from $129 to a close at $139.

Both prices suggest that it gained more than 7% during this period. from Tuesday to Friday, it recorded very little trading volume. Nonetheless, it saw a few losses on Wednesday. On Saturday, it broke out from the trend.
As a result of the additional push it saw during that intraday session, it hit a level it hasn’t since March. It peaked at $153 and closed at $148 after an open at $138. It recorded another positive change of 7%.
The uptrend continued into the last day of the week. This time, the coin flipped the $160 resistance. After attaining this milestone, it saw a high of $163. However, in response to the new peak, it lost momentum.
Nonetheless, it ended that session with gains exceeding 4%. The major reason for the retracement is seen in the Relative Strength Index. We observed that QNT was overbought on Sunday.
The correction extended into the present week as it recorded significant losses yesterday. Price action during the current intraday session suggests that the altcoin is seeing notable buying pressure.
It has reclaimed the lost levels and accumulated more gains than it lost yesterday. We may see more advances with a little more downtrend than the previous week. If this happens, there are indications that QNT may close above $180.
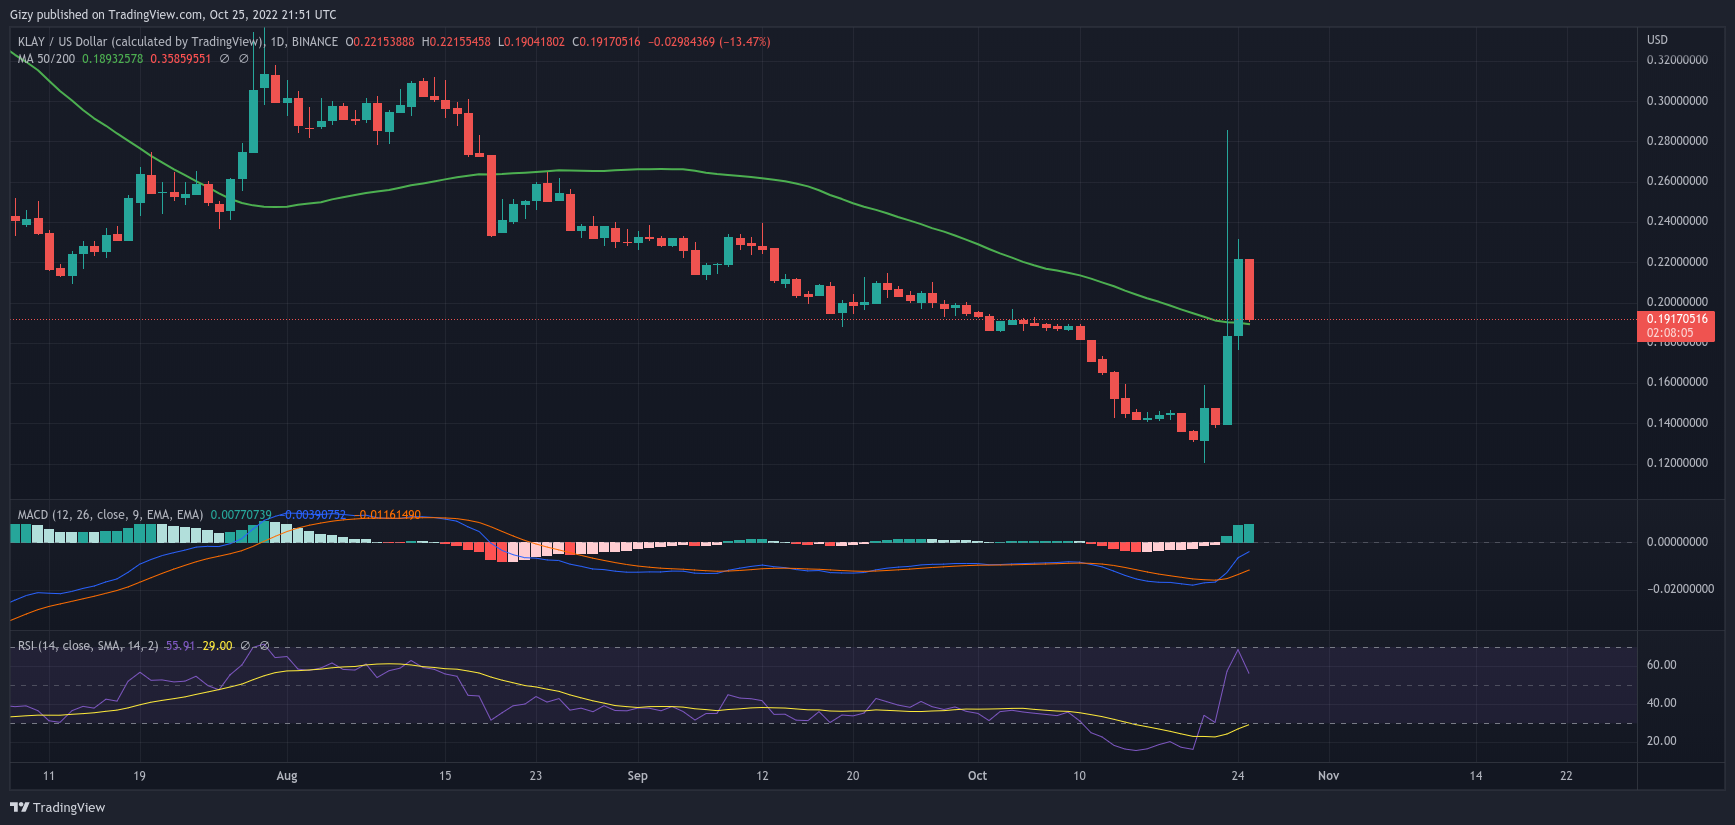
Casper also experienced massive increases last week. It battled low trading volume for the first three days of the seven-day period. During this time, we observed a gradual build-up in MACD.
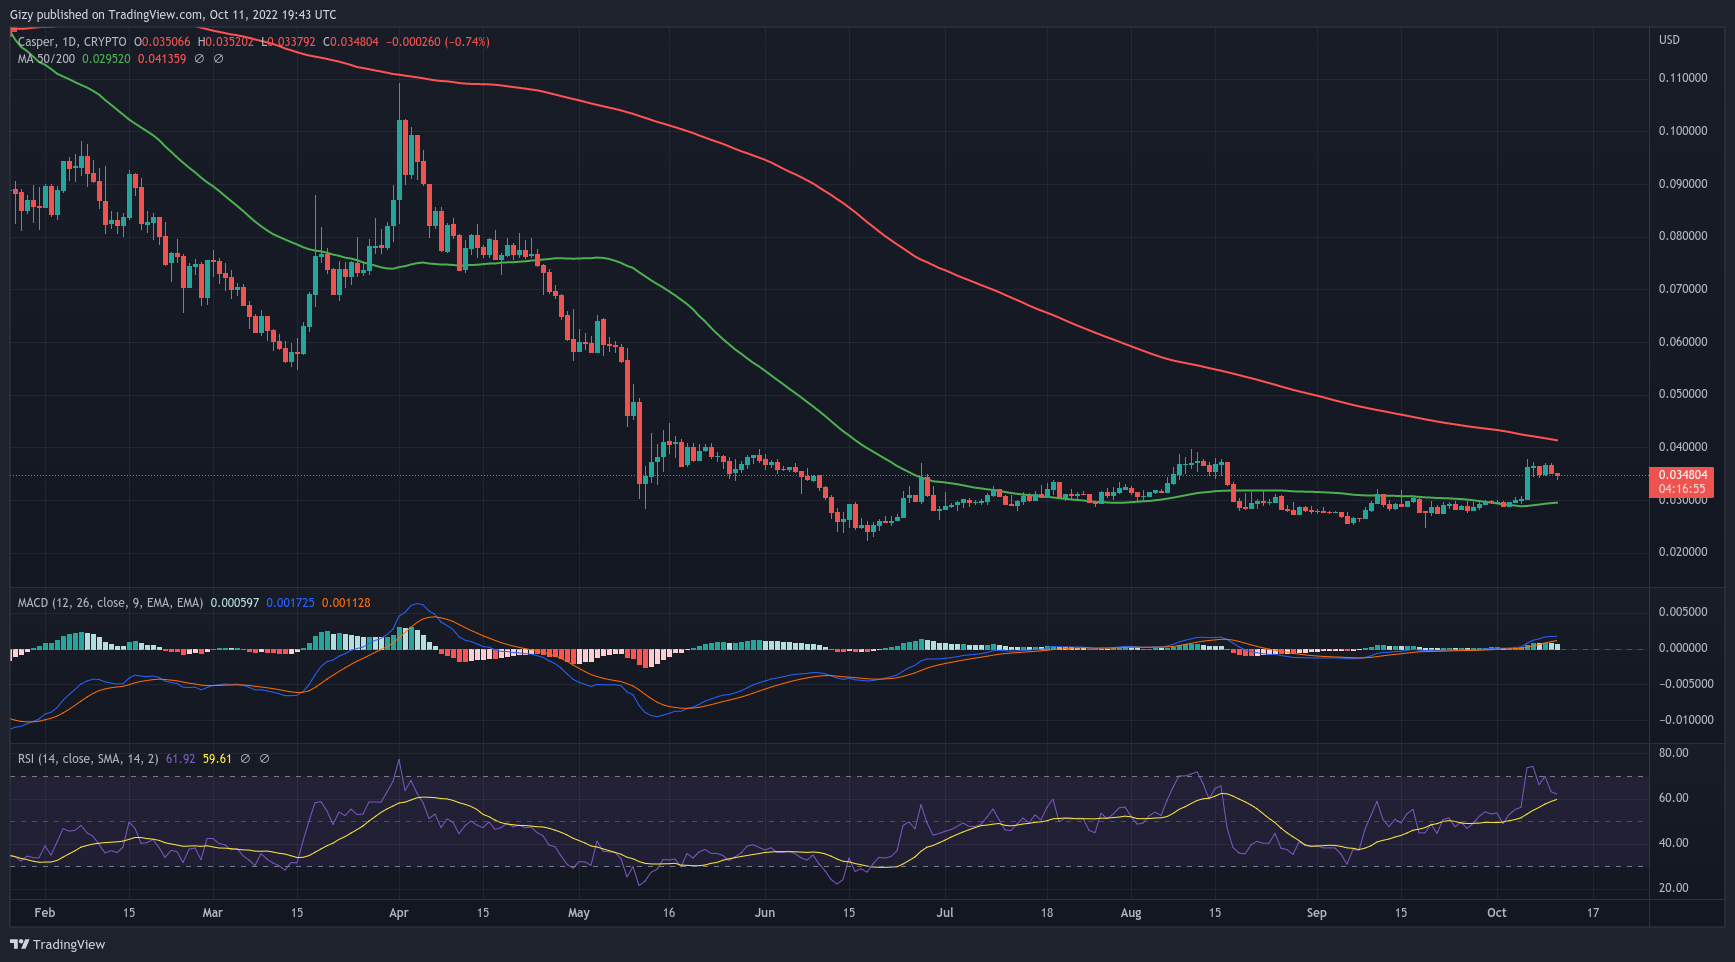
The asset had a bullish divergence on Wednesday but felt the effects the day. CSPR recorded its biggest surge for the week and over the last three months. The altcoin surged from $0.030 to close at $0.036.
This was a more than 19% price change. Aside from this move, there was none worth noting. It ended the previous week with gains of more than 20%. It has returned to its low trading phase. The question on every trader’s mind is if we see a repeat o the massive surge.
It remains to be seen as indicators are hinting at further downtrends. One such is the Moving Average Convergence Divergence. The 12-day EMA has halted its uptrend and may dip if there is no notable increase in price.
This is an indication of an impending bearish convergence. The Relative Strength is about to retrace below 60.
