Bitcoin has experienced a 4% decrease in value since its most recent halving. Despite a successful halving event, the cryptocurrency has seen a significant drop in trading volume, with a decrease of over 25% in the last 24 hours.
This decline in trading volume reflects a waning investor interest, exemplified by the first instance of zero inflow into the BlackRock iShare Bitcoin Trust (IBIT) since the approval of the bitcoin ETF on April 25.
Prior to the halving, there were speculations regarding the impact on the supply and demand of Bitcoin.
Some sources claimed that exchanges would deplete their BTC reserves within nine months, while other reports suggested traders were anticipating a substantial demand shock. However, data indicates that miners are planning to sell off $5 billion worth of the largest cryptocurrency.
It remains to be seen how these factors will affect Bitcoin in 2024 and the years to come.
Bitcoin Price Prediction 2024
Current analysis indicates that the apex coin is facing challenges maintaining prices above $63k, after an unsuccessful attempt to reach $67k. Despite expectations of price increases post-halving, the most recent price has come as a surprise. However, indicators suggest the potential for further short-term declines.
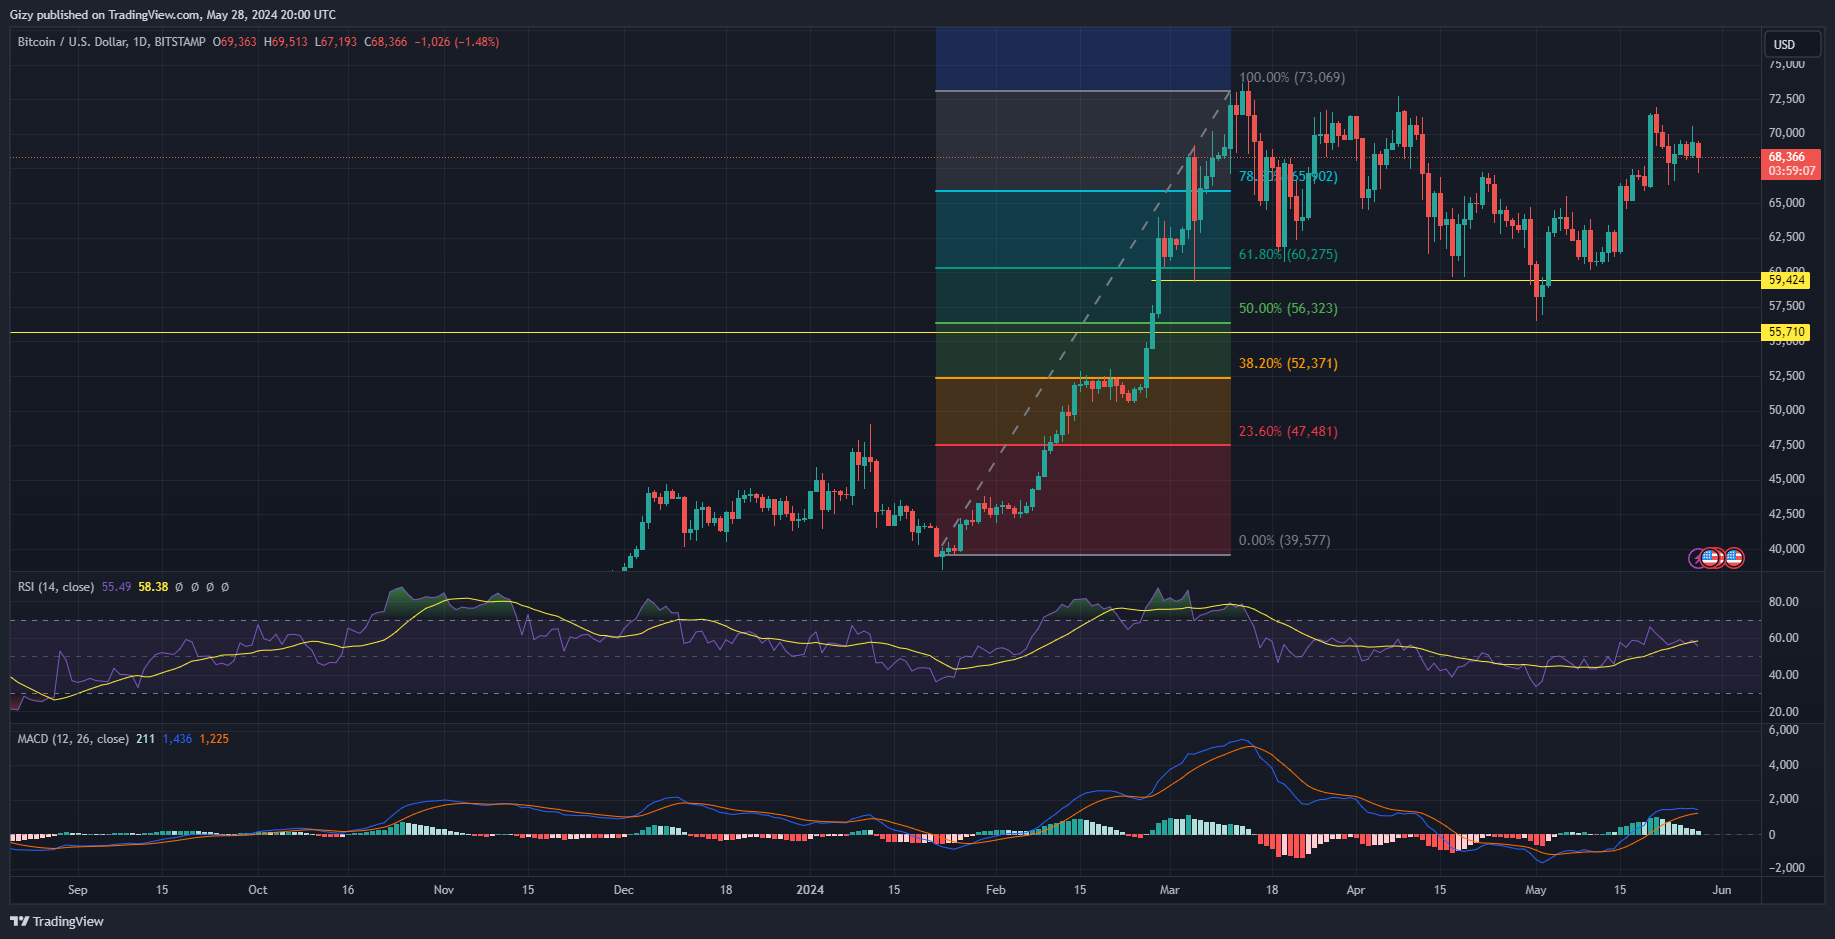
The moving average convergence divergence exhibited a bullish convergence a few days ago, but this momentum was not sustained due to the lack of buying pressure from bulls. The 12-day exponential moving average (EMA) failed to complete the interception and has continued to decline, resulting in a growing distance between the two EMAs, giving bears an advantage.
The relative strength index (RSI) is also in a downtrend, currently sitting at 42 and potentially returning to 38 if the downtrend persists.
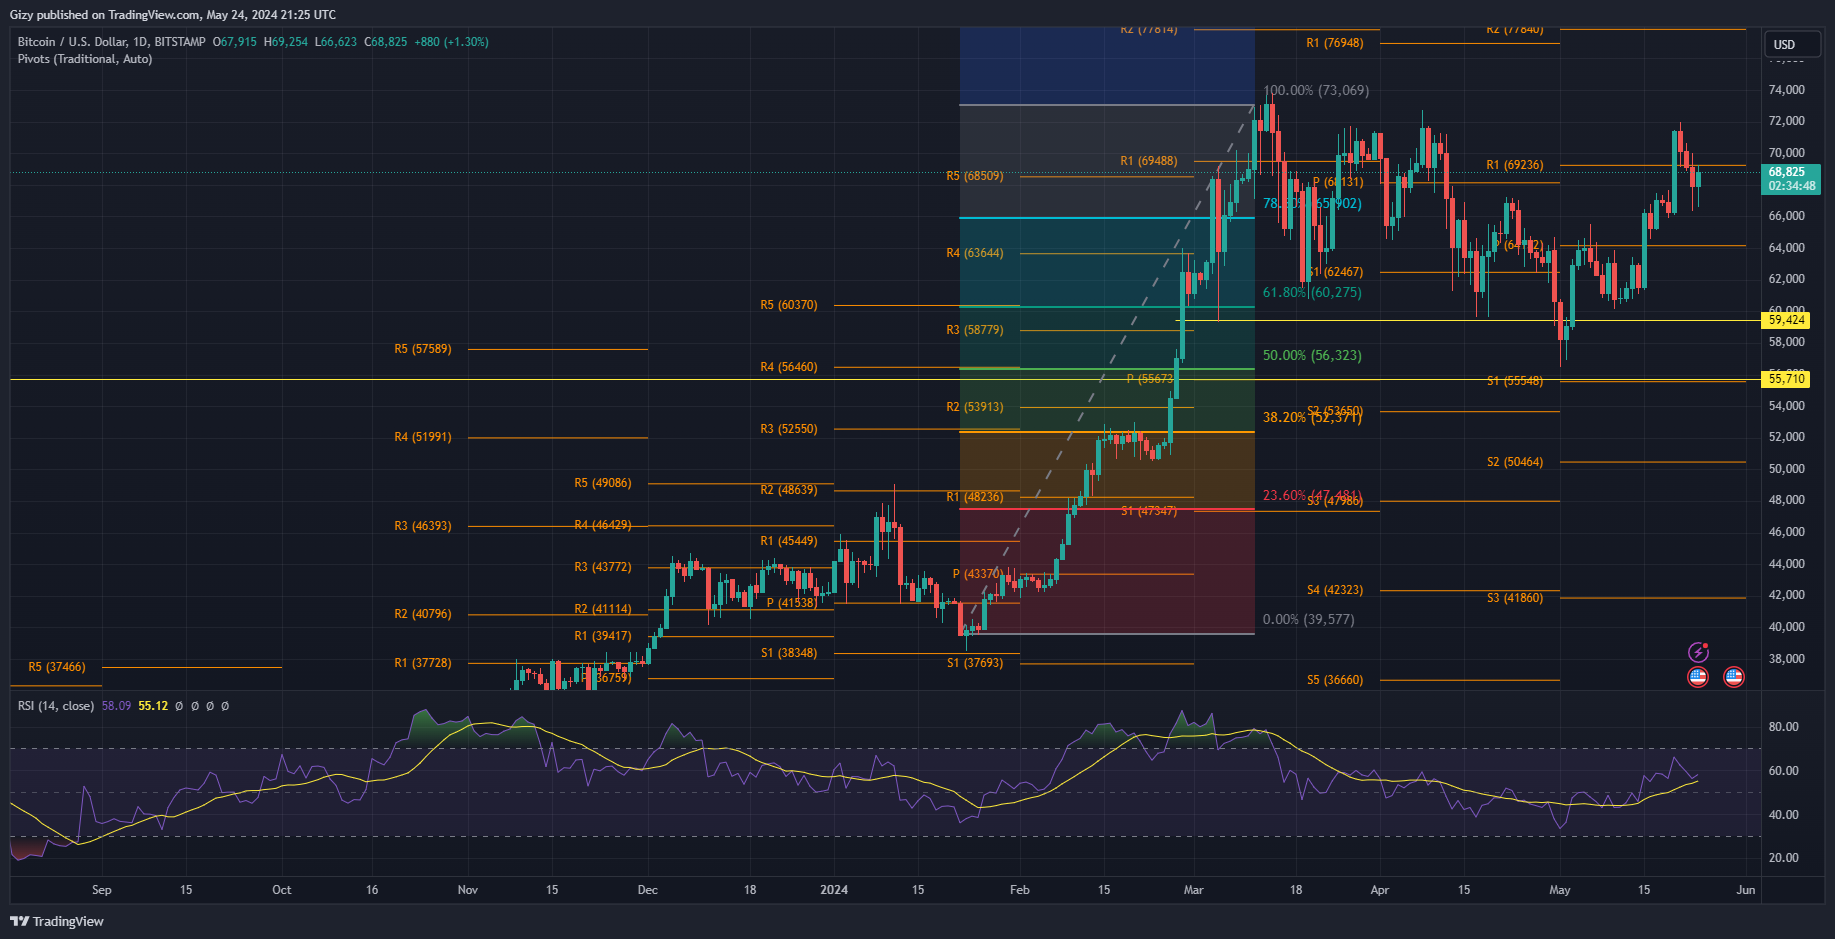
BTC recently approached testing the 50% Fibonacci retracement at $61,905, reaching a low of $62,405 before rebounding off the first pivot support.
According to the pivot point standard, bulls need to defend the S1 level or risk a drop to S2 at $53,650. It is anticipated that demand concentration will form around the 61% Fibonacci level at $59,217 in case of a pullback, with potential drawbacks to $55k should the downtrend continue.
In a bullish scenario, bitcoin will aim to reclaim its pivot point at $68,131, which requires it to stabilize above $67k. Multiple selloffs have occurred around this level, indicating a key resistance point.
Furthermore, Fibonacci retracement suggests a potential return to $73k once the bull cycle resumes.
Regarding the apex coin’s performance in 2024, predicting specific price points several years in advance is highly speculative and challenging.
Factors such as market sentiment, adoption, technological developments, and macroeconomic trends will play crucial roles in determining the apex coin’s future prices. Therefore, it’s essential to carefully monitor market conditions and consider a range of variables when assessing long-term price projections.
Bitcoin Rainbow Chart
The Bitcoin rainbow chart suggests that the cryptocurrency may test higher price levels after the uptrend begins. However, the timing of when the uptrend will commence is uncertain and can only be determined by time. The chart shows the price movements before and after each halving event.
Historically, it has taken between 4 and 8 months for Bitcoin to resume its upward trend following a halving. For example, in 2016, the price surged six months after the halving event, but the bull run didn’t start until the following year.
Similarly, in 2020, it took four months after the halving for the bull run to begin.
If a similar pattern occurs this time, Bitcoin could start its next bull run between August and December.
If the run commences earlier, the cryptocurrency may aim to reclaim lost levels within eight months or sooner, and then target $80,000. According to the rainbow chart, Bitcoin is likely to end the year with prices in the range of $85,000 to $113,000, with a median prediction of $99,000.
Price Prediction 2025
Based on historical data and the rainbow chart analysis, it has been observed that the year following a halving event often marks the peak of a bull run for Bitcoin. This trend has been evident in the two most recent halving cycles. For example, following the 2016 halving, Bitcoin’s price surged by over 1300%.
Similarly, in 2021, BTC reached a high of $69,000 before experiencing a pullback, ultimately closing the year with gains of nearly 60%.
Notably, there are currently no significant prevailing bullish or bearish factors that are anticipated to significantly impact the price of Bitcoin in 2025.
This is despite ongoing geopolitical conflicts such as the Russo-Ukraine war, which will have entered its fourth year by 2025. The crypto community seems to have largely priced in these factors, with attention more focused on potential fresh geopolitical tensions.
Given these observations, 2025 is anticipated to be a highly bullish period for Bitcoin, with expectations of reaching unprecedented price levels.
Analysis of the rainbow chart has shown that Bitcoin tends to peak or stabilize near its highest points in the chart during bullish phases following a halving, indicating the potential for the asset to achieve stability at six-figure prices.
Looking at potential price ranges, it is projected that Bitcoin, having closed 2024 near $99,000, may aim to maintain prices within the $110,000 to $120,000 range in the first quarter of 2025.
Subsequently, during the second quarter, there may be a continuation of the upward trend, with Bitcoin’s price potentially surging to the range of $131,000 to $160,000. Moving into the third quarter, it is anticipated that the price could range from $140,000 to $180,000. The peak of excitement could come in the fourth quarter, with Bitcoin possibly surging as high as $200,000.
Price Prediction 2026
Based on historical data from the rainbow chart, it is projected that Bitcoin’s current bull run may come to an end towards the conclusion of 2025, followed by a continuation of the bear market in 2026.
This pattern has been observed during the last two halving events. For instance, following the 2012 halving, BTC’s value dropped from $1,206 in 2013 to $322 in 2014. Similarly, after the 2016 halving, it decreased from $18,000 in 2017 to $4,000 in 2018.
The trend continued to play out during the period from 2020 to 2022. The value of Bitcoin surged to a peak of $69,000 in 2021 before retreating to a low of $16,000 in 2022. Notably, during these declines, the losses were significant.
For instance, in 2013, the value of BTC plummeted by almost 60%, while in 2018, it recorded a decline of over 73%. In 2022, Bitcoin’s value experienced a 64% drop. On average, the coin undergoes a 65% decrease during these periods.
Considering this historical pattern, traders may anticipate a similar downturn. If Bitcoin closes at around $200,000, it is projected to return to five-figure values, potentially dropping to a range between $70,000 and $50,000.
Price Prediction 2027
In 2026, there was a significant decline in the value of the coin, but in 2027, it is expected to regain its lost levels based on historical trends. The market pattern suggests that the period leading up to the next halving will be relatively calm with small uptrends.
For instance, in 2019, the leading cryptocurrency surged from $3,694 to $7,168, marking a 94% increase. In 2023, it recovered from $16,530 to $42,258, representing a 155% increase. On average, the asset gains over 124%. This forecast indicates that the largest cryptocurrency will likely reach six figures, with a projected close of around $140k in 2027.


