Author: Gideon Geoffrey

  • Top Five Cryptocurrencies to Watch This Week (Jan 9)

    Top Five Cryptocurrencies to Watch This Week (Jan 9)

    Most cryptocurrencies spent the first week of the year with minimal volatility. They failed to surge or dump and maintain their various vital levels. This sedentary behavior of crypto assets is also present in the global cryptocurrency market cap.

    A clear indication of this is the value at which it opened the seven-day period and the close. It opened at $798 billion but experienced a small downtrend. As a result, it lost a few percent but recovered before the day ended.

    Following the slight drop, it is safe to say that the industry was on an uptrend. A look at the chart below further affirms this claim as we noticed the gradual increase in worth. Nonetheless, it peaked at $828 billion a few minutes to the time of writing.

    It’s currently holding the level and may close at it. A close at this mark may indicate an almost 4% change in value. On the part of fundamentals, there are a lot of happenings during the period under consideration.

    However, most of them were not price-related as they had to do with legal cases and companies dealing with the effect of the bearish dominance. For example, Huobi announced a fresh downsize of 20% of its workforce.

    FTX founder also pleaded not guilty to charges of fraud. The new week is opening with a lot of uncertainty as there are no big moves in price or fundamentals. Nonetheless, there are some cryptocurrencies to watch this week.

    Top Five Cryptocurrencies to Watch

    1. Bitcoin (BTC)

    The apex coin is one of the key cryptocurrencies to watch this week. Its performance during the previous seven-day period was one that anticipated as the coin continued to experience notable stability in price.

    Nonetheless, it gradually surged to and retested the $17k resistance. Currently trading below it, we may expect more trials at the mark over the next seven days. Indicators are silent as there is no new information.

    Since a bullish divergence last week, both the 12-day and 26-day Exponential Moving Averages are on the uptrend. A look at the Relative Strength index says that there is no significant change to market sentiment.

    Going by this, we may expect another week filled with low trading volume. It is also to bear in mind that fundamentals could alter this prediction.

    2. Solana (SOL)

    Solana had one of its best weeks. Following the massive drop in November, this is the largest volume its seeing. It may end the current seven-day period with gains of more than 35% as it reclaimed more levels.
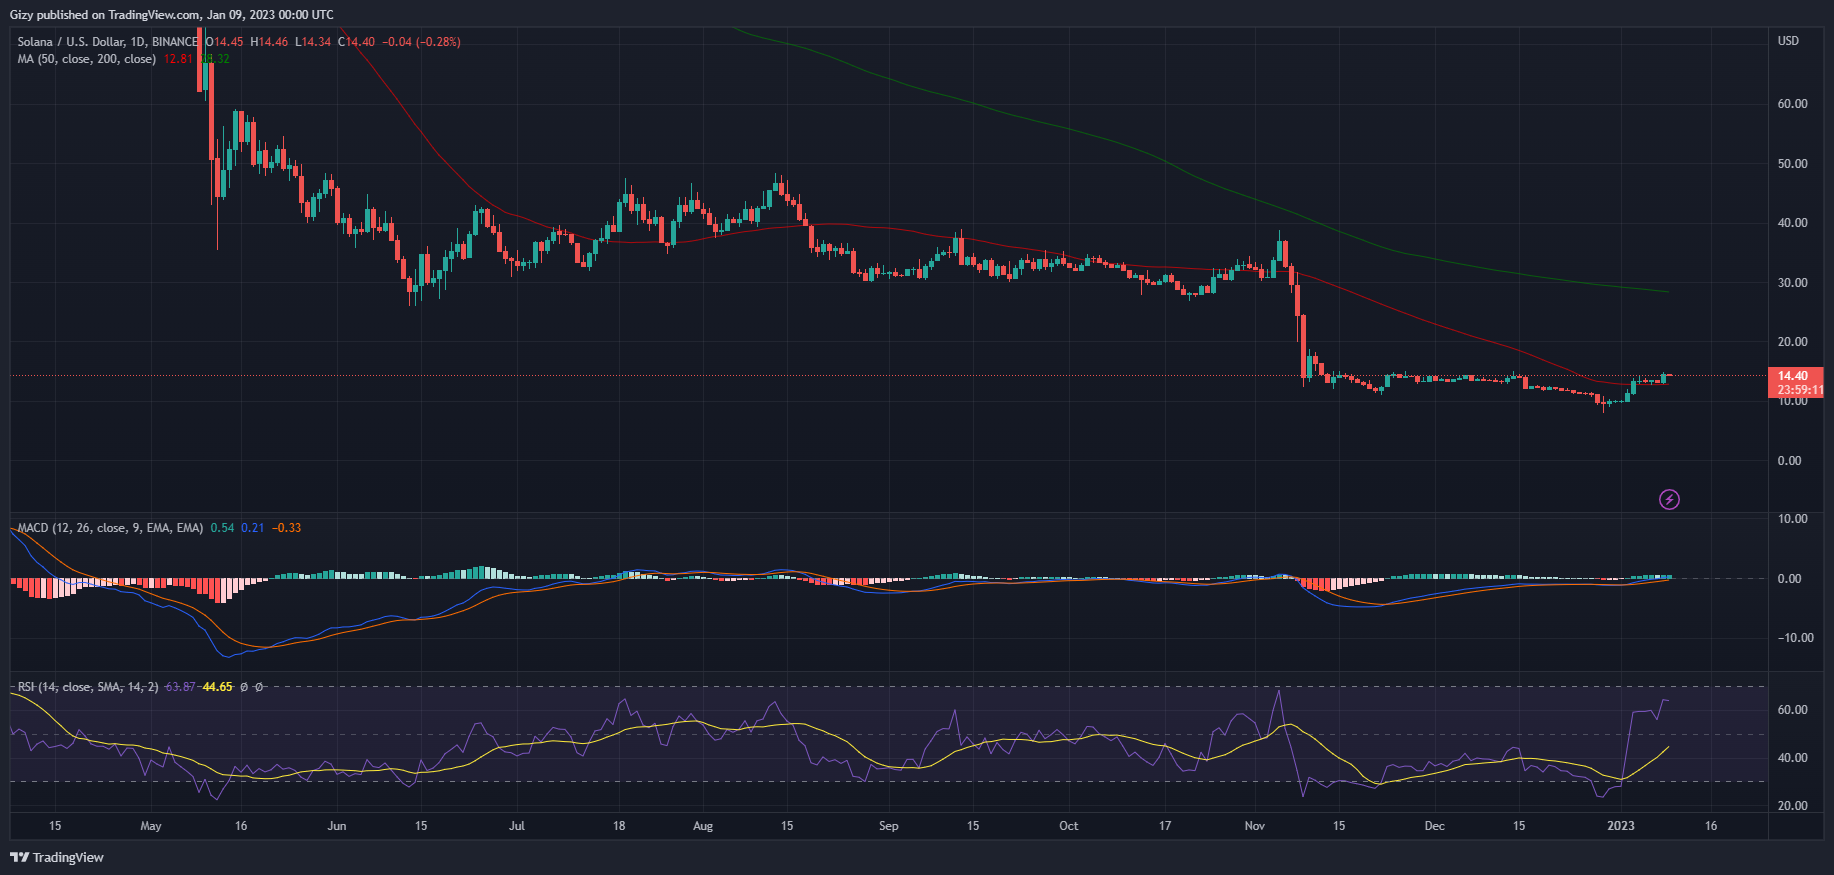
    One such level is the $10 support. It lost it last week but reclaimed it on Tuesday. The recovery continued as it reclaimed both $12 and $13. Currently at $13.5, there are indications of more movements during the next seven days.

    In response to the massive surge on Monday, SOL had a bullish divergence on MACD. The indicator is still positive at this time which may indicate more incoming uptrends. If this happens, one of the key levels to watch is the $15 resistance.

    A closer look at the charts revealed that this mark is not the toughest as it broke on several occasions. We may see a repeat of this event within the next seven days as we see prices gearing up for moves.

    3. Ethereum Classic (ETC)

    Ethereum classic was one of the top gainers over the last seven days. One of its biggest surges happened on Wednesday. It opened the session at $15.8 and attempted flipping $20. However, it lost this bid as it peaked at $19.9.
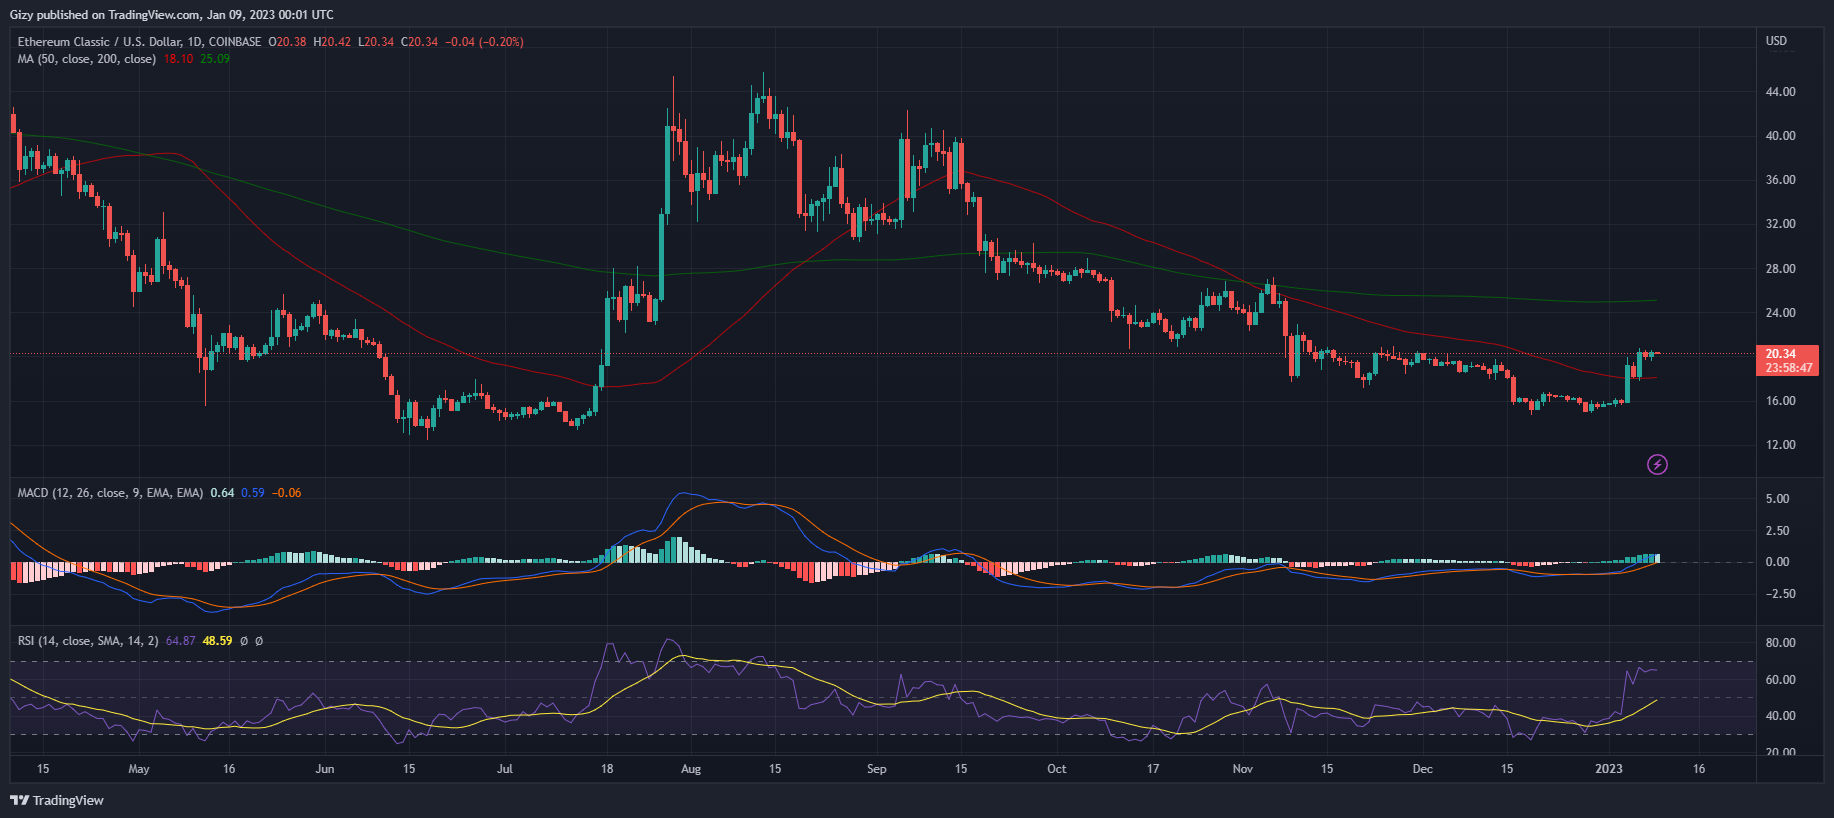
    Nonetheless, the session ended with the coin holding on to it 20% increase. It had another  surge but not to the extent of the previous. A look at the weekly chart shows that the asset ended the previous intraweek session with a positive change of more than 30%.

    The question on every traders’ mind is whether the increase will continue. A look at RSI shows that any massive push to the top may result in ETC becoming overbought. This may also be a recipe for a massive downtrend.

    Currently above $20, we may see more action at the mark as it is one of the most vital levels. However, it’s fragile. Aside from the key support under consideration, a flip may see ETC search for support at $18. Nonetheless, it may also make an attempt at $22.

    4. Zilliqa (ZIL)

    Zilliqa had another splendid week. It closed the previous intraweek session with gains of more than 30%. The main highlight of the period under consideration is Sunday. This was when the coin had its biggest increase.
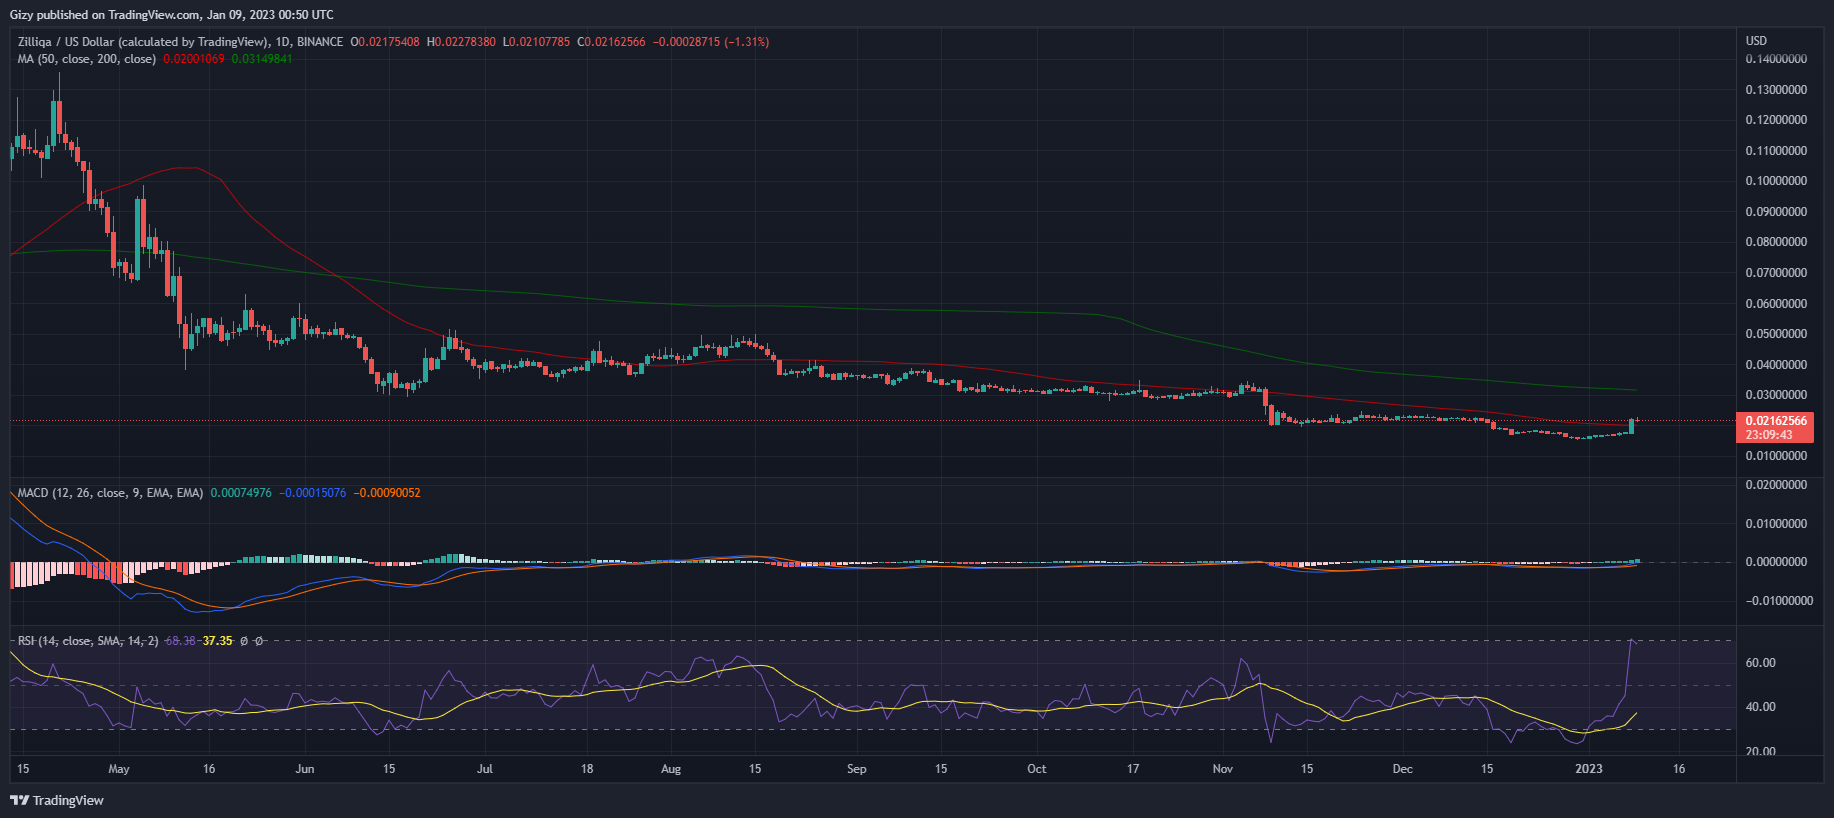
    It opened at $0.017 and surged to high of $0.022. ZIL saw notable resistance at the mark and dipped a little bit. Nonetheless, it ended the day with gains of more than 20%. Aside from this massive increase, it also had a few small ones during the week.

    With the focus on the intraweek session, we expect more volatility. During Sunday’s event, the asset was overbought. As at the time of writing, it is experiencing small downtrend that may deepen as the week progresses.

  • Crypto Market Top Four Losers of 2022

    Crypto Market Top Four Losers of 2022

    As the year comes to an end, we look back at how most assets performed. Further research as it that it is hard to find assets that gained up to 10% during the period under consideration.

    This bad sentiment is affecting the global cryptocurrency market cap. We are also seeing a gradual drop in One of the slowest declines in the market worth of all cryptocurrencies was below $800 billion. The market valuation gradually decreased over the last three days without a significant increase in trading volume.

    Looking at the chart, we could see that there was a clear downward trend over this time. However, as the year comes to a close, we can anticipate that the value will continue to gradually decline since most traders will be away from the market.

    For the majority of traders, 2022 was a rollercoaster experience because they weren’t prepared for the kind of turmoil it would bring. The mistakes were numerous. The graphic below provides a visual representation of what happened during the time frame in question.

    The market was shaken by so many negative developments, which resulted in a sharp decrease in the sector’s worth. It started the year at $2.25 trillion, but as of this writing, it was only worth $798 billion. This is a blatant sign that the sector has declined by approximately 65%.

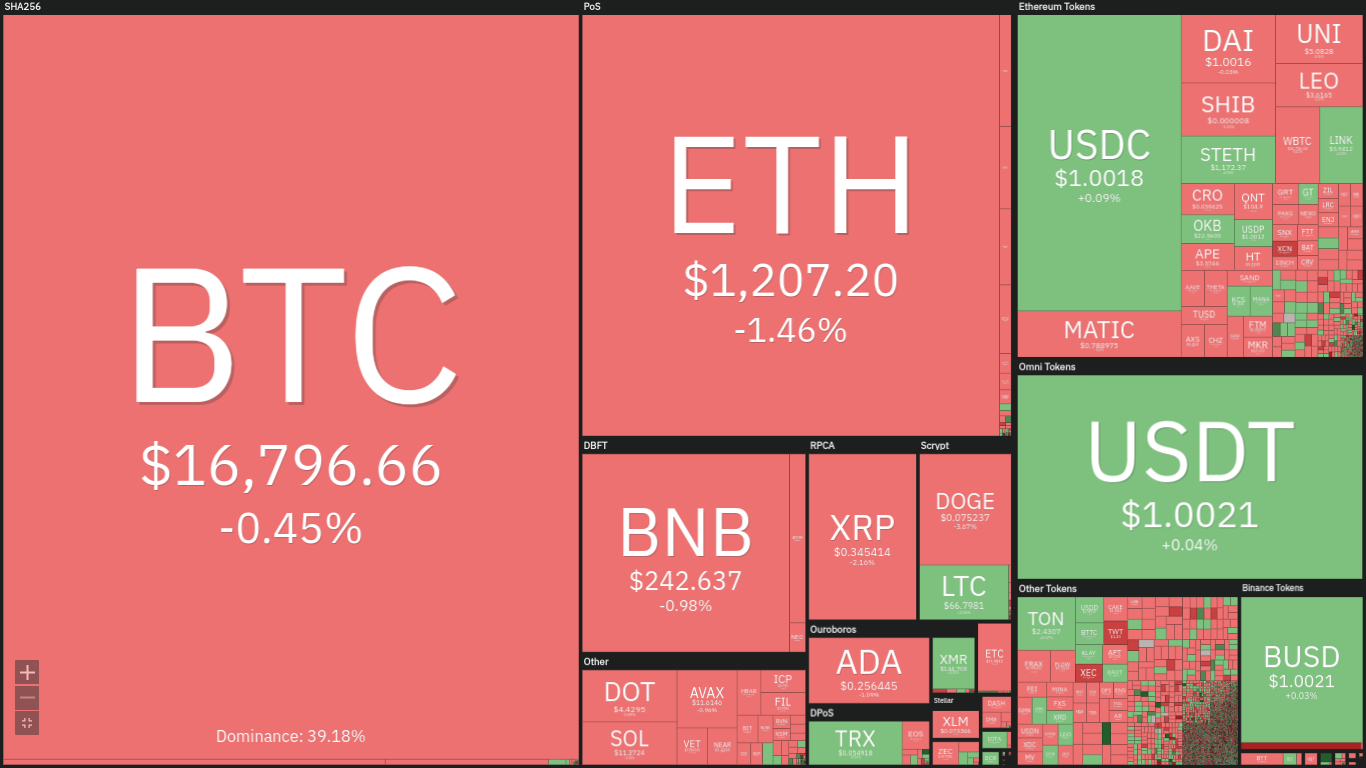
    This also means that more than 60% of the value of the majority of cryptocurrencies was lost. More information is provided by the picture below. We saw that the majority of the assets are tinted gray or red, which denotes losses (not decided).

    Looking at the above graph reveals that popular coins like Bitcoin and Ethereum lost more than 60% of their value. In addition to these assets, numerous altcoins had large price declines over the time period under examination.

    Most of these cryptocurrencies are down more than 50%, and several are down even more. Let’s examine the top losers over the previous 364 days.

    1. Solana (SOL)

    In 2021, Solana was among the brightest coins. It was known as the “Ethereum Killer” and endangered the majority of the top 10 assets. Following a positive close the previous week, it was added to most investors’ watchlists.

    It sparked curiosity for 363 days despite making several press appearances. It made various enhancements to its community and ecosystem while generally being bullish. In March, it made one such adjustment by collaborating with PUBG to develop blockchain games.

    The Solana testnet withstood 13,000 TPS in August, which led to another significant announcement. It also passed 3,400 validators, making it the most “decentralized” system. A-listers like SBF and the co-founder of Polygon were among those who became interested in SOL.

    Given that it might end 2022 with its largest losses ever, all of these reports have a relatively little long-term effect on the asset. The adverse effect on the altcoin, which is currently down more than 90%, cannot be overstated.

    The monthly graphic provides greater insight into what happened. The subject asset had a dismal start to the year, losing more than 40% in January. A closer look at the charts revealed that it had two straight greens.

    2022’s biggest spike occurred in July. SOL increased by more than 25%, gaining more as the month came to an end. Only three of the year’s twelve months produced meaningful advances. A doji was used to represent February.

    The coin fell more than 50% in November, which was the most bearish month. There is currently a more than 33% decline, and a late recovery is not in the cards.


  • Top Four Cryptocurrencies to Watch This Week (Dec. 26)

    Top Four Cryptocurrencies to Watch This Week (Dec. 26)

    During the previous week, the price of bitcoin and other cryptocurrencies remained largely steady. The significant drop in trading volume is what has caused the value to remain stable. The fact that most investors are preparing for the holidays is one reason for this, along with the celebrations.

    However, there were a few instances where these assets displayed notable volatility. One such instance occurred on Tuesday when the global cryptocurrency market cap fell to a low of $790 billion. The week started with valuations at $812 billion, it rebounded to reach a high of $818 billion after dipping to the low.

    One look at the sector’s chart, we can see that it spent the majority of the week over $810 billion. It maintained this stance until the end of the week and closed below the highlighted value. We see evidence of the stability in value in the image below.

    We saw a striking resemblance between a stablecoin’s volatility and that of significant cryptocurrencies. With such conclusion, many may say there were no positive fundamentals during the period under consideration.

    This is not true as several bullish news made the rounds. For instance, a Nigerian poll opened the intraweek session. It came to the conclusion that despite official restrictions, people wanted more Bitcoin.

    A new regulation in Brazil now acknowledges bitcoin as a legitimate form of payment, which is further good news. In order to exploit cryptocurrencies as a vehicle for international trade, Russia also intends to legitimize them. All of this encouraging news failed to affect prices.

    At the time of writing, the market is still grappling with the effect of the low trading volume. Will it persist throughout the week?

    Top Five Cryptocurrencies to Watch

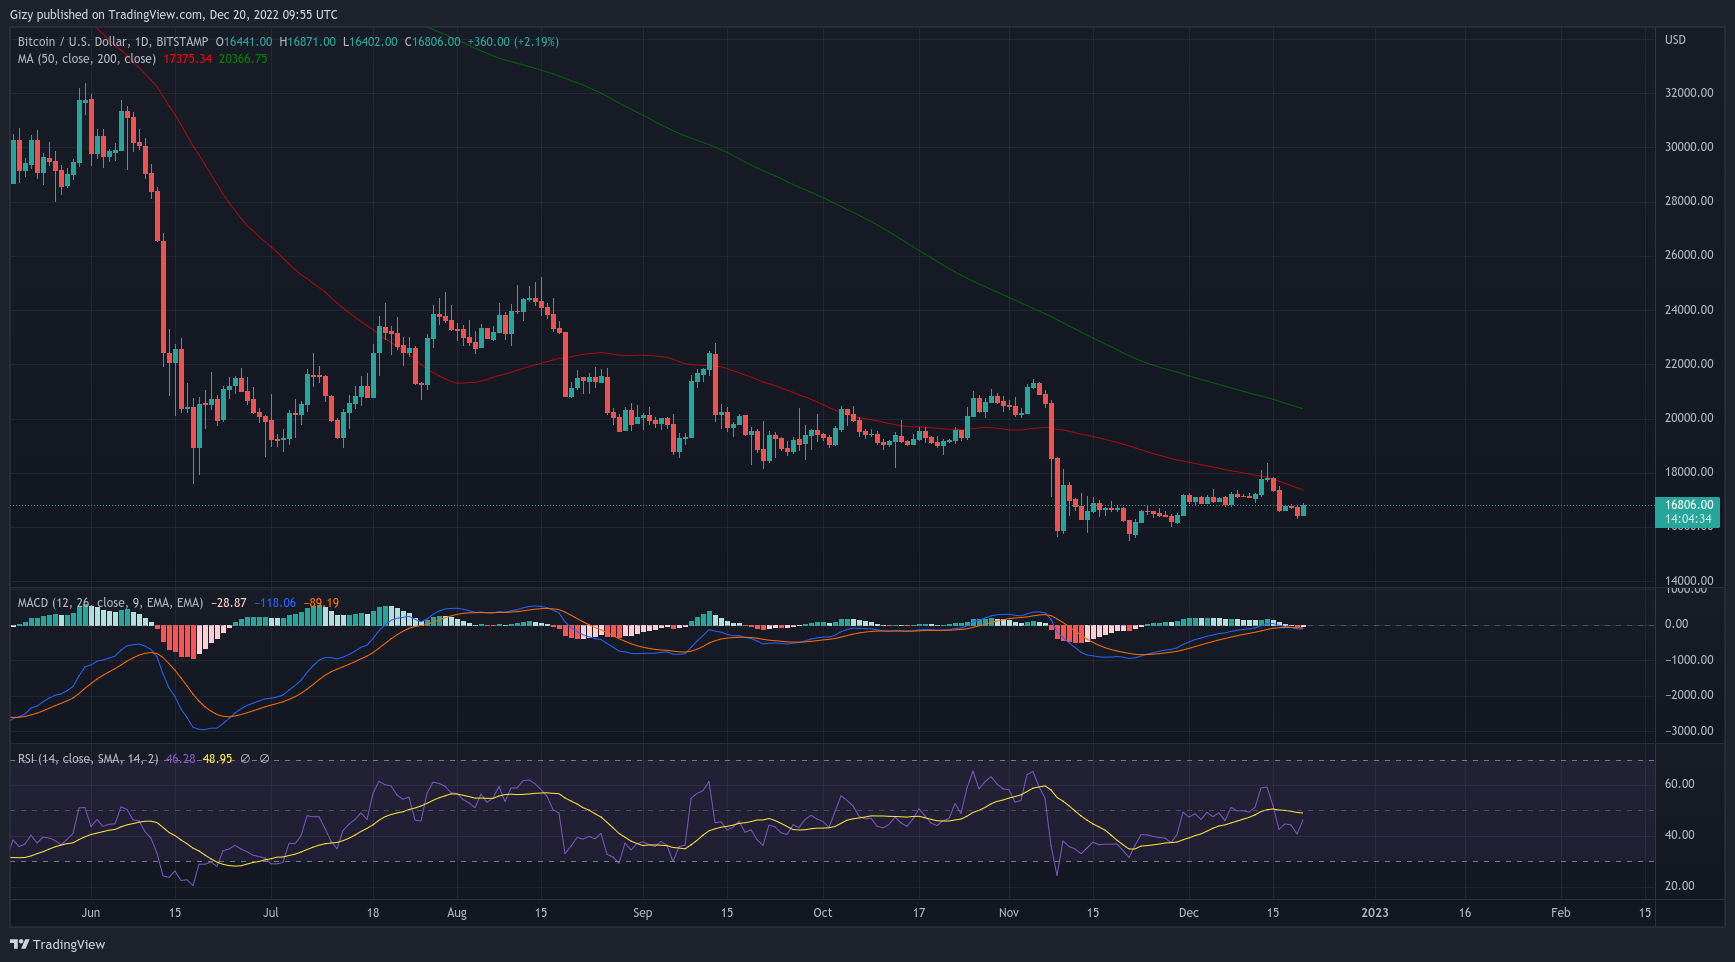
    1. Bitcoin (BTC)

    The previous week was among those in which it appeared like the cryptocurrency market was on vacation. The lack of volatility was the reason of this. The first two days of the week, however, saw significant price changes.

    For instance, it started the first intraday session at $16,744 and fell to a low of $16,293 as a result of intense selling pressure. Although there was some improvement, the asset still finished down by over 2%.

    The highest weekly increase in Bitcoin occurred the following day. The coin made an attempt at the $17k resistance for the first time in more than four days. It had a brief period of prosperity because its high was $17,034.

    Prior to the end of the intraday session, it lost the record, closing at $16,900. Nevertheless, it gained roughly 3% at the closing. There were no noteworthy actions following these important occasions.

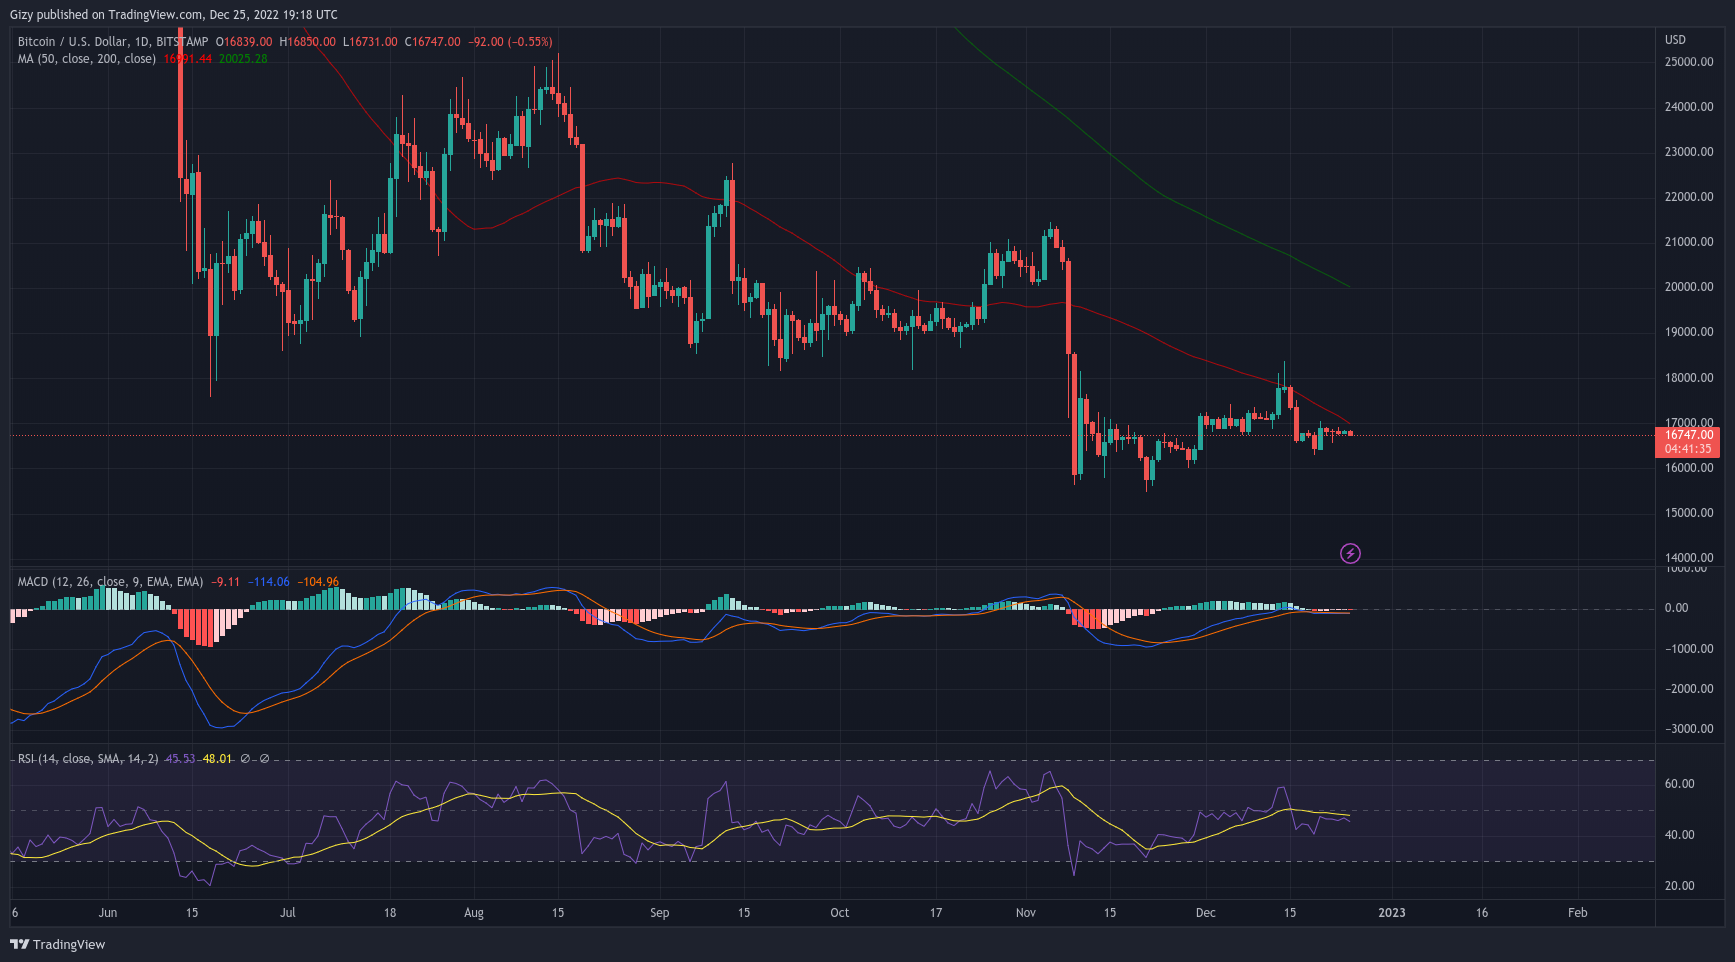
    A look at indicators tells what to expect over the next five days. The first on the list is the Moving Average Convergence Divergence. Due to price movement following a negative divergence on Sunday, the 12-day EMA maintained its downward trend on Monday.

    On Tuesday, a rebound began as a result of the improvement in worth. Two days ago, the 12-day and 26-day EMAs touched, pointing to an impending bullish divergence. We can infer from this interpretation that BTC may see huge price gains.

    However, the low trading volume over the last 40 hours is telling a different story. We may see BTC hold on to the $16k support. With the new year celebration in view, we may expect a repeat of the previous week’s events.

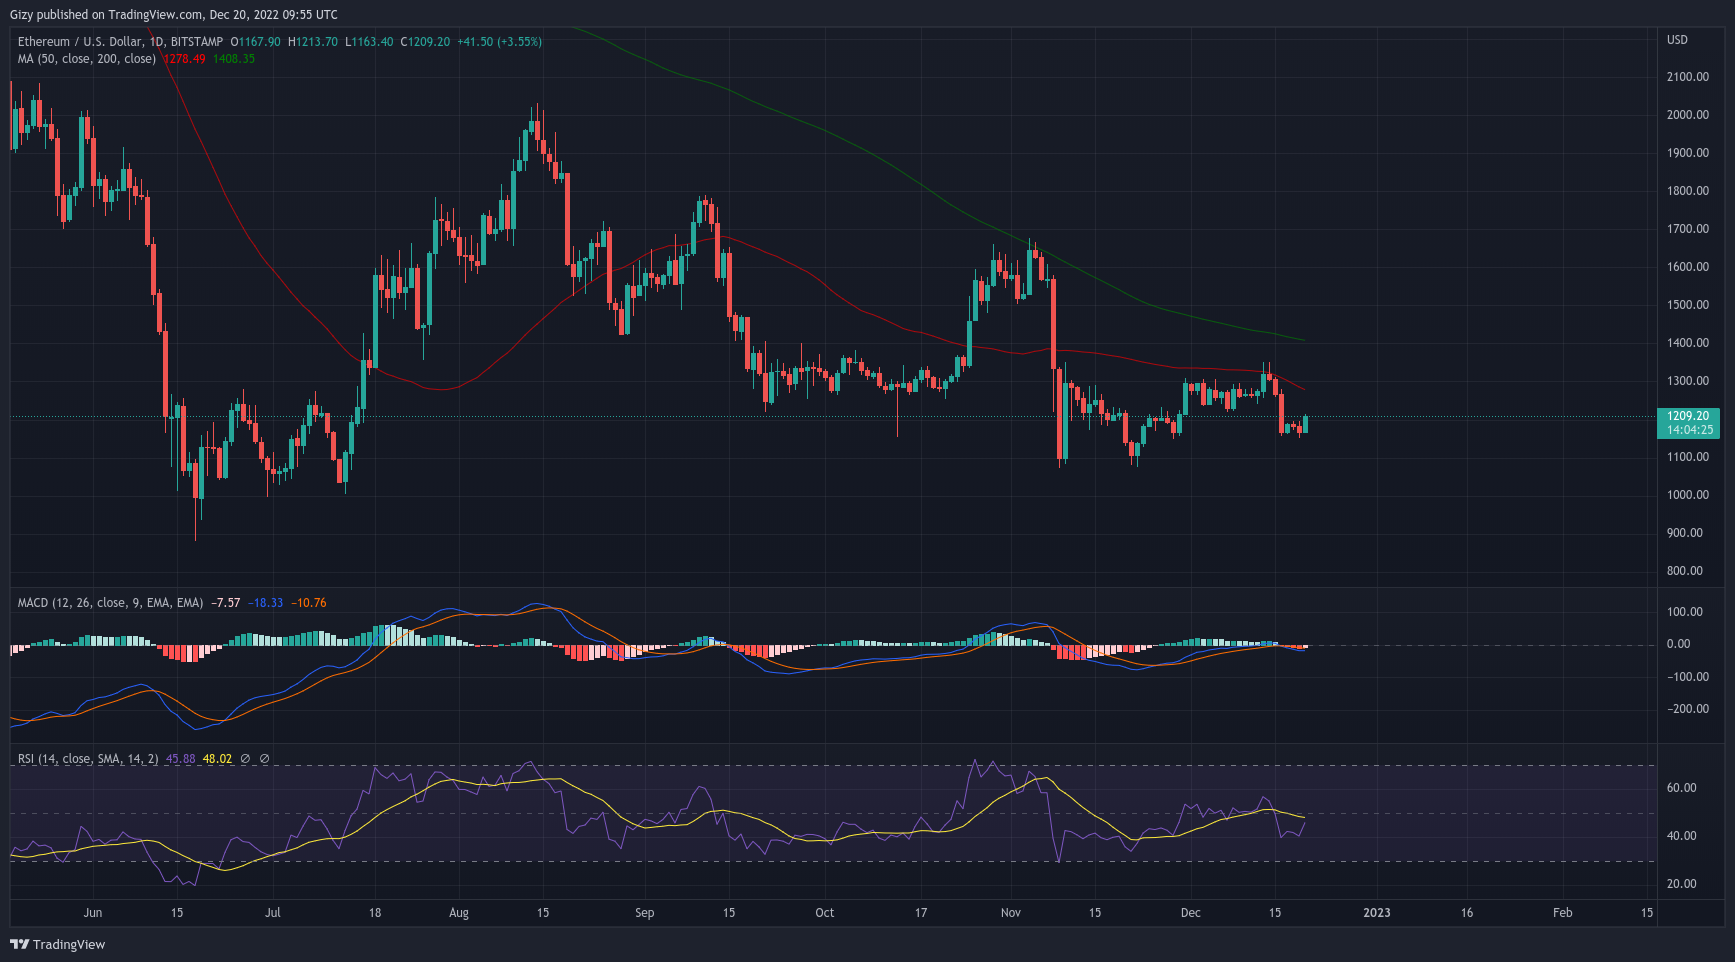
    2. Ethereum (ETH)

    Like the majority of cryptocurrencies, Ethereum experienced similar events. On the weekly, it may be one of the bullish assets because it shows more volatility. However, a poor start to the previous week left many people fearing further price declines.

    It began trading on Monday at $1,183 and tried to break the $1,200 resistance, but it experienced severe rejection at $1,194, and it failed. It fell to a low of $1,150 before closing only a bit higher. It consequently failed to record any significant price change.

    The following day, though, we spotted the week’s longest green candle, which signaled a change. It tested $1.2k once more after starting at $1,167. This time, it reversed and reached a high of $1,230 before quickly retracing, but maintaining the record.

    It gained more than 4% as it closed. On Thursday, ETH fell below the highlighted level and there was noticeably more volatility than usual. However, the bulls countered with a surge to $1,236, the week’s high.

    There was little change in value over the final several days of the session under examination. The current intraday session is not much better, and a little candle showing trading activity was also visible. On the weekly, it closed with increases exceeding 2%.

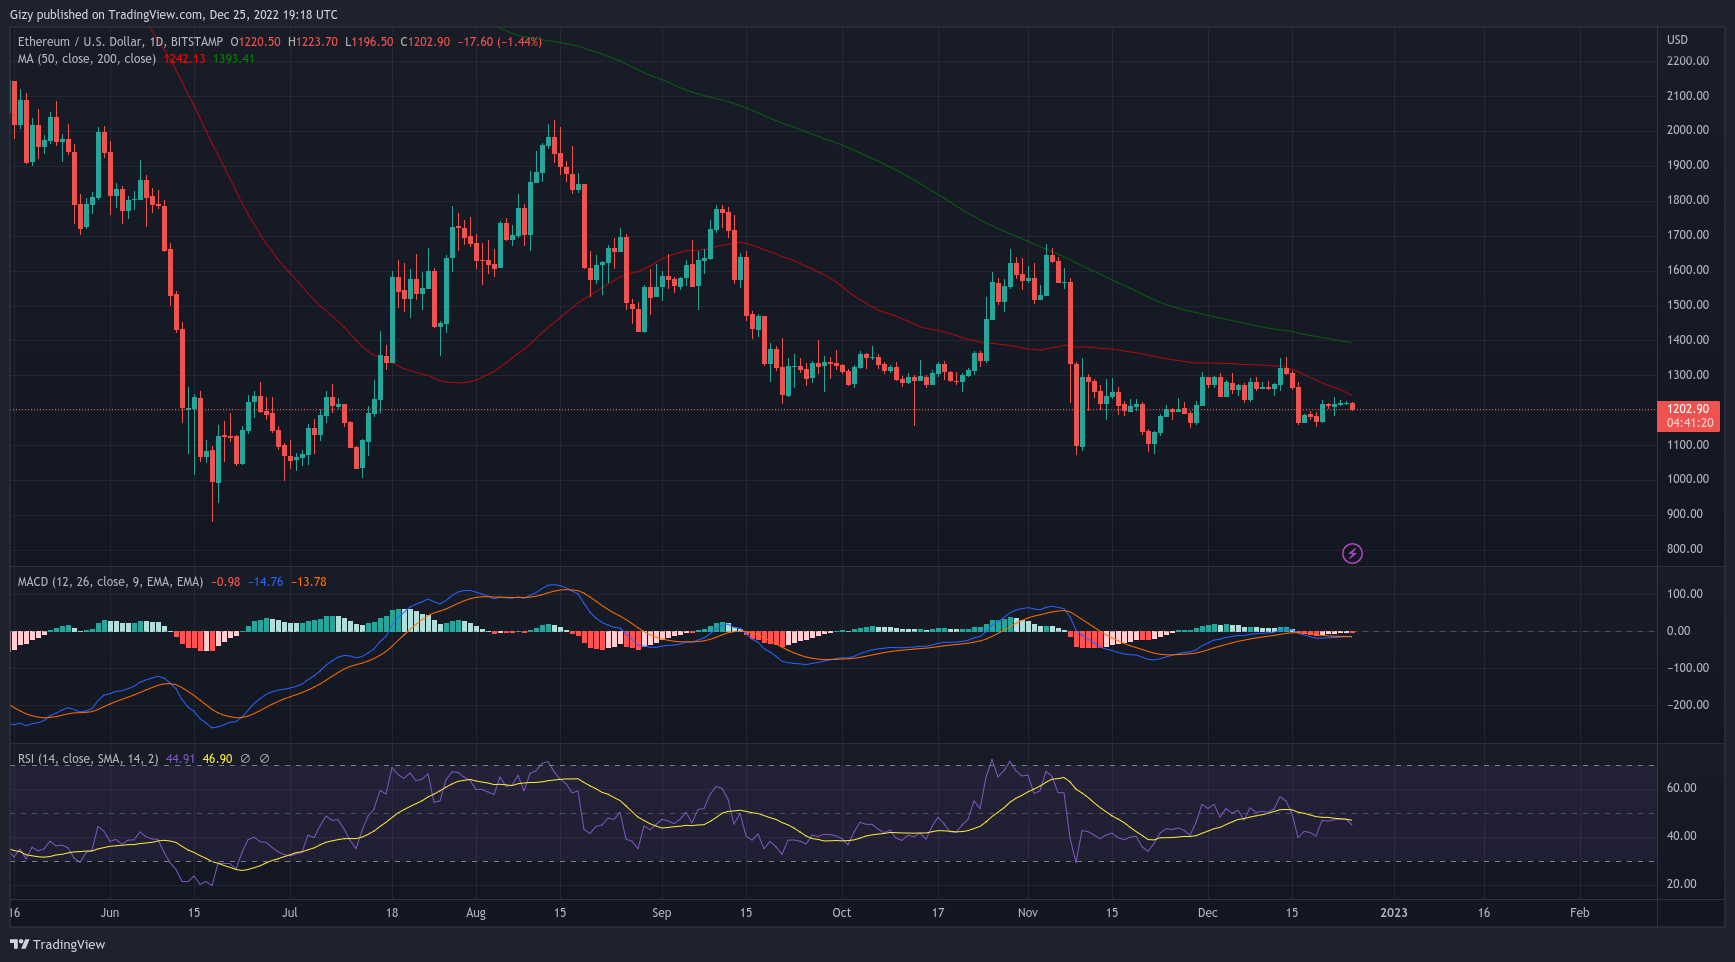
    The previous intraweek session also ended with several bullish readings on MACD. After a bearish divergence the previous week. On Tuesday, as a result of the coin’s big climb, the 12-day EMA began to rebound.

    There were hopes of a bullish divergence as both the 12-day and 26-day EMAs were in contact. This occurrence typically occurs before an upward trend. In light of this, we might anticipate further price hikes over the course of the following week.

    However, over the last 40 hours, we noticed massive stability in value. As a result, the anticipated divergence is not evident. Nonetheless, we may see more price tussle around $1,200.

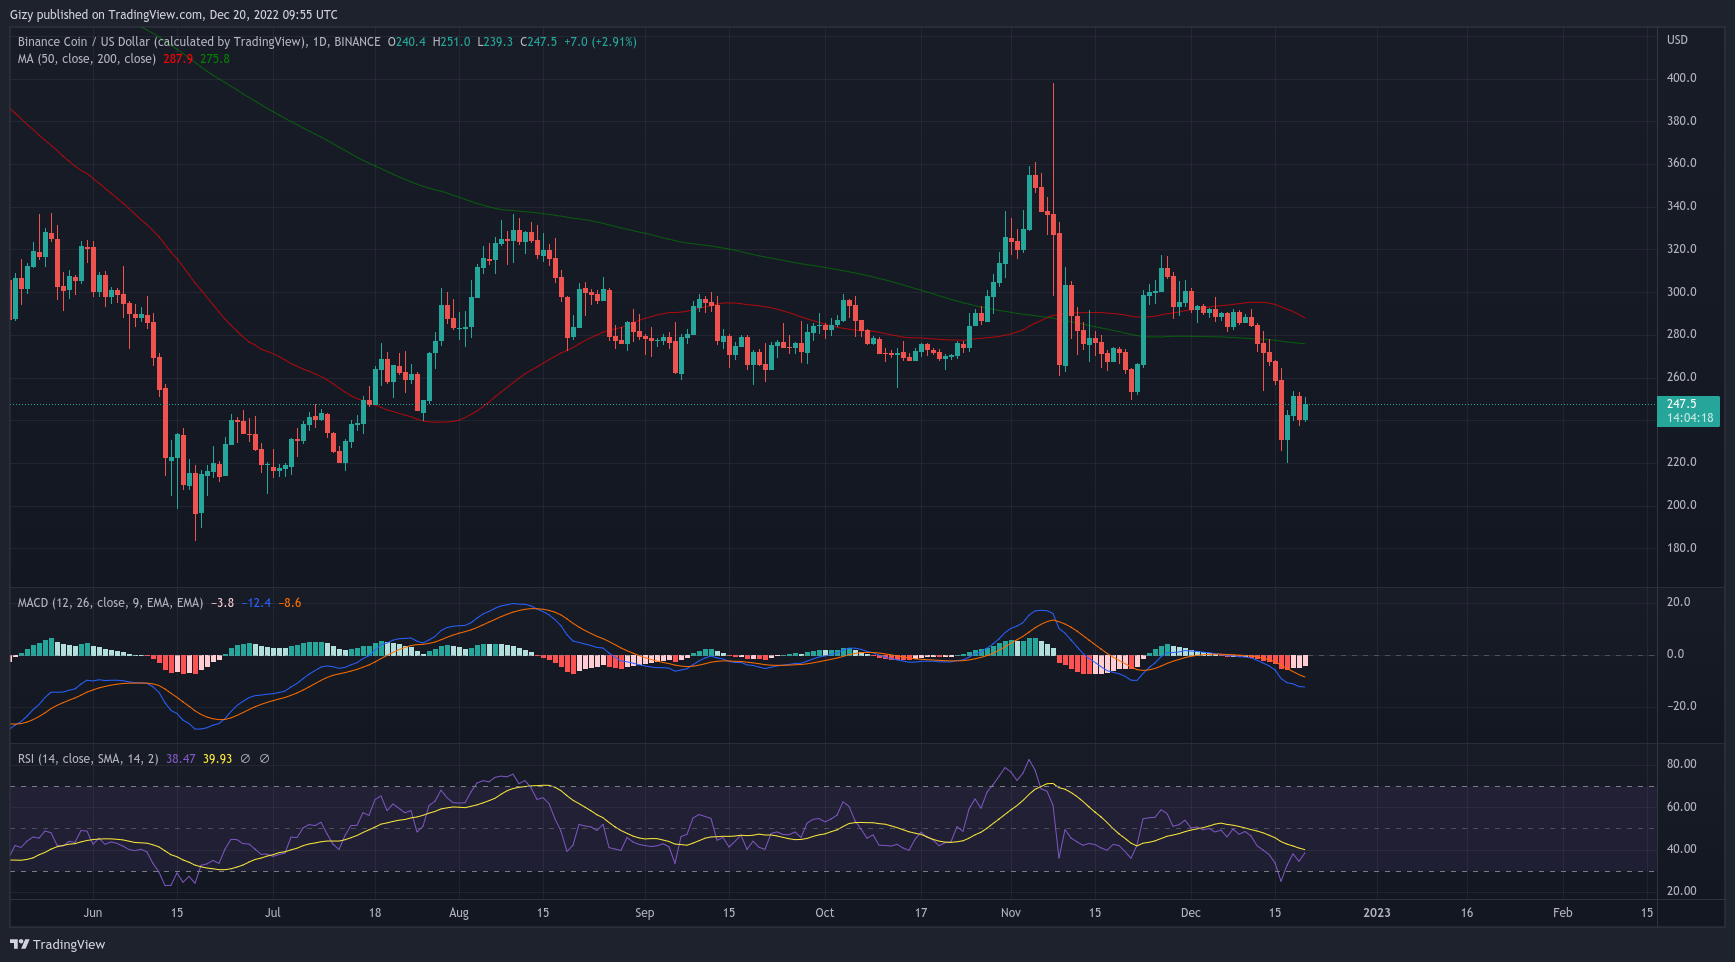
    3. Binance coin (BNB)

    In comparison to the previous three weeks, Binance coin’s price performance improved during the previous intraweek session. The coin witnessed limited trading volume over the time period under examination, which appears to be slowing the enormous dump.

    It had a poor week’s start, similar to the majority of cryptocurrencies, opening at $251. It fell to a low of $237 before rising somewhat and closing with losses of more than 4%. The next day, the downward trend ended.

    The coin soared from $239 to a high of $252 the following day, and the bulls orchestrated a big rise. It recovered from previous losses and increased to the week’s opening price. Unfortunately, the bears regained control the next day as BNB retraced to a low of $245.

    At the end of the session, it had lost 2.15%. Like the majority of cryptocurrencies, there were no notable price fluctuations during the past four days of the week due to low trading volume.

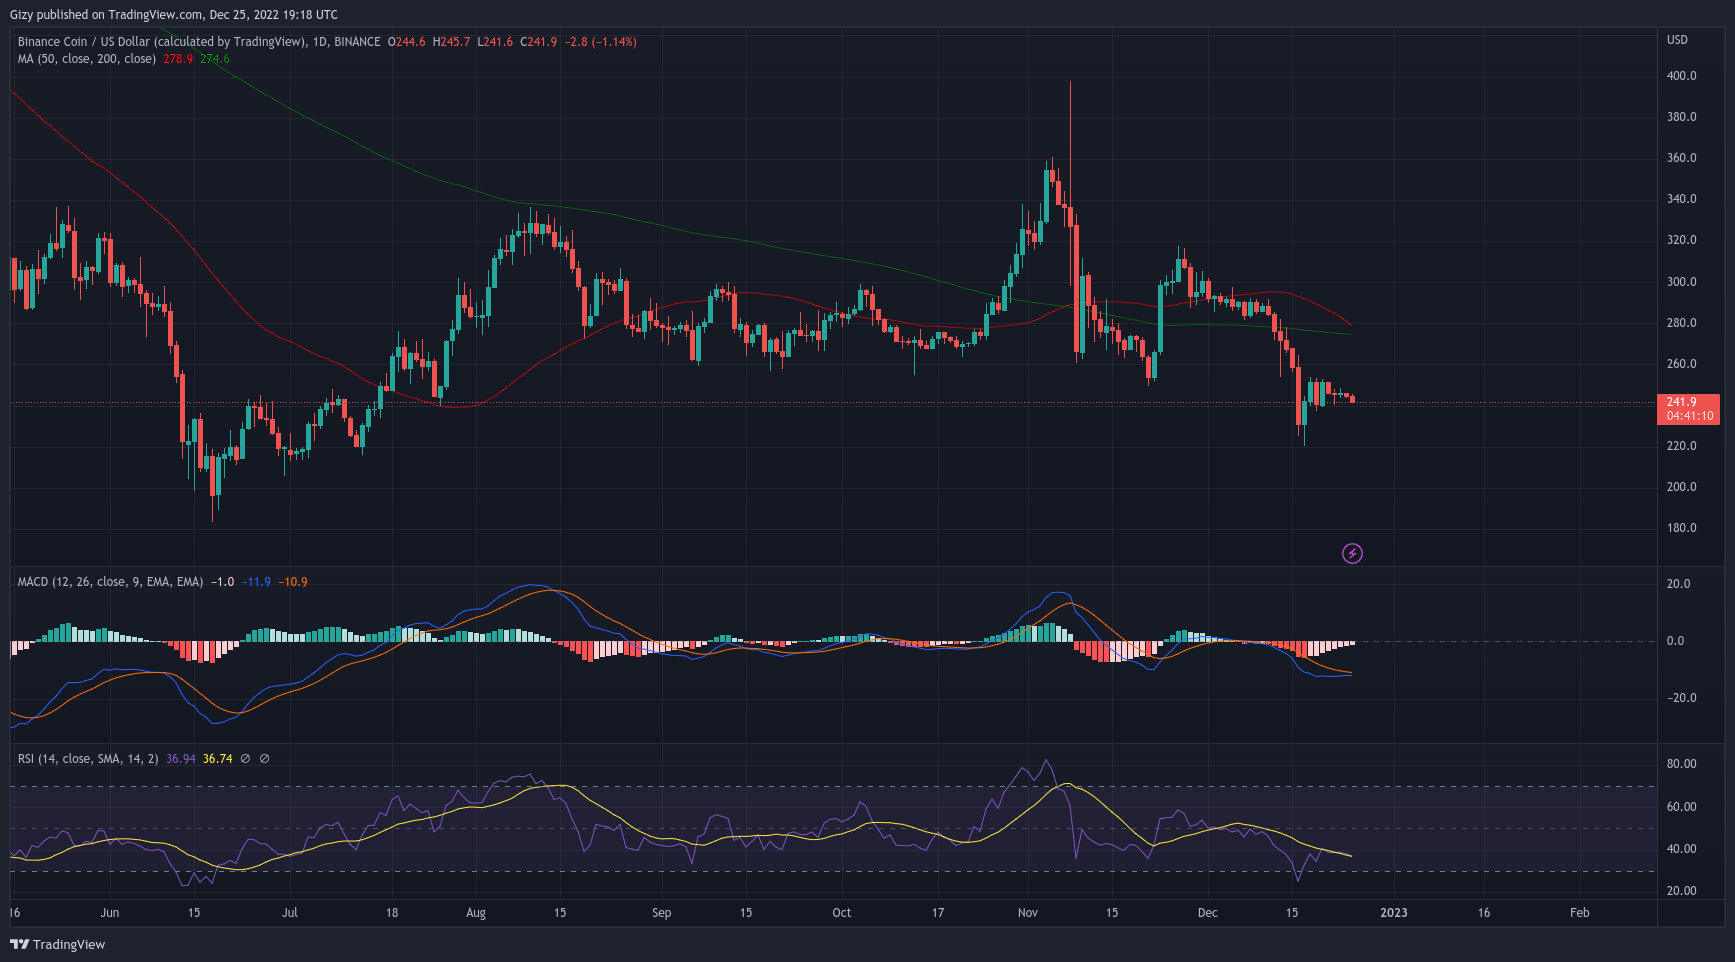
    Many looked forward to this week for several reasons. One such is the Moving Average Convergence Divergence. Recently, BNB displayed a bearish divergence. After a steep decline the prior week, the 12-day EMA decreased even further as a result of Monday’s price movement.

    A recovery that began on Tuesday was sparked by the price increase. There will soon be a divergence because the 12-day EMA and the 26-day EMA are currently so close to one another.

    At the time of writing, we noticed both metrics touching. BNB is also seeing small fluctuations in value. We may see an attempt to reclaim $250 and close the week at this mark.

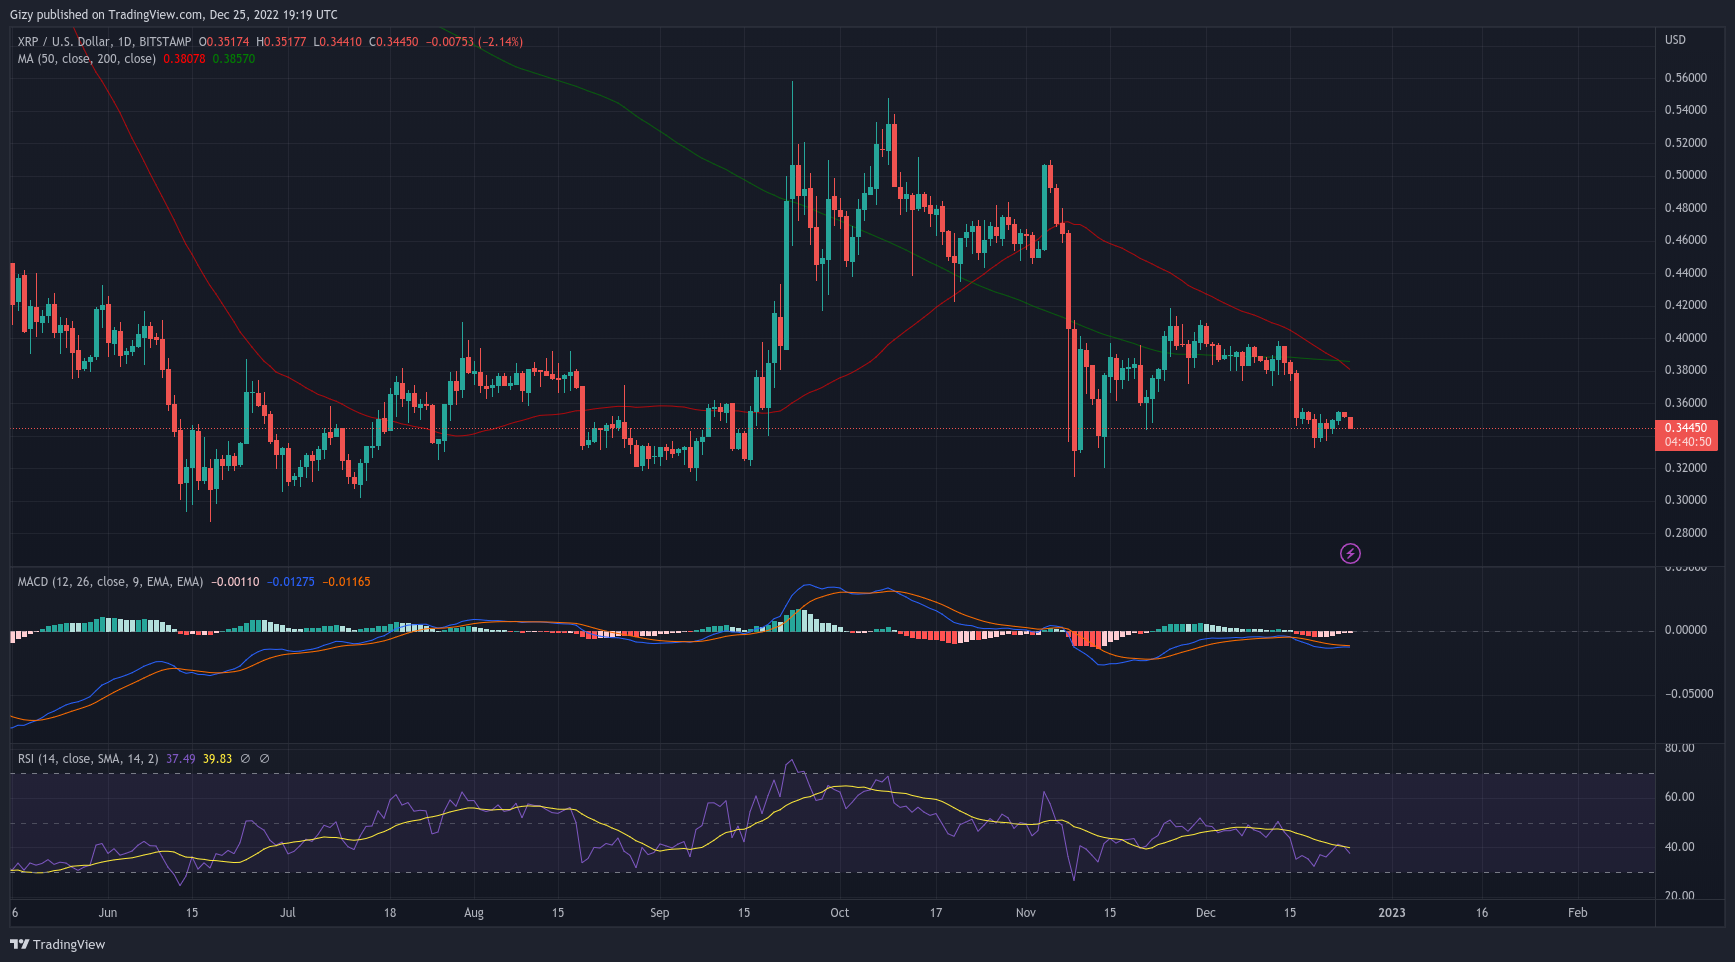
    4. Ripple (XRP)

    The previous week was one that saw ripple make attempts at reclaiming key levels. However, these effort seems to not be sufficient as we noticed a doji on the weekly. This is a clear indication that the altcoin closed the session under consideration with no notable increases.

    On Monday, it began trading at $0.35 and fell as low as $0.33. The bulls made an effort to recover during the intraday session’s final hours. As a result, the coin lost more than 3% and ended the day at $0.34.

    They increased their lead on Tuesday, which led to a $0.35 price high. It experienced heavy resistance at the mark, though, and reversed course to close at $0.348. Nevertheless, it gained roughly 3% at the closing.

    On Wednesday, it once again fell below $0.33, but it bounced back and closed the day at $0.34 with little change in price. The following day, we observed several attempts to achieve stability over $0.35.

    However, it failed due to a decline in trading volume. Nonetheless, it maintained the key which also affected indicators like MACD. A recent bearish divergence was seen in XRP. After a significant decline the previous week, the price movement on Monday caused the 12-day EMA to decline even more.

    A resurgence that began on Tuesday was sparked by price increases. A divergence is ready to narrow because the 12-day EMA and the 26-day EMA are currently so close to one another.

    True to these words, Ripple had its bullish divergence yesterday. This was a result of a more than 5% surge. We also noticed that surge is still present as the coin may close the current intraday session with notable gains. If the coin maintains the current momentum, we may see an attempt at $0.40.

  • Top Five Cryptocurrencies to Watch This Week (Dec 19)

    Top Five Cryptocurrencies to Watch This Week (Dec 19)

    The top five cryptocurrencies to watch this week saw notable decreases during the previous intraweek. This is also the same sentiment with the majority of crypto assets as they saw significant volatility.

    Many viewed this change in trend as the conclusion of the era of lower trading volume. A quick glance at the global cryptocurrency market cap revealed that the industry closed the previous week with very minor losses. It began trading at $850 billion and rose to a high of $885 billion during the day as the crypto market saw noticeable gains.

    Unfortunately, this price increase came to an end as the market started to decline. It decreased as a result, reaching a low of $796 billion. It recovered slightly and ended the day at $809 billion. This represents a more than 5% decrease from the open.

    Furthermore, it is difficult to dispute the impact of unfavorable fundamentals on the prior intraweek session. The increase in interest rates was one of them. The hike was announced by the Federal Reserve on Thursday.

    This increased pressure on most cryptocurrency assets that were already suffering from a negative CPI. A brief glance at the top 100 coins revealed that certain cryptocurrencies defied the general consensus to ultimately record significant gains.

    One such is toncoin, which had gains of more than 28% at the close of the preceding intraweek session. With an increase of more than 15%, XDC comes next.

    There is no expectation of any significant fundamentals this week. However, many traders are anticipating improved price performance. This week’s most promising cryptocurrencies will be discussed.

    Top Five Cryptocurrencies to Watch This Week

    1. Bitcoin (BTC)

    The past week was the worst run for Bitcoin since the beginning of December. It lost more than 4% during this time. The preceding intraweek session was the most volatile over the previous five weeks, according to the weekly chart.

    It overturned the previous bearish pattern of a bad start to the week. As a result, it recorded its first green on Monday, there was no discernible gain in value. The following day, the bulls extended their lead.

    For the first time in more than 14 days, the $18,000 resistance was retested. It crossed the threshold and rose to a high of $18,100, but it lost steam above the threshold and reversed course to settle at $17,772.

    Nonetheless, it ended the day up more than 3%. In spite of BTC reaching a high of $18,200 on Wednesday, it continued to climb at the level with success. It consequently dropped to its opening value.

    As the following two days were negative, that also signaled the end of any bullish attempt at $18k for the week. During that time, Bitcoin lost more than 5% and failed. Additionally, the currency lost more than 4% on Friday and fell below $17,000.

    In response, several signs blared warnings. The Moving Average Convergence Divergence is one example. The indicator revealed that BTC experienced a bearish divergence before the week’s end.

    Additionally, the Relative Strength Index dropped to 40. This week, these elements might work against the asset. Given that MACD is not showing any indications of recovery, we may anticipate further price declines. Nevertheless, price movement is accelerating.

    Following a bearish start, the current intraday session is seeing an attempt to reverse the losses. $17k should be kept an eye on because BTC might take it back.

    2. Ethereum (ETH)

    Ethereum had another volatile but negative week. Many people anticipated the previous intraweek session because they thought there would be significant rises. Unfortunately, it didn’t work out since things started to go south.

    However, there were noticeable rises on the first two days of the week. For Ethereum, Tuesday was the most upbeat day. Like the majority of cryptocurrencies, it had a strong start that resulted in a strong performance the following intraday session.

    It started out at $1,276 and fell a little before finding support, which allowed it to rise to a high of $1,350Nevertheless, it experienced rejection and retraced downward. It gained more than 3% at its closed. On Wednesday, we observed additional attempts to establish stability above $1,350.

    It reached the previous high but was unable to maintain it due to severe correction. It closed at its initial price, indicating no significant changes in values. The following two days were characterized by huge downtrends.

    It fell below $1,300 on Thursday and finished the day down more than 3%. The cryptocurrency lost another significant level on Friday, which caused the greatest loss. For the first time in thirty days, it fell below $1,200.

    After reaching a low of $1,156, the decline came to a halt. However, it recorded losses of above 10%. Due to this decline, ETH’s MACD showed a bearish divergence. RSI fell below 40 as well.

    This indicator showed no notable changes, and they continued to be bearish during the intraweek session. We might anticipate more retracements as the new week approaches. This was confirmed by the price movement from the previous intraday session.

    It is difficult to predict next price action as every metric is bearish. However, if the bullish trend continues, we may expect a retest of the $1,300 resistance.

    3. Binance coin (BNB)

    During the most recent intraweek, Binance coin lost more than 10% of its value. Let’s go over what occurred. As the week began, it dropped by almost 3%. In that intraday session, it lost the $280 support.

    The coin was about restoring lost levels, so the following day got off to a good start.  Nevertheless, the bears sparked a decline and pushed it to a lower low. For the first in over a month ago,  BNB retested the $250 support.

    When it rebounded to $253, the increase came to an end. It reached its opening price as it met buyback. Unfortunately, it was unable to recover and closed with small losses. The previous day’s bullish sentiment continued into Wednesday.

    It tried to break through the $280 resistance, but failed as it reached a high of $278. Similar to BTC and the vast majority of crypto assets, it retraced. BNB lost more than 3% of its value and hit a session low of $265. On Friday, It ahd it biggest downtrend as it dipped to a low $225. This is the first time since August the coin is dipping to this level.

    When it was over, it had lost more than 10%. There were other attempts at recovery that were effective during the latter two days of the week. The altcoin rose by more than 6% during the weekend.

    We may anticipate either of these outcomes if we concentrate on the week. We might anticipate recovery after the severe losses last week. An earlier forecast indicated a continued downward trend.

  • Top Five Cryptocurrencies to Watch This Week (Dec 12)

    Top Five Cryptocurrencies to Watch This Week (Dec 12)

    The previous week saw significant value stability in the cryptocurrency market. The sector under discussion began trading at $850 billion during the previous intraweek session. Looking at the chart reveals that for the majority of the week, it trended between these valuations.

    Reduced market volatility was the cause of this. The sector’s decline to its low for the week on Sunday marked the largest movement during the time period under consideration. It hit a low of $790 billion but bounced back before the intraday session ended.

    It ended the day with a valuation of $857 billion, showing no discernible change in value over the previous seven days. This remarkable inactivity may be attributed to a dearth of essentials.

    The cryptocurrency industry, however, experienced several changes. In order to prove that the money belonging to consumers is appropriately backed, Crypto.com published their Prove of Reserve. Bitnob will collaborate with Strike, a digital payment platform, to enable rapid payments across Africa.

    A distinct narrative emerges when the top gainers and losers are examined. Over the past week, Toncoin has increased by more than 25%. STX immediately increased by more than 15%. A stablecoin, USDN, suffered a loss of stability and fell by more than 20%.

    With a focus on the new week, there are indications of notable price increases. The price of cryptocurrencies is rising noticeably. Based on the global cryptocurrency market cap, this is the most volatile intraday session since November for the majority of cryptocurrencies. With this rise, the sector’s worth reached an all-time high of $877 billion.

    The gain the market experienced over the last 24 hours is a sign that this week may see additional price movement. Since there is no news that may jolt the cryptocurrency market, the media is nearly completely silent on the fundamentals front. Nevertheless, some crypto assets may do better in the future. Let’s discuss them.

    1. Bitcoin (BTC)

    The preceding week saw no appreciable advances for the apex currency on a weekly basis. This was a result of the market’s overall devastation caused by low trading activity. It failed to record any significant price changes during the first intraday session, similar to the prior trend.

    However, we saw that the coin made a try to test the $17,500 resistance but was unsuccessful since it encountered strong opposition there. Tuesday might be regarded as the coin’s worst-performing day.

    On Wednesday, we witnessed the week’s longest red candle. However, the asset’s value did not significantly alter from the prior 24-hour period. The following day saw Bitcoin’s largest movement.

    The apex coin increased from $16,838 to $17,229 before closing. BTC gained slightly more than 2% at the end of the time frame. As the cryptocurrency under review finished the week with losses of less than 1%, the final three trading days of the week were notable for their trading volume.

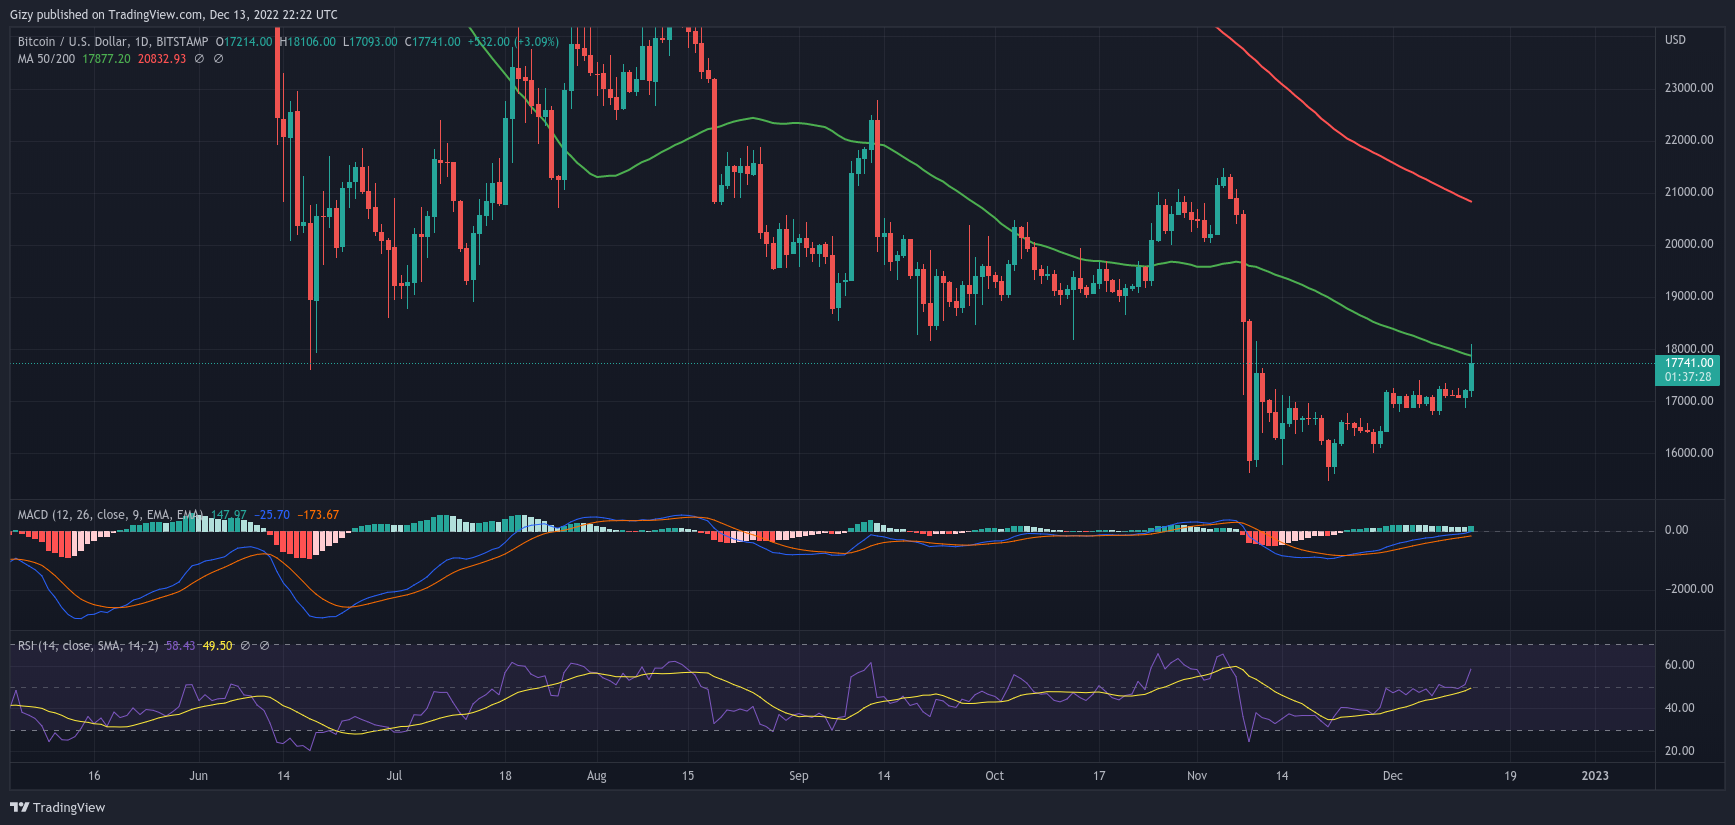
    During the previous intraweek session, the majority of indications were quiet. This was a result of the market’s generally low volatility. The Moving Average Convergence Divergence is rapidly approaching zero as it has continued to increase.

    Another indicator that offers no fresh insight is the relative strength index. Nevertheless, for the majority of the week, temperatures hovered around 50. We might anticipate greater action if we concentrate on the current intraweek session.

    What happened a few hours before this article was written provides one stark example of this. it was the first time in more than a month. The $18,000 resistance was tested and broken by the apex coin. Before correcting, it reached a high of $18,100.

    We may anticipate future price movement to the top or lower based on prior price moves. BTC might close above $18k if the bulls maintain their pace.

    2. Ethereum (ETH)

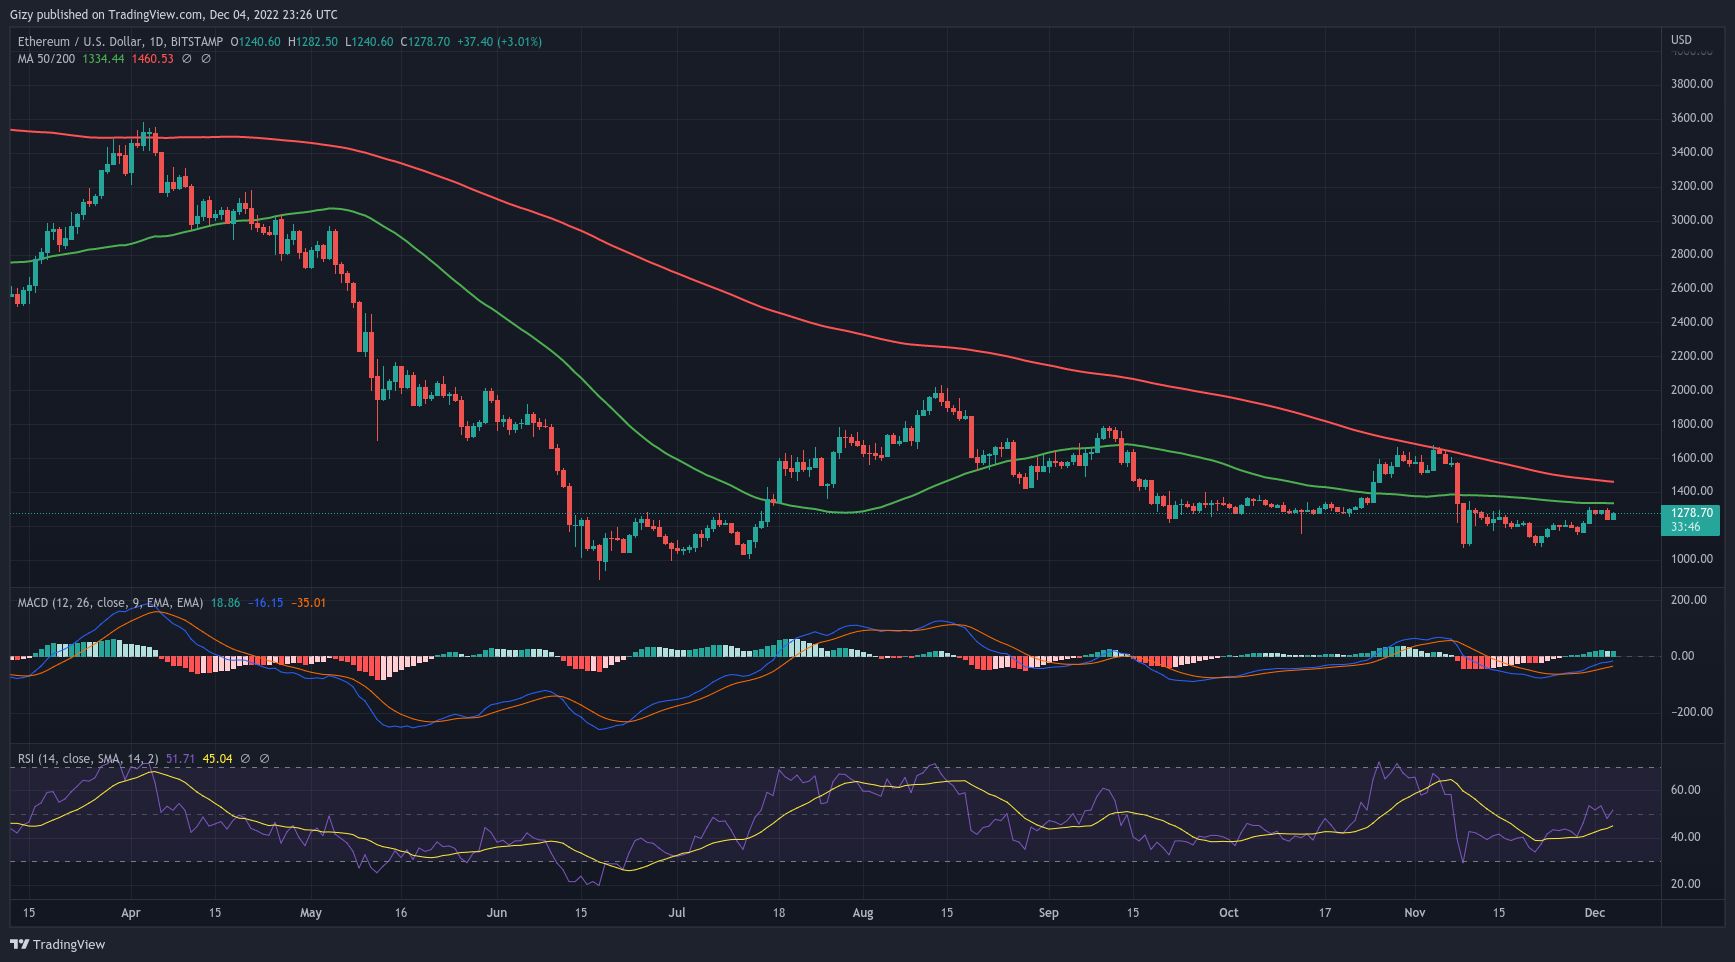
    The bulls were able to push the cryptocurrency to a high of $1,305 following a hard battle that saw it start out at $1,278. It was turned down, though, and fell as low as $1,247. On Tuesday, it had its first green candle.

    Unfortunately, it overlooked any discernible change in prices, as well as the general trend. The next day, ETH lost all of its gains, and the low volatility remained. It had the longest red candle of the week.

    It was the week’s longest green for the coin. The 24-hour cycle began at $1,231, and it reached a climax of $1,292. As the day came to an end, it rose by more than 3%. Over the course of the last three days of the week, volatility was at its highest.

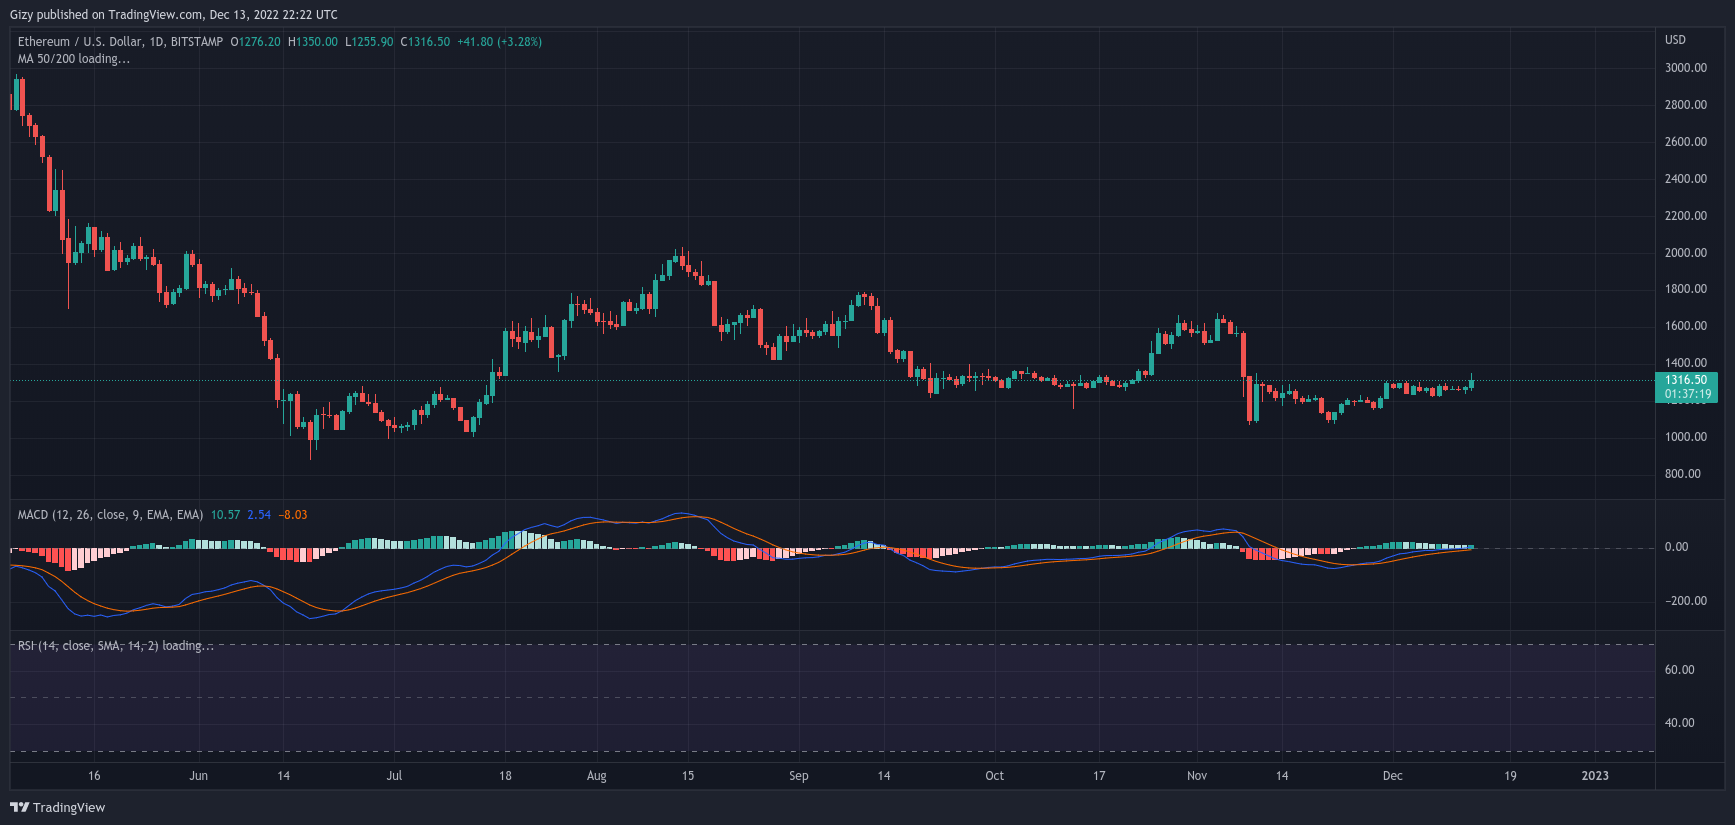
    Like most crypto assets, the largest altcoin did not see a notable change in these metrics. For instance, the 12-day EMA was still moving upwards while becoming closer to zero. Similar to its sibling, the 26-day EMA displayed a similar pattern.

    ETH witnessed around the same trading volume throughout the final three days of the week as it held onto 50, according to RSI. With the week in mind, it is challenging to forecast how the price will behave because the indicators have not changed.

    Additionally, there are no ongoing fundamentals that would provide a clue as to how ETH will perform. However, the biggest altcoin attempted to break through the $1,400 resistance a few hours prior to the time of writing.

    Despite failing in its efforts, it reached its highest point in more than 20 days at $1,350. We might witness other ascents. This might ensure a close of $1,400. Ethereum may experience a change in course if it loses momentum.

    3. Stacks (STX)

    STX was among the top gainers the previous week. Contrary to popular sentiment, the coin consistently increased throughout the previous seven days. The crypto asset ended the prior week up more than 14%.

    Along with the rise, we also observed the extreme volatility it exhibited. On Monday, it peaked at $0.26 from an opening price of $0.24, setting the trend. Despite falling from the peak, it ended the session up by more than 4%.

    The next intraday came to a conclusion without a major price movement. However, it reached a high of $0.27. The coin experienced its worst day on Wednesday, falling to a low of $0.24. After the session, there were losses of more than 2%.

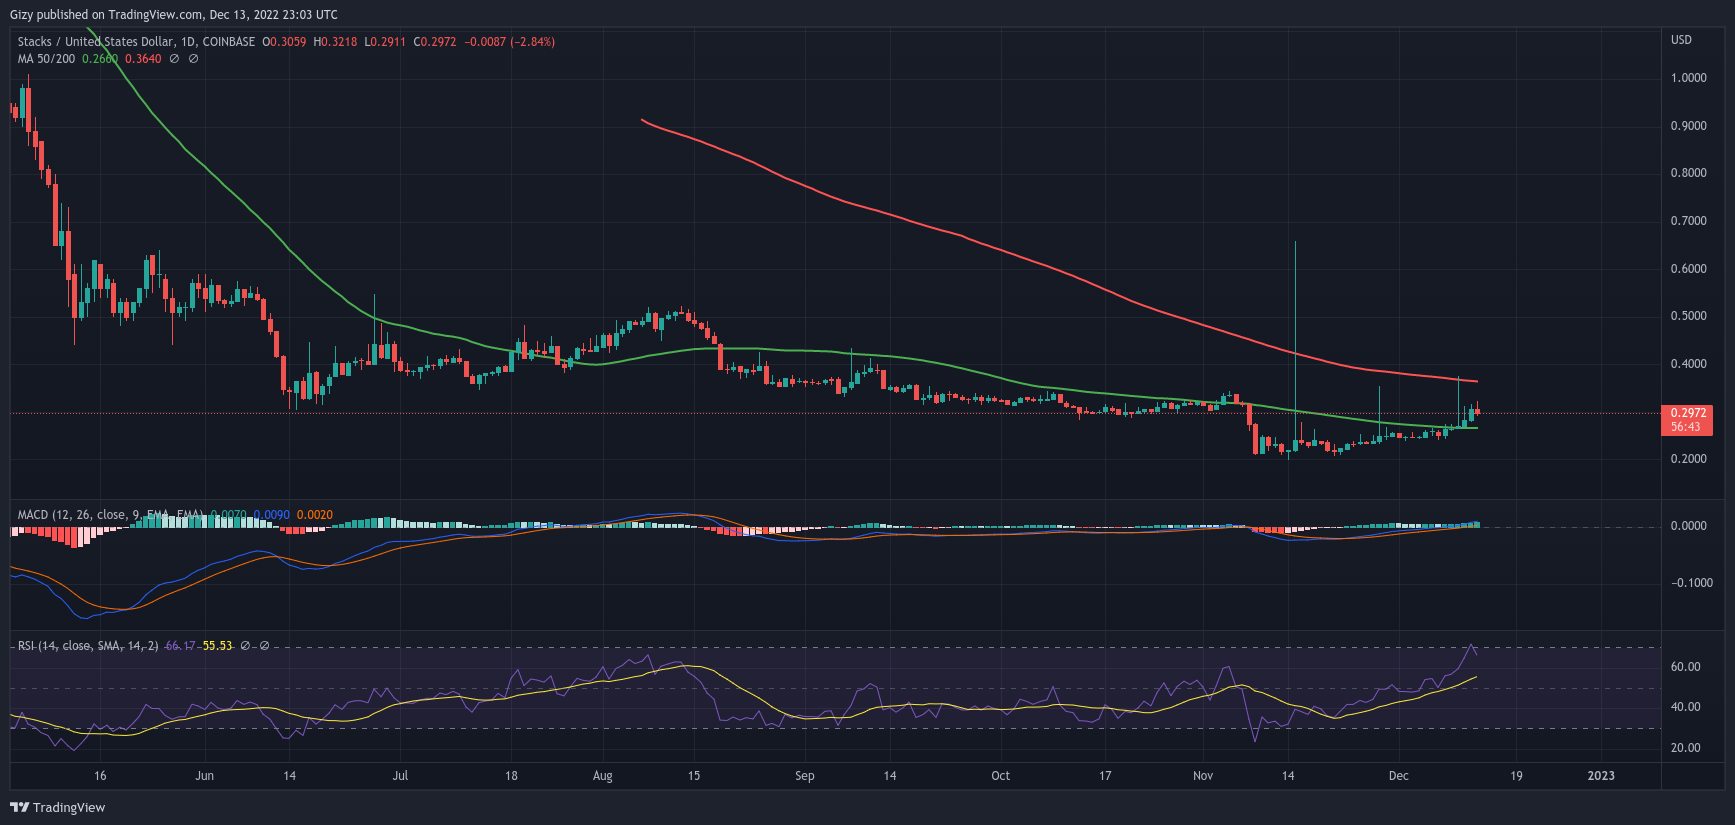
    The week’s biggest high occurred on Saturday when STX recorded its highest level. When the intraday session began, the price of the cryptocurrency was $0.26. It reached a high of $0.37, representing a rise of more than 24%.

    At its height, it met a strong rejection. It reversed to just above its opening price and ultimately failed to show any appreciable gains. We can draw the conclusion that STX finished its intraweek session on Sunday with one of the best gains.

    It had a positive change of more than 4% at the end of the intraday session. There was a lot of movement in the area of the indicators. The Moving Average Convergence Divergence is the first measure to pay attention to.

    As the steady increases persisted, we observed that the 12-day EMA underwent a tremendous jump. The RSI, which concluded the previous intraweek session at 64, is likewise rapidly approaching 70. Focusing on the coming week, we might anticipate sharp drops.

    The RSI is above 70, which is one factor supporting this conclusion. STX is overbought and due for a correction.

  • Top Five Cryptocurrencies to Watch This December

    Top Five Cryptocurrencies to Watch This December

    This December, many are looking forward to massive rallies across the crypto market. Unfortunately, most cryptocurrencies are not seeing these increases. They seem to be continuing the previous month’s sentiment.

    A clear indication of this is the global cryptocurrency market cap.  It opened November worth more than $1 trillion. It peaked at $1.05T before experiencing a massive downtrend that saw it retrace to levels it hasn’t in a long while.

    It dipped to a low of $790 billion as most cryptocurrencies dipped to their lows. It recovered as the session continued but failed to surge to the opening price. The eleventh month closed at $860 billion.

    This is an indication that the crypto market lost more than 15%. The question on every trader’s mind at this time is if December would offer better performance. Let’s look at some factors.

    Fundamentals

    There are several indications of further downtrends. This month, the Feds will hold a meeting. They could raise or decrease interest based on prior meetings. Based on prior market responses to these remarks, we might predict a change in the asset’s value.

    Furthermore, it’s important to remember that an increase could lead to a large value loss while a decrease could lead to further price increases. Aside from this, a lot of individuals anticipate December 13 with anticipation.

    The Consumer Price Index will be released at this moment by the proper authorities. It might have a similar impact on the price of the biggest altcoin as interest rates do. During the last release of the CPI, the crypto market saw notable increases.

    This was a result of the decrease in inflation that spread a lot of positivity across the sector. As a result, the value started to recover. If all these fundamentals turn out positive, we may expect the same reaction across the market.

    With a brief overview of how fundamentals might play out. Let’s look at how some assets will perform.

    Top Five Cryptocurrencies to Watch this December

    1. Bitcoin (BTC)

    During the previous month, More than 22% of Bitcoin’s value was lost during the first week of November. Following the FTX event, there were numerous daily drops before this happened. As a result, MACD started moving in a bearish direction.

    The 12-day EMA reversed as the longest candle of the month formed. The indicator runs the risk of diverging if the market conditions don’t get better. Two green candles on the chart assisted in halting the downturn.

    As a result, there was some convergence. There is still a concern because the 26-day EMA is rising and is about to cross the 12-day. Retracements were seen in the Relative Strength Index as well.

    Following the way prices played out during the previous 30-day period, many are looking forward to better price performance. However, aside from fundamentals, the chart are hinting at significant downtrends.

    Bitcoin had its bullish divergence a few days back. This heralded the start of the increases that ensued. While many celebrate this feat, others are worried. The main cause of concern is the Moving Average Convergence Divergence.

    Following the positive cross, there are strong indications that the asset may see a trend reversal in the coming days. This claim is more likely with the discovery of a hammer candle stick. This means that the asset may be gearing up for further decreases.

    It’s hard to say exactly when this will happen. However, there are clear indications that this may take place within the next seven days. The decrease in the Relative Strength Index is another indication of an impending bearish round.

    With regards to key levels to watch, there are several. The mark is now trading around $17k, but a small shift in trajectory might cause it to alter. The $15k barrier is the next threshold to keep an eye on. Retesting indicates a significant downturn, and a flip might lower the asset under consideration to $14k.

    On the other hand, we might observe additional attempts at critical resistance. The $17k ceiling is first on the list. Based on historical price moves, although trading around it, we might see it miss the mark and then make it before a decisive breakout.

    The $18,000 resistance has a great possibility of also breaking. The $21k is the biggest and toughest negative barrier.

    2. Ethereum (ETH)

    During the previous month, the Moving Average Convergence Divergence saw a lot of movement. The longest candle of the month came as the 12-day EMA dipped. If market circumstances don’t improve, the metric will risk divergence. The chart’s two green candles helped to slow the decline.

    There was no complete divergence. The 26-day EMA is on an upswing and is on the verge of intersecting the 12-day, so danger still looms. The Relative Strength Index experienced retracements as well.

    The indicator fell to a low of 38, sparking concerns that the asset might be oversold. As RSI rose above 40 before the end of the time period under review, this worry diminished.

    We see the same sentiment during the first week of December. With this in mind, we may conclude that ethereum may trade sideways before a major significant breakout, a closer look at earlier market movements. One such instance occurred in October.

    Every day throughout this time, ETH fluctuated by 2%. There are signs that the asset would experience a similar situation for most of the ensuing twenty-seven days. We might observe a trend between $1,200 and $1,400 this time.

    We can foresee a decline or a climb to levels that many people do not expect based on fundamentals. Retesting the support level of $1,000 is one such mark. The main catalyst for a breakout will be the release of the monthly CPI.

  • Top Five Cryptocurrencies to Watch this Week (Dec. 5)

    Top Five Cryptocurrencies to Watch this Week (Dec. 5)

    Most cryptocurrencies to watch have shown tremendous improvement in price. During the last seven days, the crypto market recorded notable changes that reflected in the global cryptocurrency market cap.

    It opened the previous week at $843 billion but retraced as the prices took an unexpected turn. As a result, it dropped to a low of $814 billion. However, as the intraweek session progressed it recovered.

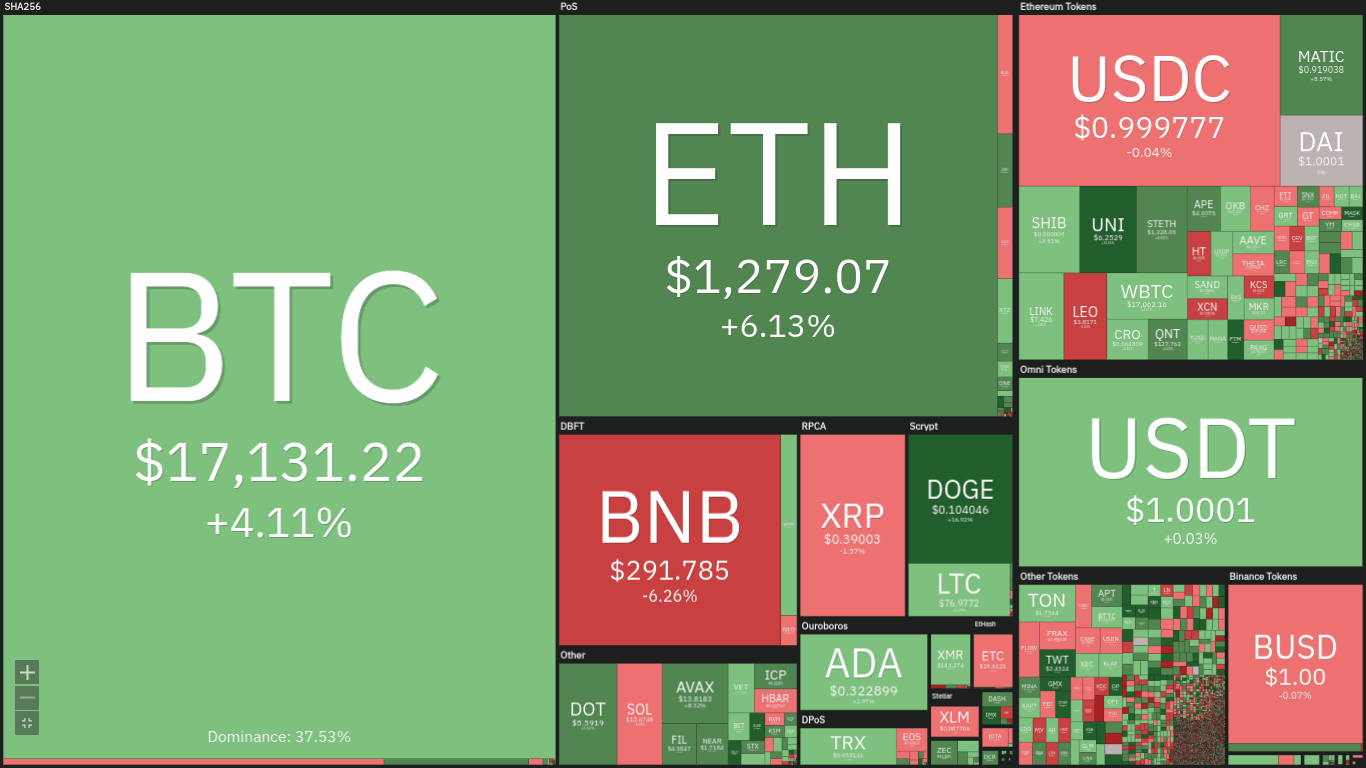
    The sector’s valuation closed at $858 billion, which signifies little increase across most cryptocurrencies. The image below sheds more light on the sentiment that permeated the market over the last seven days.

    The first notable thing in the figure above is BNB. We noticed that Binance coin is red, indicating that it lost a certain amount of its value. Nonetheless, this was not the biggest loss of some coins in the top 100.

    XCN lost more than 20% during the previous week. On the bullish side, FTM surged by more than 30%. The second runner-up is GMX as it gained more than 20%. With regards to fundamentals, there are many.

    Crypto-exchange Kraken cut down staff by 30%. SBF came out with a claim that he only has $100,000 left in his bank account after the FTX collapse. The new week is looking a little dull as there are no big fundamentals.

    Nonetheless, most /cryptocurrencies are gearing up for notable price movements. Let’s see how they will perform.

    Top Five Cryptocurrencies to Watch

    1. Bitcoin (BTC)

    The past week marked the last seven-day period of the previous month. The bulls made their last-ditch effort to see the asset reclaim lost levels. Price action shows that it recorded considerable increases.

    The first mark everyone was keeping an eye on was the $17k resistance. Following a small decrease on Monday, fears of more downtrends gripped the market. However, the concerns came to a minimal level on Tuesday.

    It gained more stability above $16k as it closed at $16,400. The coin flipped the $17k resistance on Wednesday as it peaked at $17,233. It had its biggest increase of the week during the intraday session as it gained more than 4%.

    The last four days of the week were marked with no notable change in price. On a weekly scale, the coin closed with gains of more than 4%. A look at the indicators sheds more light on what transpired.

    Following the bad start to the intraweek session, most metrics resumed their uptrends and maintained their previous momentum. Shifting focus to the current week, we are seeing a replica of the previous seven-day period.

    During the previous intraday session, bitcoin failed to register any notable ‘gains. Although the candle was red, there was  no notable price change. The same sentiment is playing out at the time of writing.

    Nonetheless, one of the key levels to watch over the next five days is $17k. Although trading closer to this mark, BTC must gain stability above it to retest $18k. We may see one of the biggest moves of the week over the weekend.

    2. Axie Infinity (AXS)

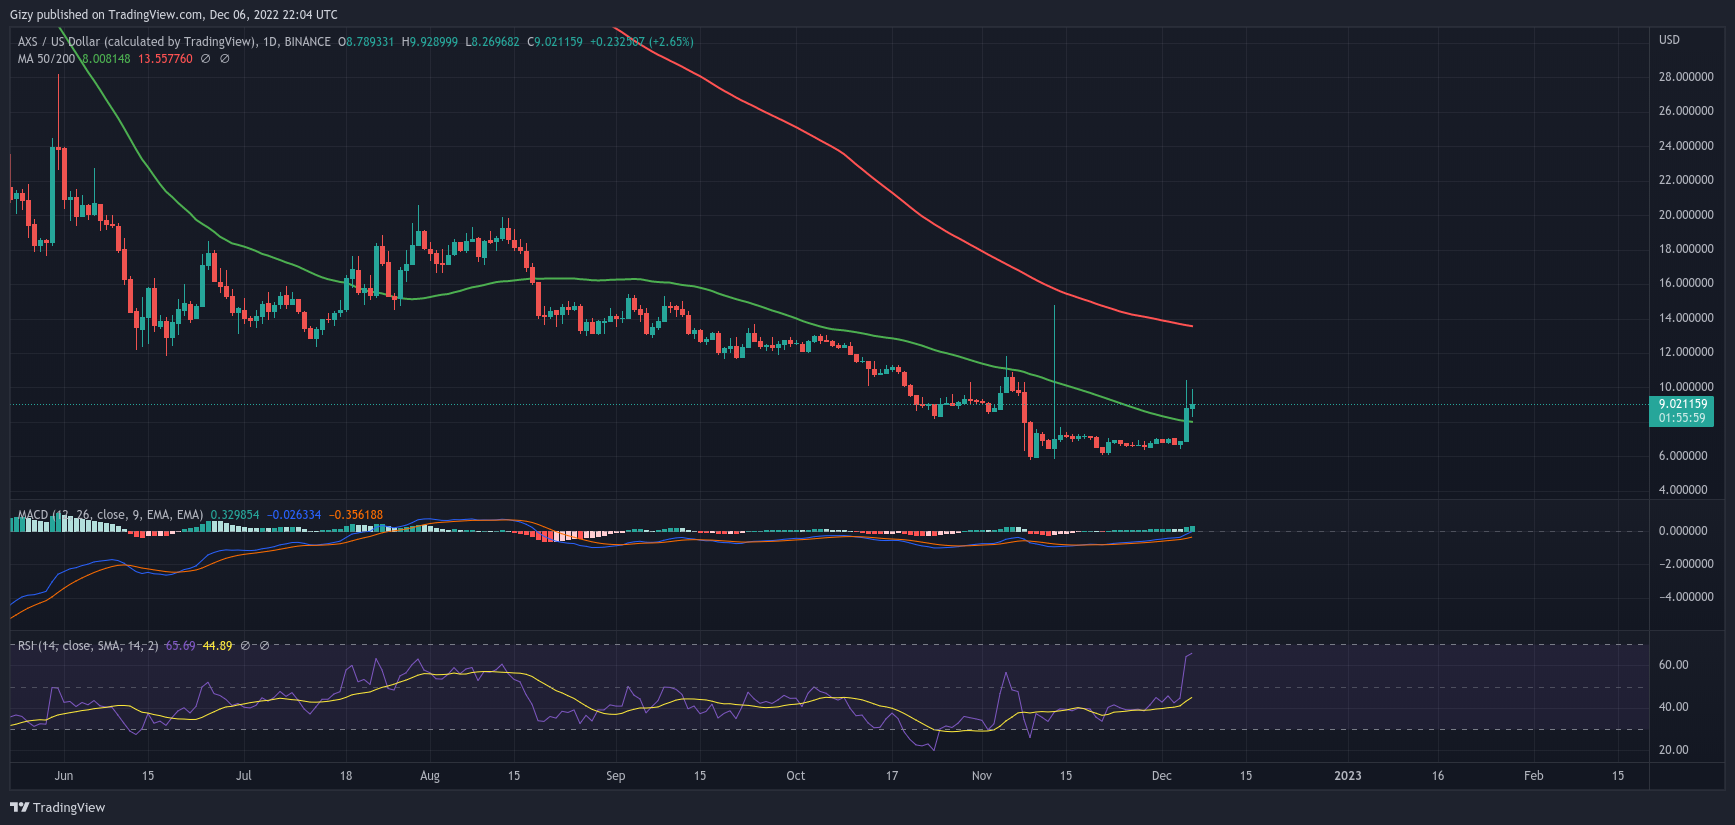
    During the previous week, AXS was mostly stagnant with no changes in prices over the last seven days. The main trend at the time was recording losses or gains of less than 3%. However, the coin saw one of its biggest moves of the week on Wednesday.

    After an unfruitful Monday, the bulls staged a comeback on Tuesday. The uptrend continued into the next intraday session. During this period, the altcoin retested the $7 resistance and gained a level of stability above it.

    It held on to the mark until the end of the 24-hour cycle and closed with positive change worth more than 3%. It lost the highlighted support on Thursday as it closed at $6.8 and lost almost 3%.

    It recovered the same amount the next day and the trend continued till the end of the intraweek session. On the weekly scale, there was no notable increase in price. However, the candle was green.

    This week, AXS like most cryptocurrencies, is seeing stability in price. This happened as the coin is seeing massive selling congestion at $9. During the previous intraday session, Axie Infinity had one of its biggest surges.

    It retested the $10 resistance and peaked at $10.4. It retraced but closed with notable increases. Monday closed with a positive change of more than 27%. Following such an increase, many are looking forward to seeing how prices will play out over the next five days.

    Based on previous price movements, we may conclude that price action over the last 48 hours may be the largest this week. During recent short bursts, there was no notable increase or decrease afterwards. The same may play out.

    3. Synthetix (SNX)

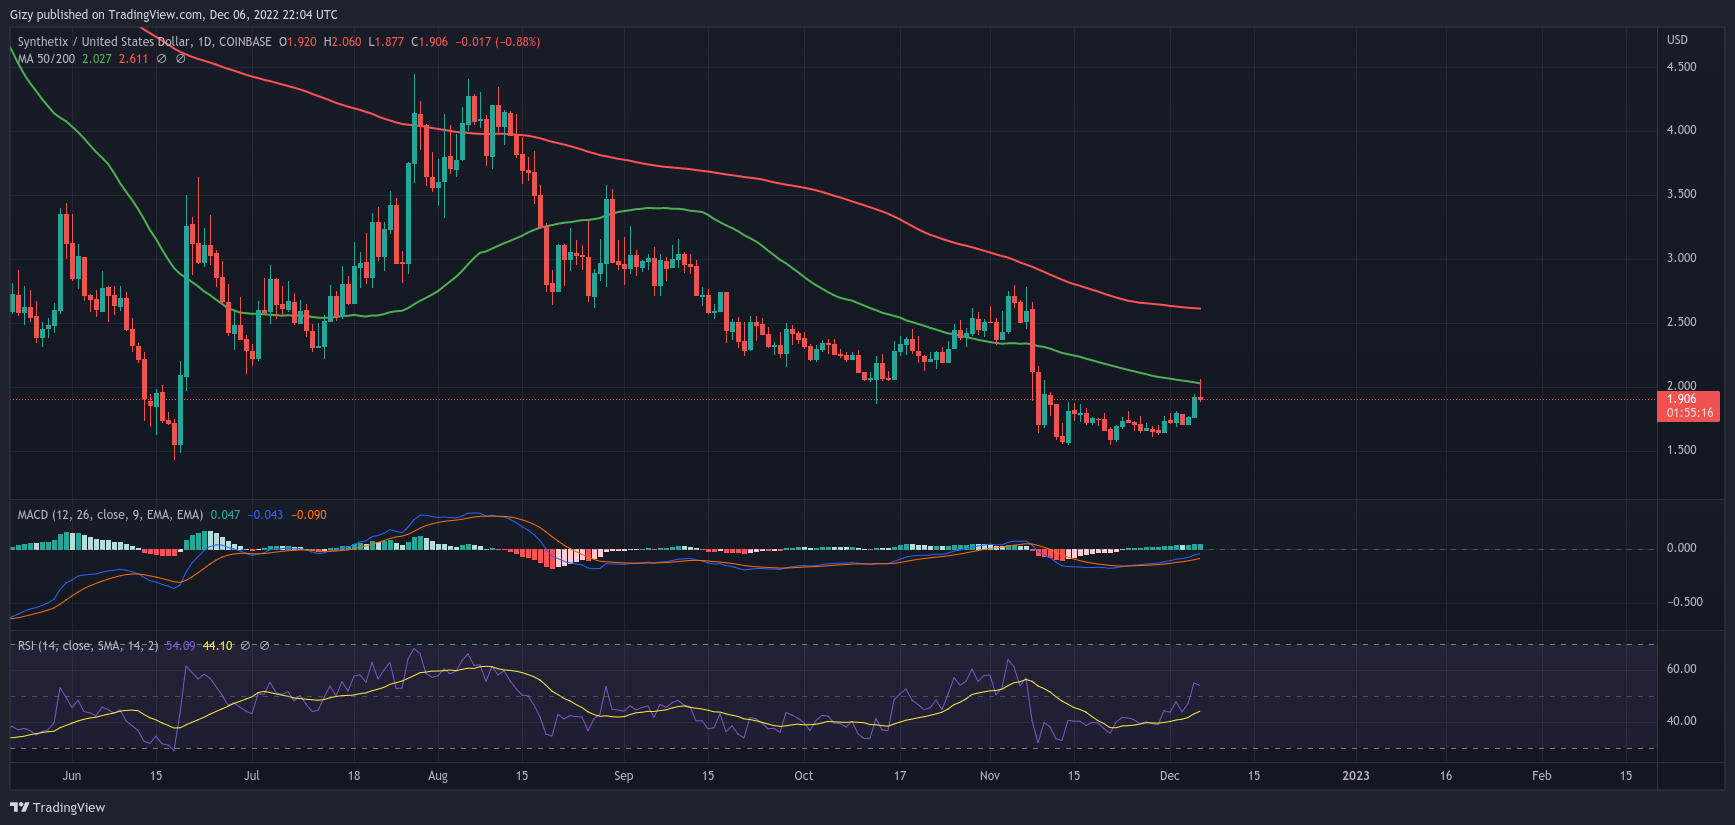
    The previous week was one of the most bullish for Synthetix. The first two days of the intraweek session were marked with reduced volatility as the coin failed to record any notable gains or losses.

    Nonetheless, both candles were red. The low trend came to an end on Wednesday as it picked up momentum. It opened trading at $1.64 and made progress to a high of $1.77. Although it faced a small correction, it closed with gains of more than 5%.

    The bears tried staging a downtrend during the next intraday session. As a result, SNX failed to register any notable increase. Additionally, it had very little impact on price as it lost less than 1%.

    Friday was another bullish day for the altcoin. The cryptocurrency started the day at $1.72 and peaked above $1.8. It ended the period with more than 4%. The last two days of the week saw both the bulls and bears gain almost equal dominance on the market.

    There is no further information with regards to indicators as they pass limited information since the bullish divergence two weeks ago. Nonetheless, SNX closed with positive change exceeding 5% on the weekly.

    The new week is looking more promising as the altcoin just had one of its best starts to the intraweek session. It had a quick shot to $1.94 from its opening price of $1.7. It ended the intraday session a little lower but registered gains of more than 9%.

    SNX is still on the bullish path as we noticed another green candle representing the current intraday session. A few hours to the time of writing, it retested and flipped the $2 resistance. It faced strong resistance at the mark and retraced.

    The highlighted level is still one of the vital levels to watch. We may see the cryptocurrency struggle to gain dominance above the said level with limited success before the end of the week.

    4. GMX (GMX)

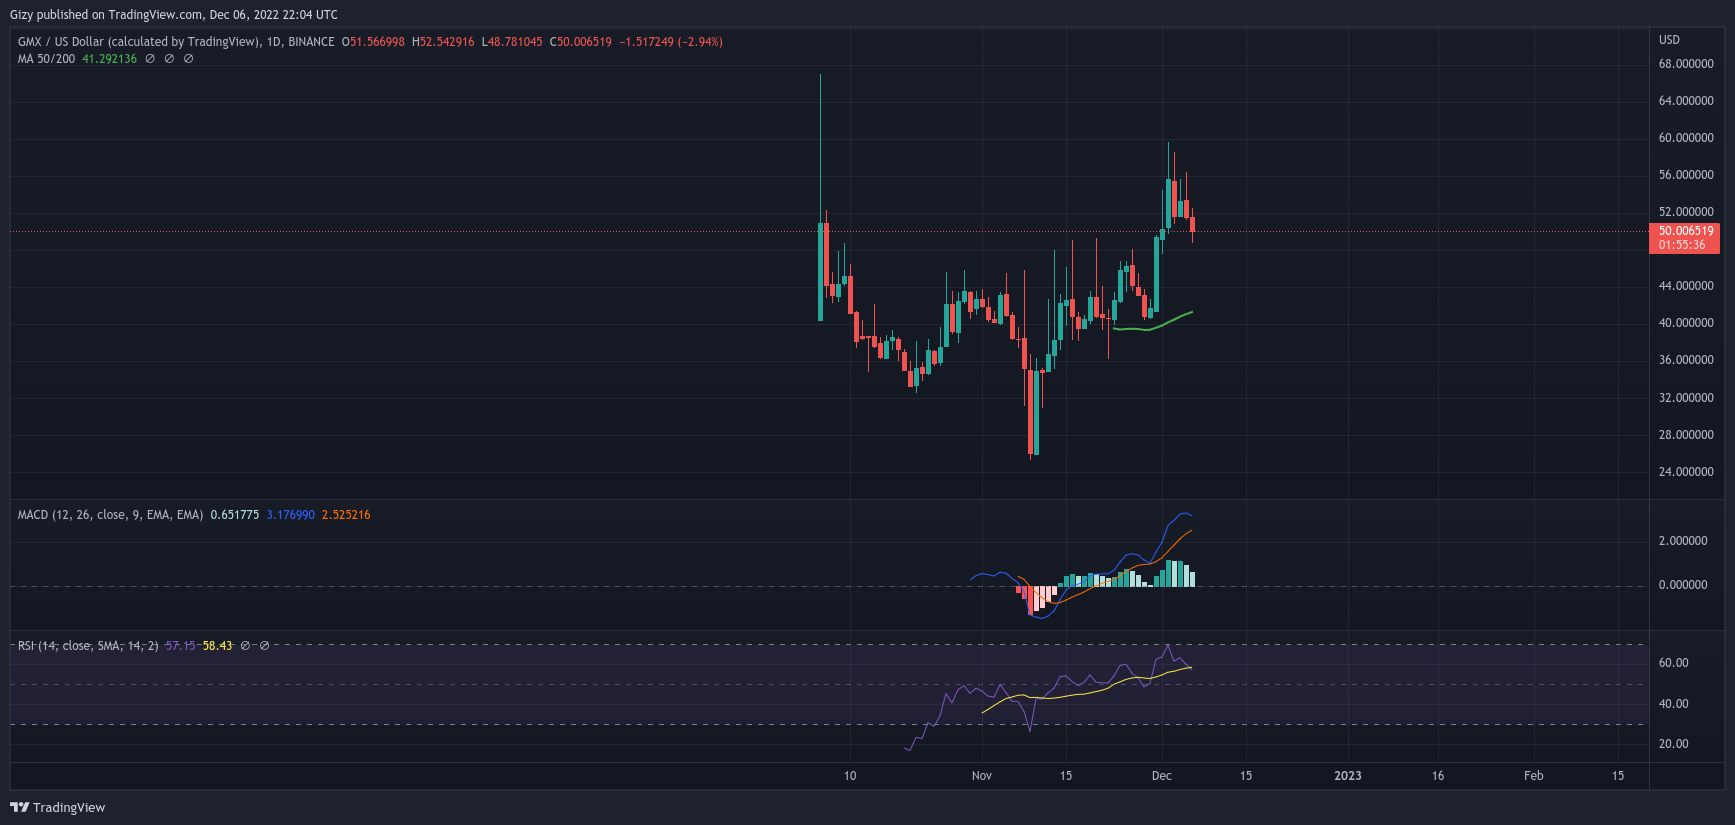
    Although a fairly new asset to the crypto market, GMX is seeing massive increase that is piquing the interest of investors. One such took place during the previous week. Like most cryptocurrencies, it had a bad start to the week.

    The cryptocurrency lost more than 5% last week Monday. As a result, fears of massive downtrends spread. However, these concerns were allayed during the next intraday session as the coin had its first green.

    The uptrend was in full gear the next day as the altcoin opened trading at $41. It tried to retest the $50 resistance but failed as it faced a strong rejection $49. Nonetheless, it registered its biggest increase as it closed with more than 18%.

    It broke the highlighted level during the next 24-hour cycle. It surged to a high of $54. However, like in previous times, it failed to hold to the mark. It experienced a massive correction and failed to record any notable price changes.

    Another massive pump happened on Saturday. This time, the bulls aimed at the $60 resistance but failed. Nonetheless, it closed with gains of more than 10%. This massive pump led to RSI peaking at 68.

    This explains the massive the notable decrease in price over the last 44 hours. During the previous intraday session, GMX lost more than 3%. There are indications that the same may take place during the current intraday session.

  • Top Five Cryptocurrencies Bubbling Under the Top 100

    Top Five Cryptocurrencies Bubbling Under the Top 100

    The crypto market has been in what would describe as shambles over the last 30 days. As a result, the prices of most asset failed to hit expectations. This situation was not limited to the coin in the top 100 only.

    Nonetheless, there are the worst hit as Bitcoin and Ethereum lost more than 17% over the last 30 days. With the consistent drop in the value of these cryptocurrencies, many investors are looking to coin outside the top 100ss. Let’s see the top five most promising.

    1. Casper Network

    Casper, the first live proof-of-stake (PoS) blockchain based on the Casper CBC protocol, was introduced on the mainnet on March 30, 2021. The Casper platform aims to accelerate the global adoption of DApps, smart contracts, and blockchain technology.

    With its future-proof architecture, Casper is built to guarantee that the platform is continuously improved in accordance with the changing needs of its users and that developers from all backgrounds have the greatest possible access to it.

    According to the official whitepaper, Casper is optimized to meet the demands of both developers and businesses. As the need for intuitive, linked services keeps expanding, Casper’s goal is to usher in a new age for Web 3. Casper solves this by providing enterprise-grade security, scalability, and decentralization, which addresses the adoption trilemma.

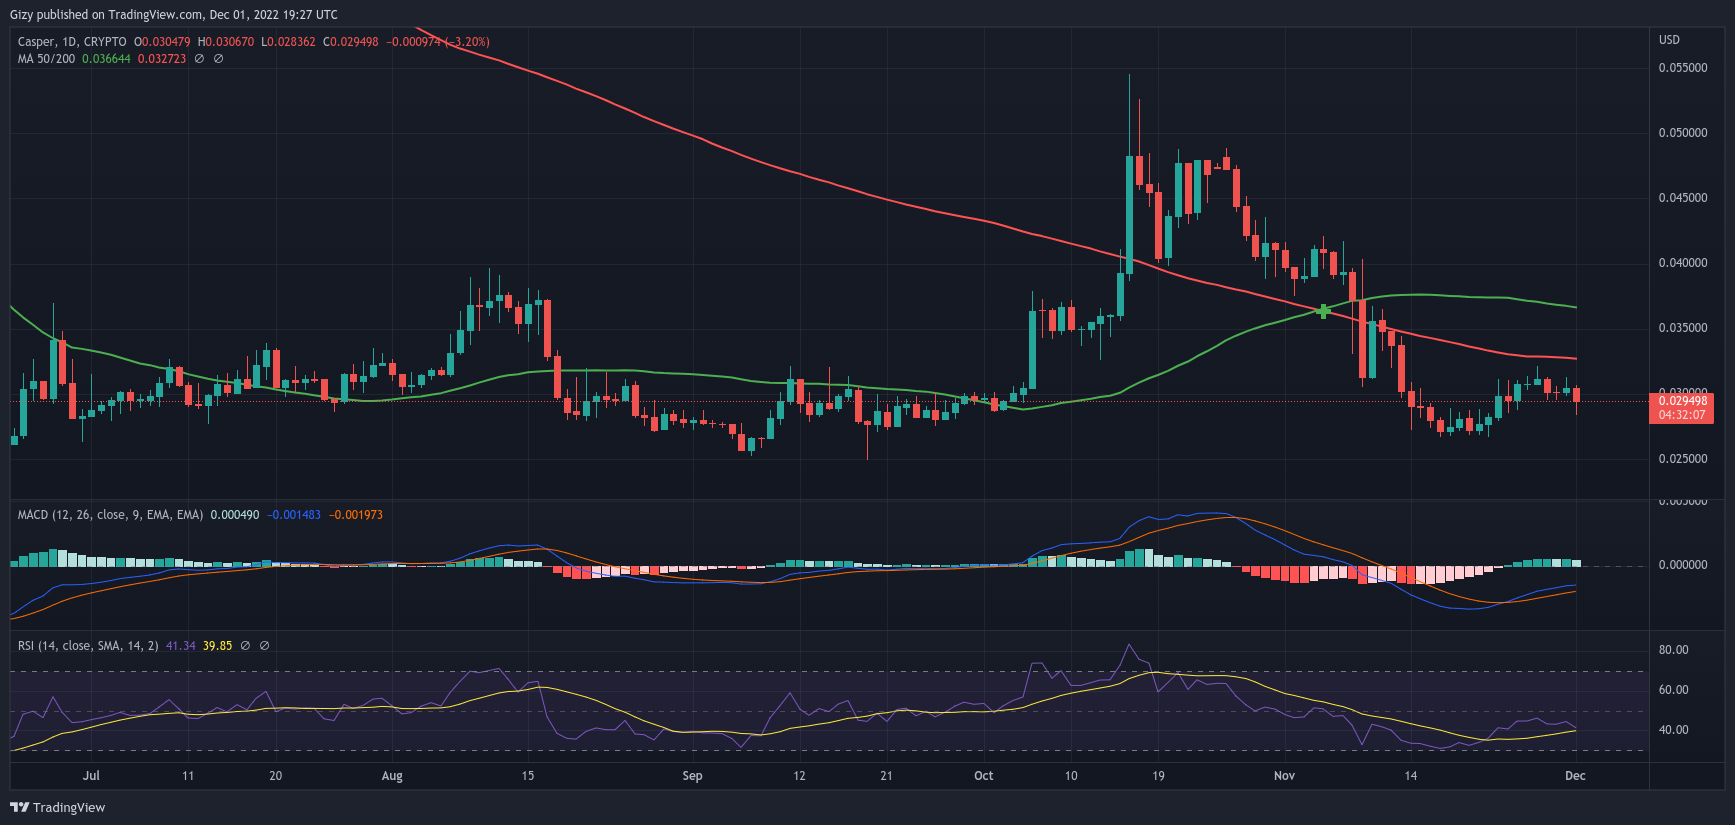
    With regards to price, the asset showed a lot of volatility and many traders have it on their watch lists. The reason for this conclusion is that for some time, the coin saw a massive price increase as its trading volume reached new highs.

    It is considerably stable with several supports. One such is the $0.026 mark. The barrier held off against several attacks as the latest downtrend saw it retrace and threaten to flip it. A closer look at the chart affirms that there are other critical marks.

    If the highlighted level breaks, we noticed a massive demand concentration at $0.023. However, before an attempt at this barrier, we may expect prices to linger around $0.025. On the other hand, CSPR will crush key resistance during the next surge.

    A flip of the $0.030 barrier may signal the start of another bullish round. One level that may need more pressure to break is the $0.032 as it held against several attempts over the last fourteen days.

    The $0.040 resistance is another mark that Casper may flip before the end of the year. We may see more try at $0.045.

    Helium

    A decentralized blockchain-based network for the Internet of Things (IoT) gadgets is called Helium (HNT). The Helium mainnet, which went live in July 2019, enables low-powered wireless devices to communicate with one another and transfer data across its node-based network.

    The so-called “Hotspots,” which combine a wireless gateway and a blockchain mining device, are nodes in the network. By running nodes, users mine and receive rewards in HNT, the native money of Helium.

    Since its founding in 2013, Helium has been analyzing shortcomings in the current infrastructure with the aim of preparing IoT connectivity for the future. With regards to price, there are varying speculation.

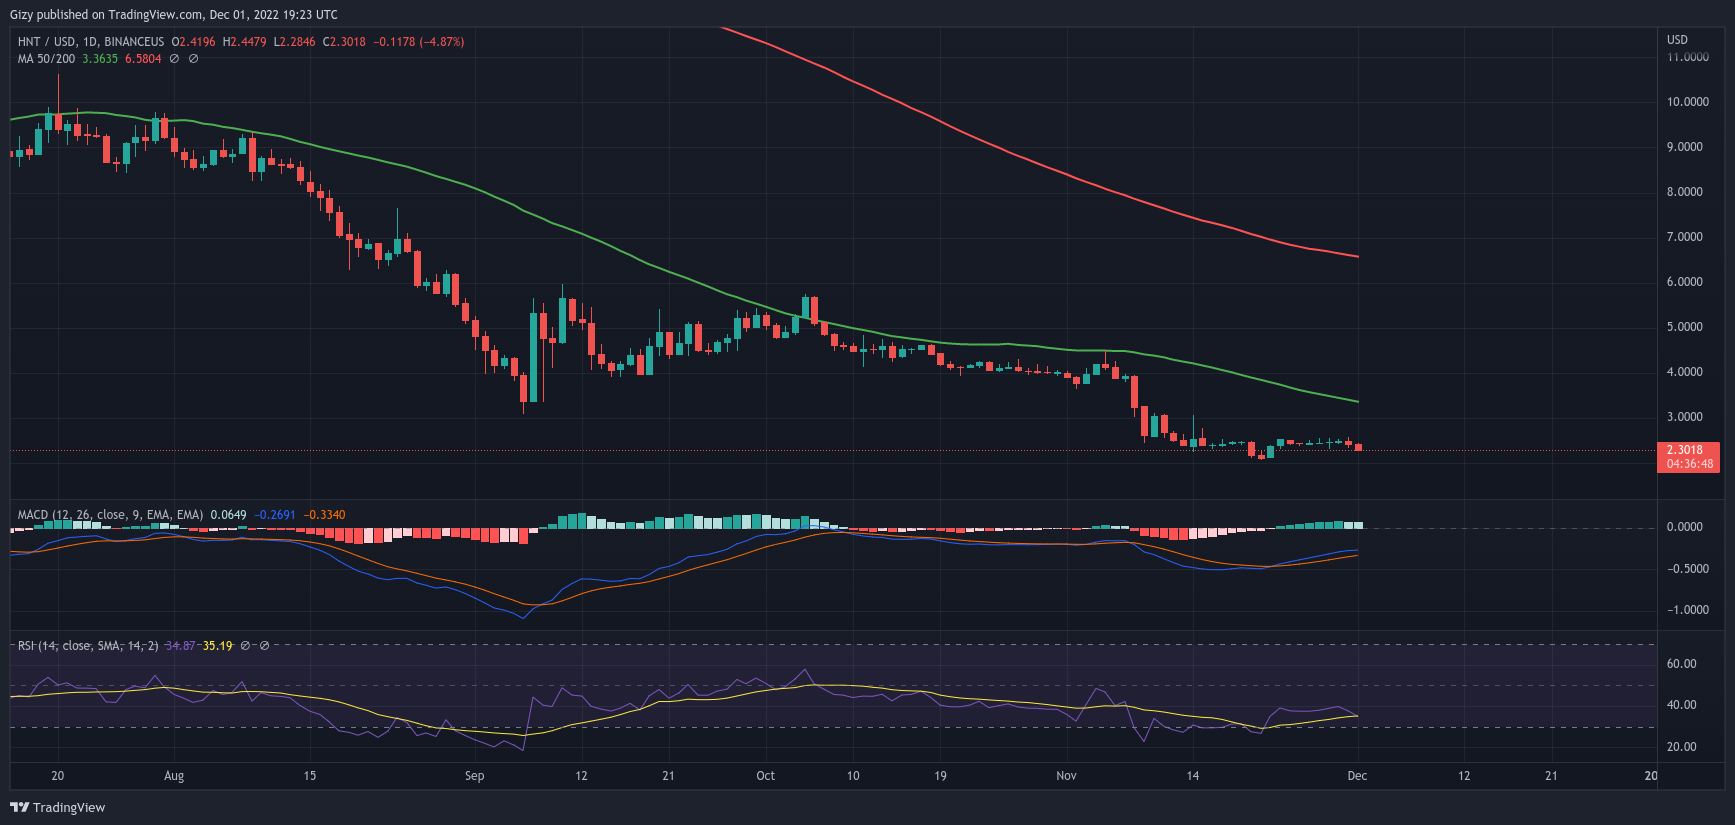
    Nonetheless, most traders are hopeful of new highs. One of the levels all eyes are on is the $5 resistance. Currently trading below the said mark we may see attempts at reclaiming. To achieve this aim, the coin must the $2 support.

    As at the time of writing, it is the toughest positive barrier as a slip may guarantee a retest of the $1.5 support. On the flipside, since dropping below $3, HNT only tested it once and failed as market conditions were not conducive.

    However, the Moving Average Convergence Divergence may be a source of concern. Its hinting at a possible bearish divergence which tells a slip below $2 is more likely. After the drop, the recovery may send helium to retest the $3 resistance.

    Once it breaks, then we may see an attempt at the $4 barrier. This mark is not one of the toughest but performed better as a support than the other way round.

    Loopring

    A Decentralized Exchange (DEX) dubbed Loopring is constructed using the zkRollup Ethereum Layer-2 (L2) solution. It has ordered book-based exchanges as well as Automated Market Maker (AMM)-based exchanges.

    An Ethereum L2 scaling solution called zkRollup moves calculations away from the blockchain. Only the data layer and the verification layer of the Ethereum blockchain are used by the Loopring protocol.

    As a result, compared to Ethereum’s current throughput of 15 transactions per second, Loopring’s throughput is as high as 2,025 trades per second. As a result, the price for each trade settlement is only $0.00015.

    Professional traders and market makers can use algorithmic trading tactics and other automated trading bots thanks to Loopring’s performance. Prior to now, no DEX could do this since it was too slow and expensive.

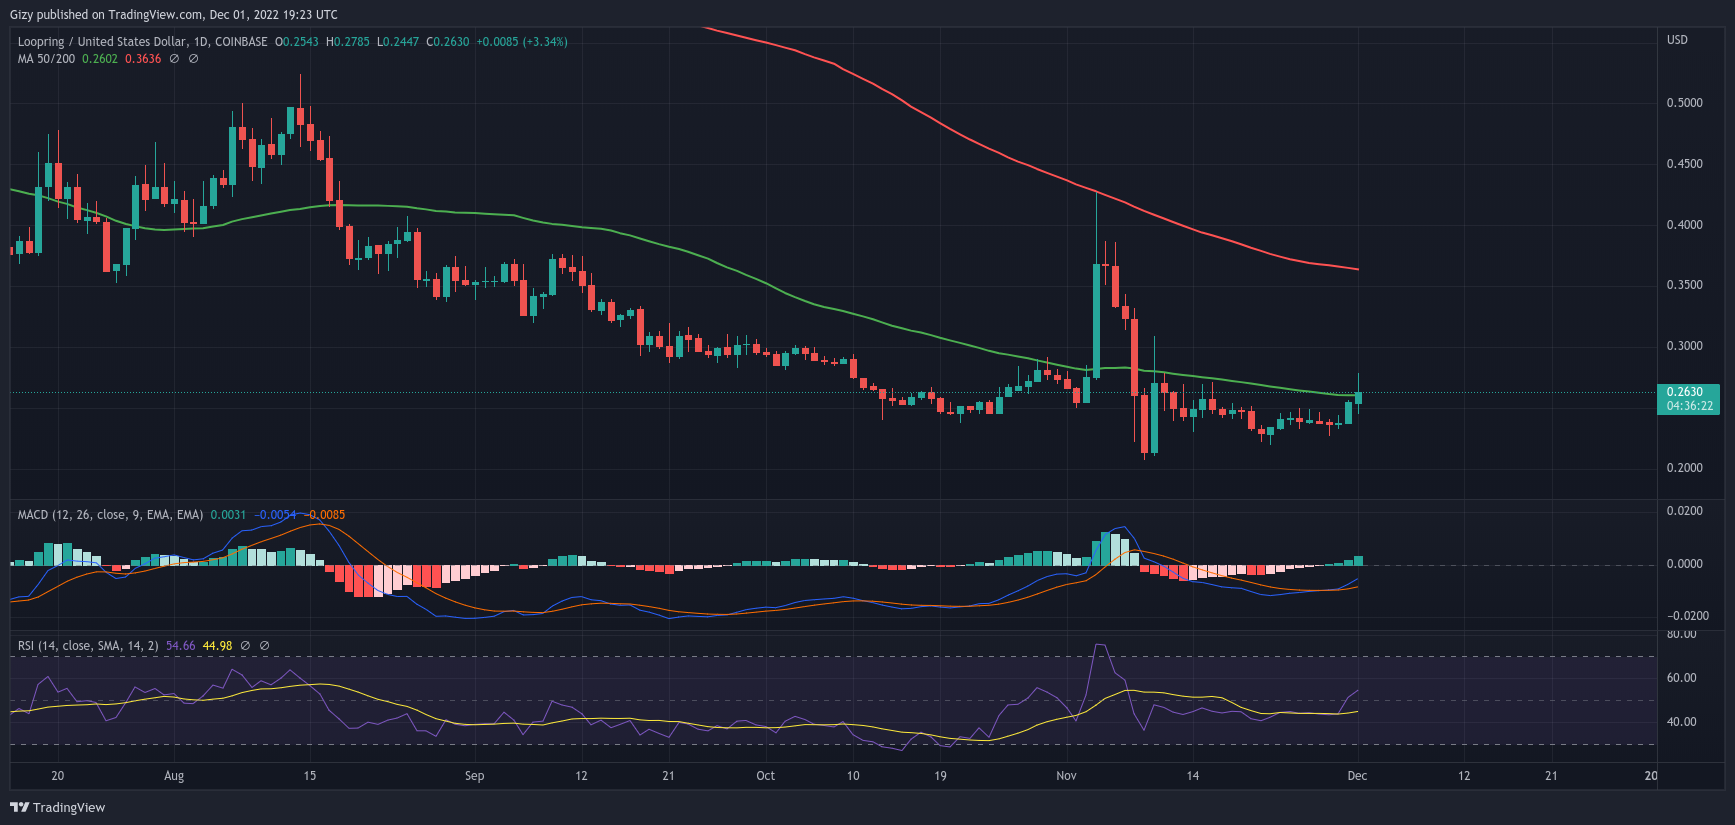
    On  the part of fundamentals, there are non at the time of writing. However, using the supports and resistance we can point out key levels to watch. The first on the list is the

    Convex

    Convex is a methodology that streamlines the Curve boosting process to increase yields. With Convex, Curve liquidity providers can claim increased CRV and trading fees without locking their own CRV.

    With little effort, liquidity providers can benefit from increased CRV and mining rewards for their liquidity. Convex allows customers to get trading commissions in addition to a portion of the increased CRV that liquidity providers receive if they choose to stake CRV.

    In addition to improving capital efficiency, this enables a better balance between liquidity providers and CRV stakeholder groups. For a more effective boost to their CRV earnings, Curve liquidity providers can deposit their LP tokens into Convex. Through the protocol, holders of Curve DAO tokens will be able to earn more increased CRV and CVX tokens.

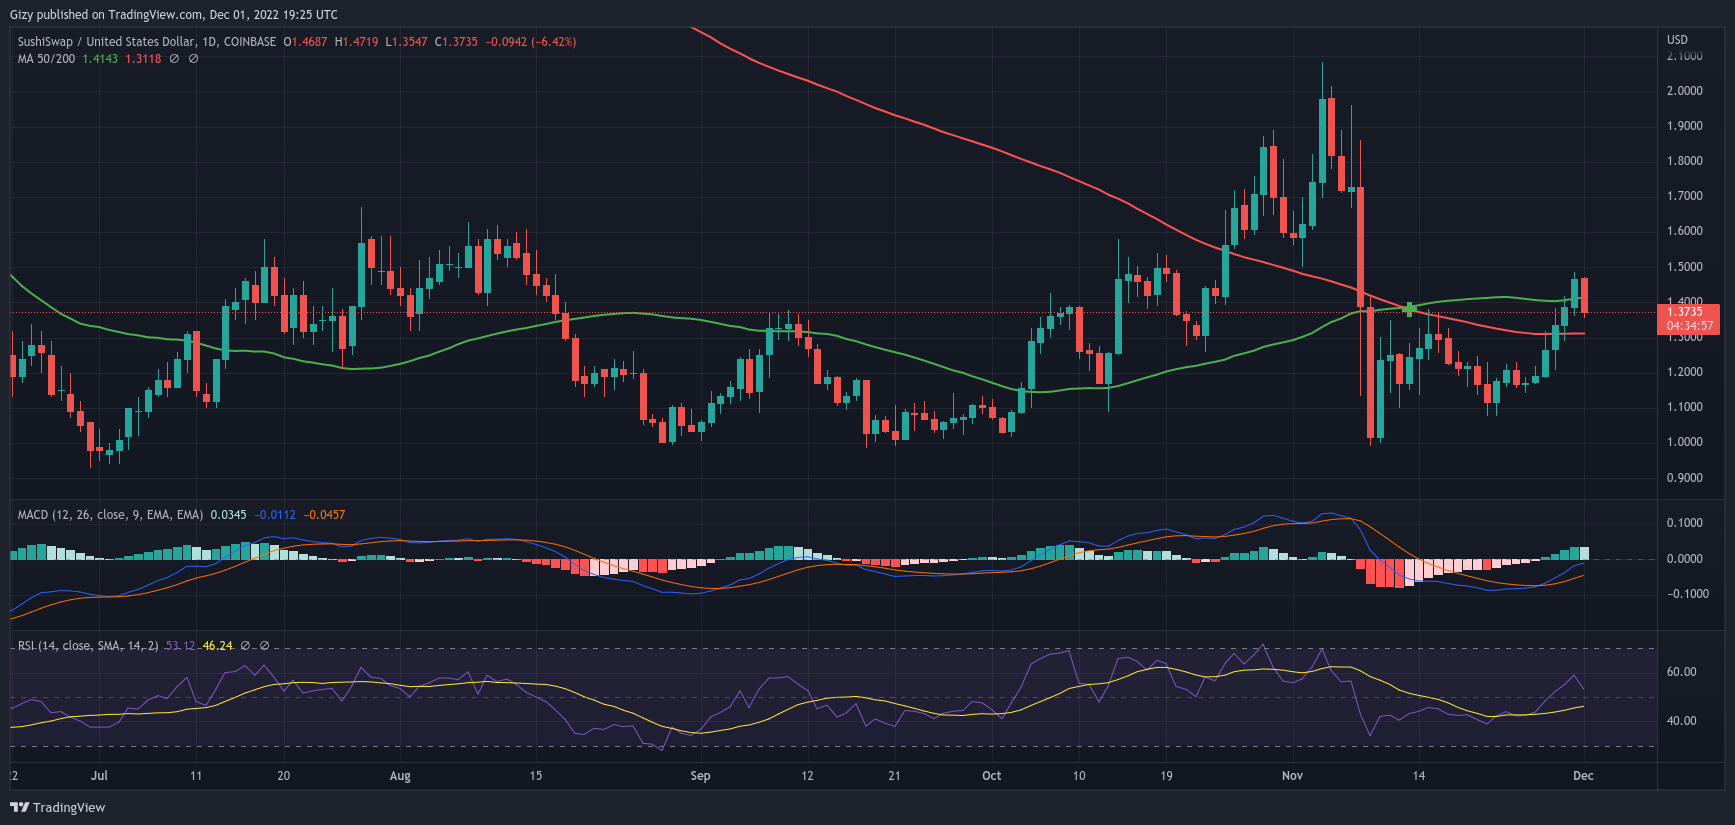
    Sushi

    Sushi is a DeFi technology that offers scrumptious interest for your holding crypto funds and is entirely community-driven. Utilize DeFi methods that generate passive income on Sushi, including as staking, yield farming, and liquidity provision.

    Additionally, Sushi has fewer obstacles when executing your bitcoin trade because of the decentralized nature of being an AMM (Automated Market Maker), and all fees are paid to the customers that generate liquidity.

  • Top Five Cryptocurrencies to Watch this Week (Nov 28)

    Top Five Cryptocurrencies to Watch this Week (Nov 28)

    The crypto market is seeing its fair share of volatility as most cryptocurrencies seem to be gearing up for a major move. However, this may be a continuation of the past week’s price movement as there are indications of better price performance compared to some weeks back.

    One such is the global cryptocurrency market cap. It opened the previous intraweek session at $803 billion but dipped to a low of $779 billion. However, it recovered and ended the seven-day period at $843 billion.

    This is an indication that the sector saw a more than 5% increase. Many wonder if fundamentals played a huge role at the time. It is hard to say as there was no massive change in the prices of major assets. Nonetheless, several stories made the rounds.

    One such is El Salvador’s bid to start a $1 billion sovereign bond. The world’s largest crypto exchange Binance also made headlines as it proposed to help raise $1 billion for struggling projects.

    This week, there are no big announcements yet, nonetheless, there are several developments. For example, Blockfi filed for chapter 11 bankruptcy and threatened to fire more than 200 workers.

    Many are looking forward to price performance over the next five days. Let’s examine the prospects of these assets.

    Top Five Cryptocurrencies to Watch

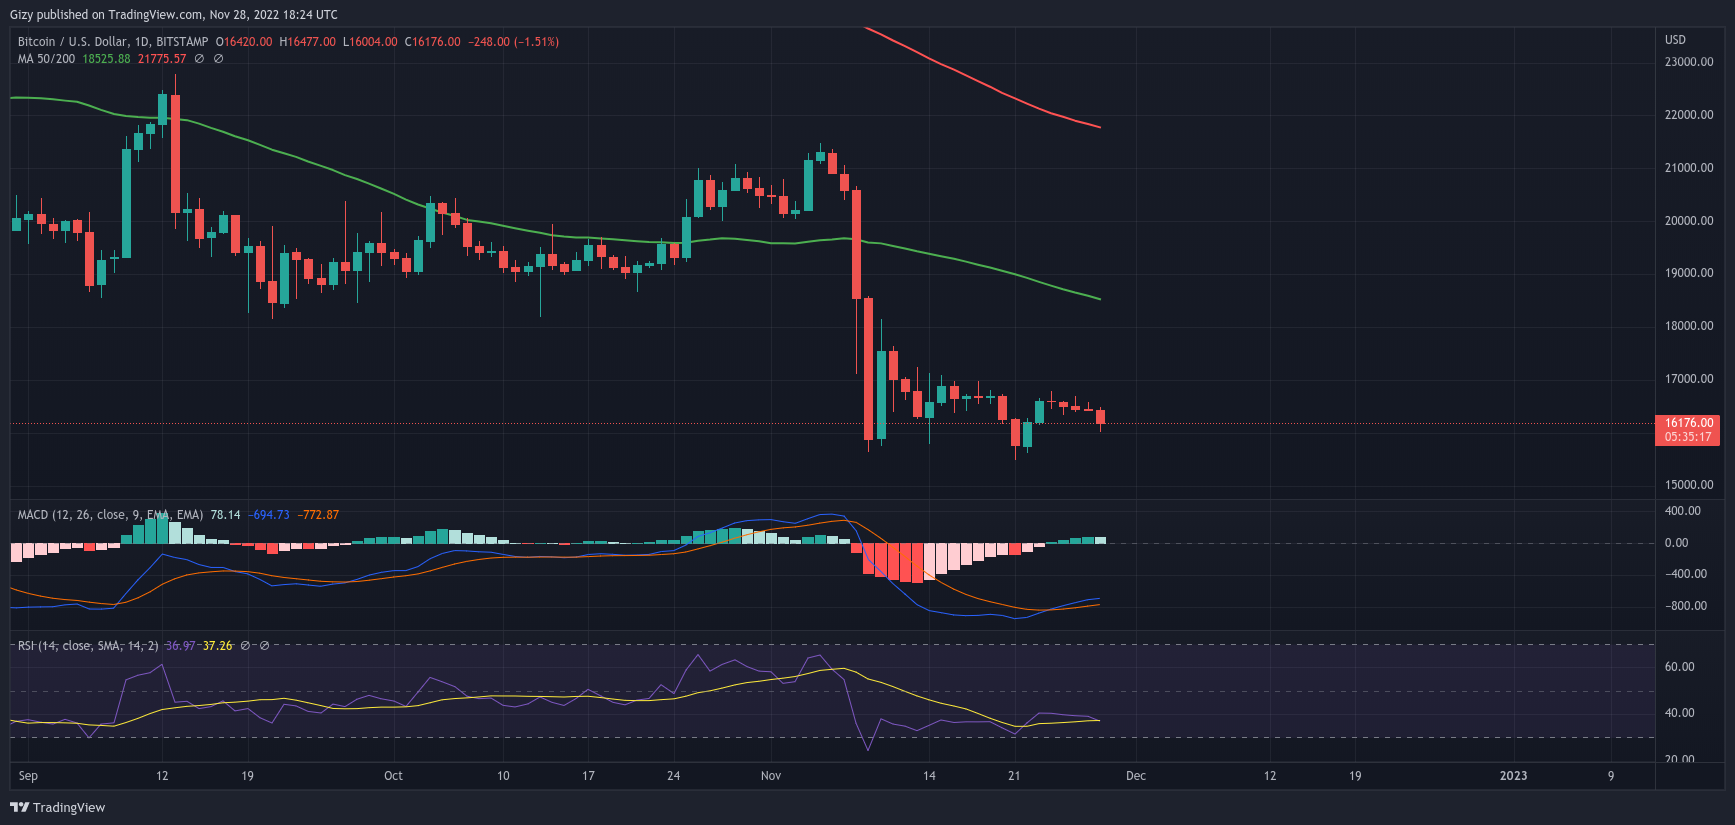
    1. Bitcoin (BTC)

    The previous seven-day period saw the apex coin fail to record any notable change in value. On the weekly, we observed a doji that showed that the asset had more volatility than the previous session.

    It had its biggest moves of the week during the first three days of the week as it had a bad start. Bitcoin dipped to a new low for the year. It dipped to a low of $15,479 but recovered and closed a little higher.

    However, the session ended with losses of 3%. The next two days marked efforts to reclaim lost levels. Tuesday was the most bullish as the apex coin gained almost 3% and reclaimed $16k. It built on the improvement of the day.

    It gained more stability above the said. The last four days of the week were marked with very little impact on prices. A look at the chart showed that BTC failed to register any price changes above 2% during this period.

    This also affected indicators like the Relative Strength Index. The metric remained stagnant during this timeframe. The Moving Average Convergence Divergence also ended the period under consideration with so uncertainty after it had its bullish divergence.

    With this in mind, we turn to previous price movements to get an insight into the next possible price action. Yesterday, BTC retested the $16k support but bounced off it there was increased demand at the mark.

    Currently, above the vital level, we may see the asset under consideration flip $17k resistance before the end of the week. Based on the previous price action, there is a huge chance it may end above it.

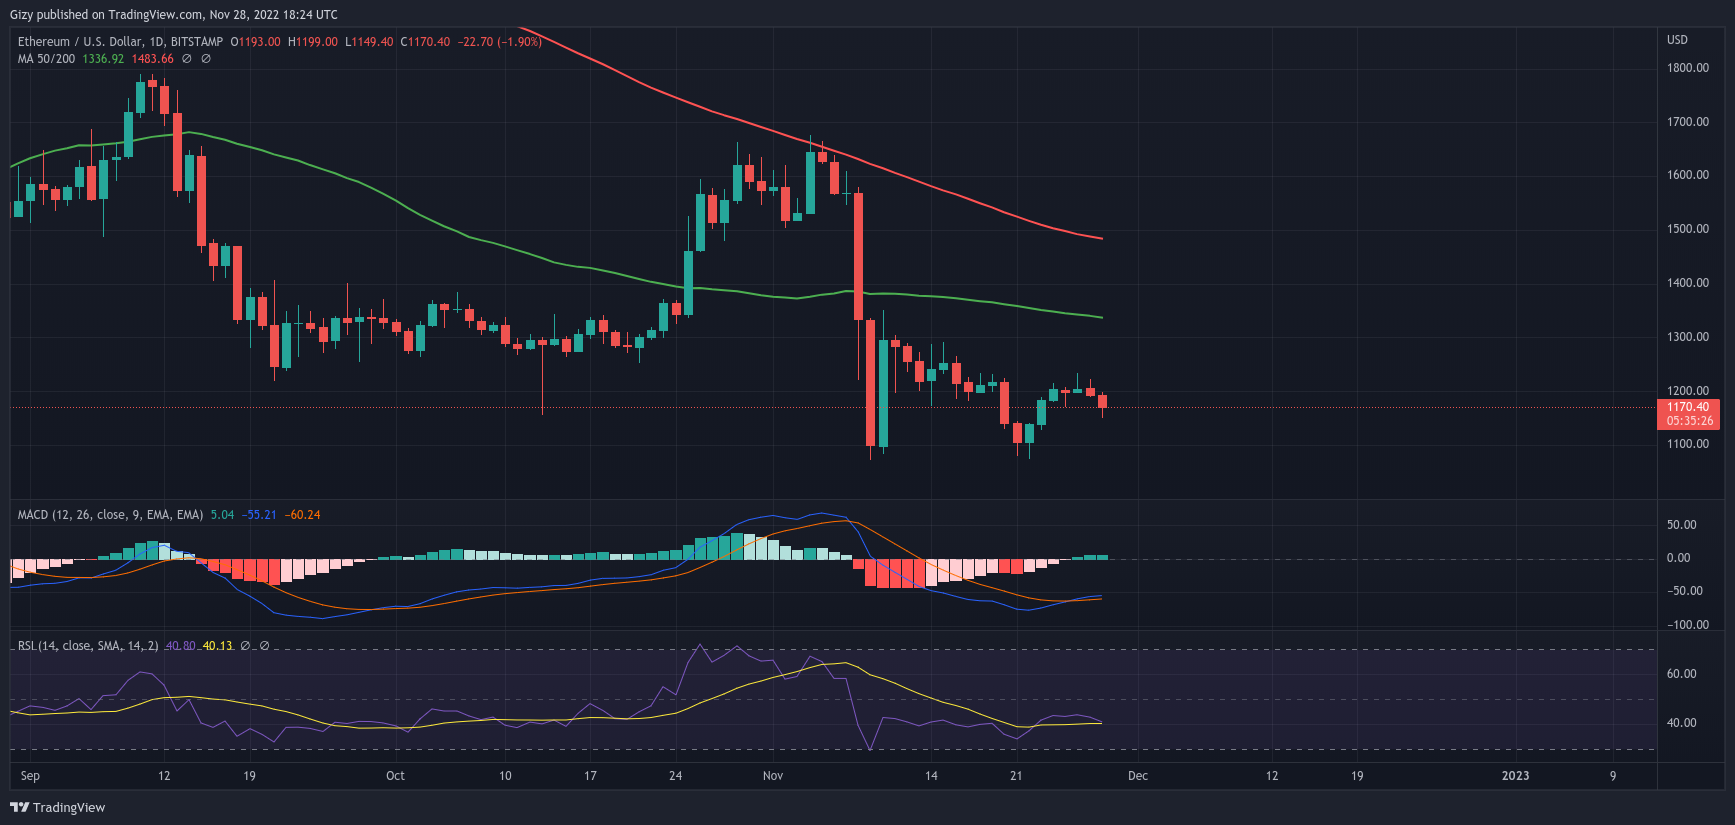
    2. Ethereum (ETH)

    Like most cryptocurrencies to watch, Ethereum had its fair share of volatility during the previous intraweek session. It had a bad start to the week as it lost more than 3% on Monday. The asset flipped the $1,100 support as it dipped to a low of $1,080.

    The downtrend ended the next day as it had its first green. It recorded gains of almost 3% but failed to completely erase the incurred losses. It made an attempt at the $1,200 resistance on Wednesday but failed as it faced rejection at $1,188.

    The session ended with a positive change of almost 4%. The increase continued into Thursday as the asset flipped $1,200 and peaked at $1,215. However, it failed to register any notable increase.

    On the weekly scale, the coin closed with a more than 4% increase. We also noticed several effects on indicators. For example, MACD had a bullish divergence which signaled the start of the uptrends.

    RSI was also on the rise as it spent most of the period under consideration above 40. Yesterday, the asset under consideration failed to perform as many expected. It dipped which raise concerns as to the next price action.

    However, the current intraday session points to the altcoin having a repeat of the previous week’s movement. Ether may end the present 24-hour cycle with a positive change of more than 4%.

    If this trend holds true, we may see ETH retest and flip the $1,300 resistance. We may see the attempt take place on Thursday. One key level to watch during this period is the $1,200 support as it is vital to the current bid.

    RSI may also climb in response to the uptrend and may end the week above 55. Similar to the previous intraweek session, the largest altcoin may range throughout the last three days of the session.

    3. Binance Coin (BNB)

    Binance coin astounded everyone as it flipped several key levels. One such is the $250 support on the first day of the previous week. It rebounded at $249 but closed with losses of more than 3%.

    It reclaimed $260 and peaked at $266 on Tuesday as the bulls rallied the market. It registered gains worth almost 5%. The uptrend continued into the next intraday session as it saw it biggest pump.

    As a result, it flipped the $300 resistance. This marked the first time in more than fourteen days the asset flipped this key level. It ended the day with gains of more tha 12%. The next two days were marked with very little impact on prices.

    This changed on Saturday as BNB attempted retesting the $320. It failed but attained a high of $317. It also recorded a more than 3% increase. Sunday was another period for the exchange token.

    A look at the indicators showed that the asset under consideration could be gearing for more moves. We get a clearer picture when we look at it Moving Average Convergence Divergence. It showed a bullish divergence on Friday, which hinted at further price increases.

    The Moving Averages agree with this prediction as we observed that the 50-day MA is back on the uptrend. Additionally, for the first time since November 10, RSI returned to 60. With all indicators pointing to more uptrends, one key level to watch is $340.

    Although not a strong resistance, we may see the asset struggle to flip $320. However, once it becomes a support, we may expect an attempt at the highlighted level. It is also important to maintain the $300 support.

  • Top Five Cryptocurrencies to Watch This Week (Nov 21)

    Top Five Cryptocurrencies to Watch This Week (Nov 21)

    As predicted, most cryptocurrencies, failed to perform as many expected. The prices of most cryptocurrencies are stagnant as there was little to no volatility. As a result, most assets trended sideways throughout the past week.

    A look at the global cryptocurrency market cap paints a clearer picture of what took place. It opened at $825 billion but dipped to a low of $802 billion. It recovered as major projects reclaimed key levels they lost.

    As a result, it peaked at

    1. Bitcoin (BTC)

    Bitcoin traded sideways for most of the week. This trend saw the asset under consideration remain above or around $17,000. Along with gaining some stability above $17k, bitcoin did not experience any notable gains or losses. On Wednesday, when the coin dropped a small percentage, the first red candle of the week appeared.

    The three days that followed saw little activity. We can infer that since being a tradeable asset, the top coin has never been this inactive. Overall, it scarcely shows any growth because many people could compare it to a stablecoin.

    BTC fluctuated by an average of 0.30% throughout the time period under review. According to the weekly chart, the apex coin may complete the current intraweek session with no significant gains or losses.

    A closer look at the indicators provides more insight into the market’s current state. The Moving Average Convergence Divergence is one. The 12-day EMA and 26-day EMA are both experiencing a consistent downward trend as a result of the most recent market conditions.

    The Moving Averages exhibit the same phenomena. Also stable was the Relative Strength Index. It was in a 35 to 37 range trend. A straight line, which represented the previous three days, was visible on the chart.

    With focus on the new week, we may expect to see the asset make further attempts at flipping the $18k resistance. It failed in recent time. However, bearing in mind the gradual climb in price, we may expect the level to become before the end of the week.

    2. Ethereum (ETH)

    Similar to BTC, it peaked at $1,288 on Monday and had the longest candle. It nevertheless fell to a low of $1,172. In comparison to some of the largest this past week, the candlestick’s body is rather modest upon closer inspection.

    The following day was better because the asset kept some of its gain. However, it was only a green and unimportant. Like most assets, Wednesday was characterized by a minor slump, with the largest altcoin experiencing the most value loss.

    It failed to record any gains or losses, as with the preceding days. The last three days saw almost little change in price, though, thus the decline in volatility reached an unparalleled level. It changed direction by less than 1% on average.

    We can observe how indicators are impacted by the drop in trade volume. MACD is first on the list. Prior to this, we noticed the measure was in a severe slump as the 12-day and 26-day EMAs started to descend less rapidly.

    The most recent market condition is also having an impact on the 50-day MA and 200-day MA. On RSI, the sideways trend is also evident. We noticed that during this time, the indicator trended around 30.

    3. Binance coin (BNB)

    It reached a high of $291 on Monday before falling to a low of $267. It started trading at $278 and ended at $278. Both price markings indicated that there had been no appreciable increases for the coin during the intraday session.

    As the asset under review reached its previous high, we noticed a similar pattern. The significant resistance it encountered at $282 caused its march to gradually come to an end. This incident happened again the following.

    Similar to BTC, the alternative currency experienced greater price stability throughout the first three days of the week than the rest. For instance, the three most volatile days within the time

    indicator movements were slight, which we observed. The Relative Strength Index went from 45 to 38, according to an examination at the data. However, we noticed that it is trending downward and that the measure is slowly getting closer to 30.

    The convergence of moving averages Another indicator of the downturn is divergence. We saw that the 12-day and 26-day exponential moving averages are both progressively moving toward their earlier lows. The Moving Averages followed a similar pattern, which we also saw.

    4. Ripple (XRP)

    The rises persisted into the following day as it advanced further. After experiencing a severe rejection at $0.39, it attempted to test the $0.40 resistance but failed. Nevertheless, it ultimately increased by almost 3%. Its first red candle, like that of BTC, was lit on Wednesday.

    It decreased from $0.39 to $0.36 as a low. It lost more than 3% by the time the intraday session was over. The prices changed very little or not at all over the following three days. The asset consequently did not show any major rises or reductions.

    This changed on Sunday when the altcoin’s price experienced its largest decline. The intraday session began at $0.38. It saw a brief upswing and tried to flip $0.40.

    With losses of more than 6%, it ended at $0.36. A significant portion of XRP’s gains over time were obliterated by this loss. Nevertheless, it had a price shift of more than 5% by the end of the week. It is now among the top ten gainers in the top 10.

    More information about how prices behaved over the last seven days may be gained by looking at the indicators. MACD observed more motions. The 26-day EMA and the 12-day EMA grew very close. This signals the beginning of a bullish divergence.

    Between 41 to 39 was the relative strength index’s trend. For the first time since dropping the 200-day Moving Average two weeks ago, the asset under evaluation tried to challenge it.

    5. Cardano (ADA)

    The lead was increased as it became more stable over $0.34 by the bulls. It declined, though, and showed no discernible price fluctuations. It had its first transaction of the week on Wednesday, like the majority of cryptocurrencies.

    It was a repetition of the events from the day before. This time, the asset fell by a few percent, signaling a red candle. It retraced to a low of $0.32, which was a deeper low. The next day, it fell much more after losing the $0.32 support.

    The trade volume was consistently low throughout the following two days. As a result, it did not document any appreciable price increases or decreases over the time frame in question. That altered on Sunday when it had a significant retracement.

    The trade volume was consistently low throughout the following two days. As a result, it did not document any appreciable price increases or decreases over the time frame in question. This altered on Sunday when it had a significant retracement.

    It fell as low as $0.30. The altcoin that made the biggest shift of the week, losing more than 4%, was represented by the chart’s biggest candle. It lost more than 5% of its value on a weekly basis.

    The convergence of moving averages Over the previous seven days, divergence maintained its downward trend with no change in course. On the RSI, which trended around 38, we also observed a similar emotion.