This December, many are looking forward to massive rallies across the crypto market. Unfortunately, most cryptocurrencies are not seeing these increases. They seem to be continuing the previous month’s sentiment.
A clear indication of this is the global cryptocurrency market cap. It opened November worth more than $1 trillion. It peaked at $1.05T before experiencing a massive downtrend that saw it retrace to levels it hasn’t in a long while.
It dipped to a low of $790 billion as most cryptocurrencies dipped to their lows. It recovered as the session continued but failed to surge to the opening price. The eleventh month closed at $860 billion.
This is an indication that the crypto market lost more than 15%. The question on every trader’s mind at this time is if December would offer better performance. Let’s look at some factors.
Fundamentals
There are several indications of further downtrends. This month, the Feds will hold a meeting. They could raise or decrease interest based on prior meetings. Based on prior market responses to these remarks, we might predict a change in the asset’s value.
Furthermore, it’s important to remember that an increase could lead to a large value loss while a decrease could lead to further price increases. Aside from this, a lot of individuals anticipate December 13 with anticipation.
The Consumer Price Index will be released at this moment by the proper authorities. It might have a similar impact on the price of the biggest altcoin as interest rates do. During the last release of the CPI, the crypto market saw notable increases.
This was a result of the decrease in inflation that spread a lot of positivity across the sector. As a result, the value started to recover. If all these fundamentals turn out positive, we may expect the same reaction across the market.
With a brief overview of how fundamentals might play out. Let’s look at how some assets will perform.
Top Five Cryptocurrencies to Watch this December
1. Bitcoin (BTC)
During the previous month, More than 22% of Bitcoin’s value was lost during the first week of November. Following the FTX event, there were numerous daily drops before this happened. As a result, MACD started moving in a bearish direction.

The 12-day EMA reversed as the longest candle of the month formed. The indicator runs the risk of diverging if the market conditions don’t get better. Two green candles on the chart assisted in halting the downturn.
As a result, there was some convergence. There is still a concern because the 26-day EMA is rising and is about to cross the 12-day. Retracements were seen in the Relative Strength Index as well.
Following the way prices played out during the previous 30-day period, many are looking forward to better price performance. However, aside from fundamentals, the chart are hinting at significant downtrends.
Bitcoin had its bullish divergence a few days back. This heralded the start of the increases that ensued. While many celebrate this feat, others are worried. The main cause of concern is the Moving Average Convergence Divergence.
Following the positive cross, there are strong indications that the asset may see a trend reversal in the coming days. This claim is more likely with the discovery of a hammer candle stick. This means that the asset may be gearing up for further decreases.
It’s hard to say exactly when this will happen. However, there are clear indications that this may take place within the next seven days. The decrease in the Relative Strength Index is another indication of an impending bearish round.
With regards to key levels to watch, there are several. The mark is now trading around $17k, but a small shift in trajectory might cause it to alter. The $15k barrier is the next threshold to keep an eye on. Retesting indicates a significant downturn, and a flip might lower the asset under consideration to $14k.
On the other hand, we might observe additional attempts at critical resistance. The $17k ceiling is first on the list. Based on historical price moves, although trading around it, we might see it miss the mark and then make it before a decisive breakout.
The $18,000 resistance has a great possibility of also breaking. The $21k is the biggest and toughest negative barrier.
2. Ethereum (ETH)
During the previous month, the Moving Average Convergence Divergence saw a lot of movement. The longest candle of the month came as the 12-day EMA dipped. If market circumstances don’t improve, the metric will risk divergence. The chart’s two green candles helped to slow the decline.
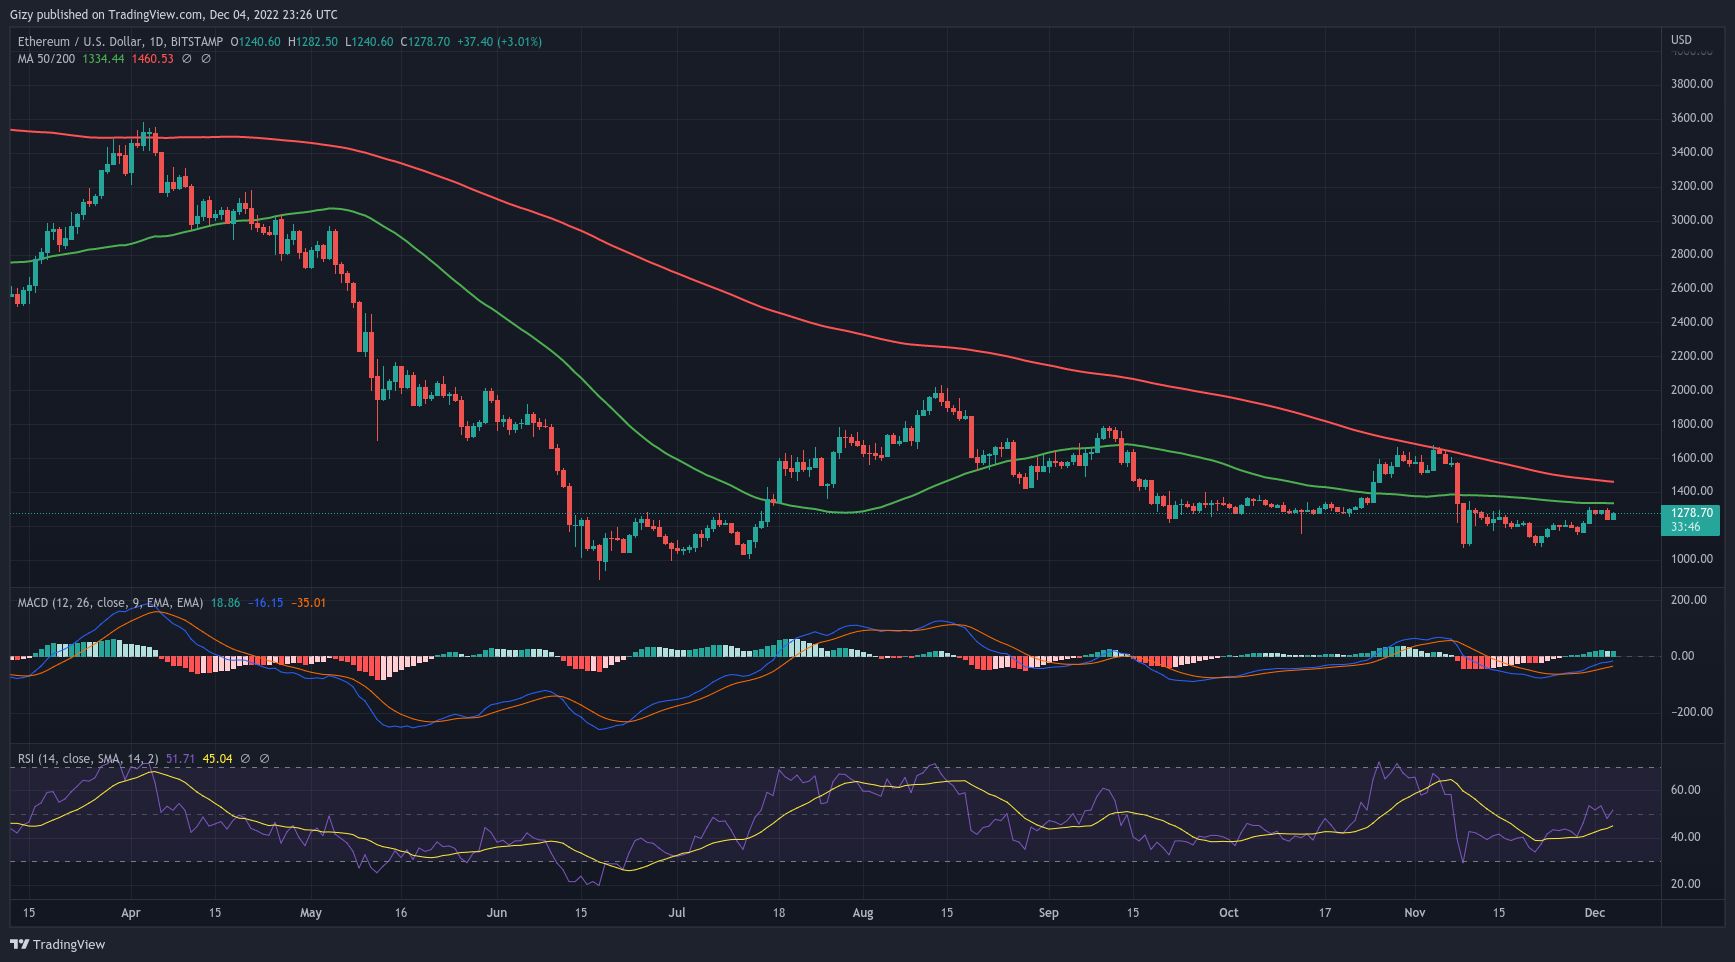
There was no complete divergence. The 26-day EMA is on an upswing and is on the verge of intersecting the 12-day, so danger still looms. The Relative Strength Index experienced retracements as well.
The indicator fell to a low of 38, sparking concerns that the asset might be oversold. As RSI rose above 40 before the end of the time period under review, this worry diminished.
We see the same sentiment during the first week of December. With this in mind, we may conclude that ethereum may trade sideways before a major significant breakout, a closer look at earlier market movements. One such instance occurred in October.
Every day throughout this time, ETH fluctuated by 2%. There are signs that the asset would experience a similar situation for most of the ensuing twenty-seven days. We might observe a trend between $1,200 and $1,400 this time.
We can foresee a decline or a climb to levels that many people do not expect based on fundamentals. Retesting the support level of $1,000 is one such mark. The main catalyst for a breakout will be the release of the monthly CPI.
