Tag: Coins to Watch

  • Top Four Cryprocurrencies to Watch: BTC, ETH, SOL, XRP

    Top Four Cryprocurrencies to Watch: BTC, ETH, SOL, XRP

    ETH remains stagnant despite the current bullish sentiment across the market. It has yet to make any major leaps at a breakout. However, other altcoins are significantly up.

    Bonk started the day at $0.000048, surging after a brief decline. It is trading at $0.000056 after attaining a new all-time high a few hours ago. The asset is up by over 15%, with the bulls keeping prices closer to the ATH.

    The memecoin craze continues as another such cryptocurrency attained a new high. The viral squirrel token climbed closer to its ATH. It started the day at $1.59, surging to a high of $1.87 following a brief decline to $1.50. Currently up by 11%, it is a contender for top gainer.

    The crypto market is teeming with activity, as the total market cap has risen by over 3%. However, trading volume is considerably lower than the previous day’s.

    Fundamentals are positive at the time of writing. Coinbase co-founder Brian Armstrong may meet Donald Trump in the coming days to discuss potential personnel appointments. The latest move strengthens the conviction that the president-elect will maintain his pro-crypto stance.

    Other news made the rounds over the last 24 hours. However, none has any adverse effect on prices. Here is how the chart predicts prices may play out this week.

    Top Four Cryptocurrencies

    BTC/USD

    Bitcoin recently attained a new all-time high. It started the day at $90,514, surging above $92k and hitting $93k. It continued upwards, crushing the previous ATH as it broke above $94,000. Currently trading lower, the apex coin may be gearing for a further price surge.
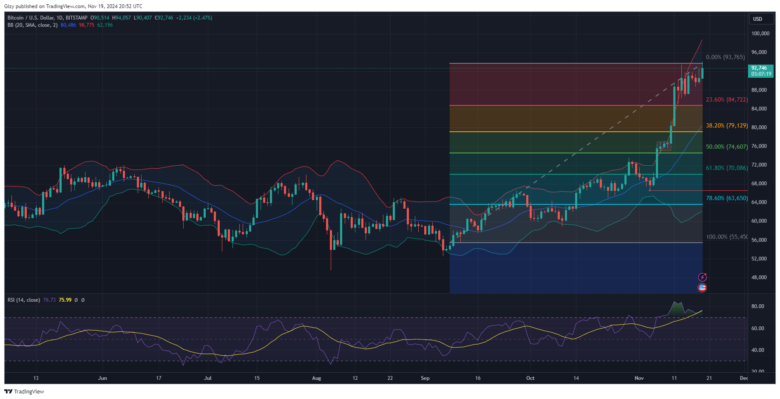
    The latest milestone happened after the asset broke out from a trend it maintained over the last seven days. During the previous intraday session, it briefly flipped $93,000 for the first time in five days. Although it retraced to its opening price, the bulls continued the attempt a few hours ago.

    The relative strength index continues to issue warnings amidst the growing bullish sentiment. It is at 77 after breaking out from 70 a few days ago. Bitcoin has been overbought since Nov. 6. If the market trend remains constant, it risks a massive correction.

    Previous price movements show notable demand concentration at $89k if the asset may slip as low as $84k if the bulls fail to defend the mark.

    On the other hand, the Bollinger band shows room for more surges. The upper band is closer to $100k, hinting at a possible attempt at this critical level. Bitcoin will break the $95k barrier within the next five days.

    ETH/USD

    Ethereum had an excellent start to the week on Monday. It started trading at $3,076, breaking the $3,200 barrier as buying volume increased. Despite growing bearish sentiment across the crypto market, it closed at its peak for the day.
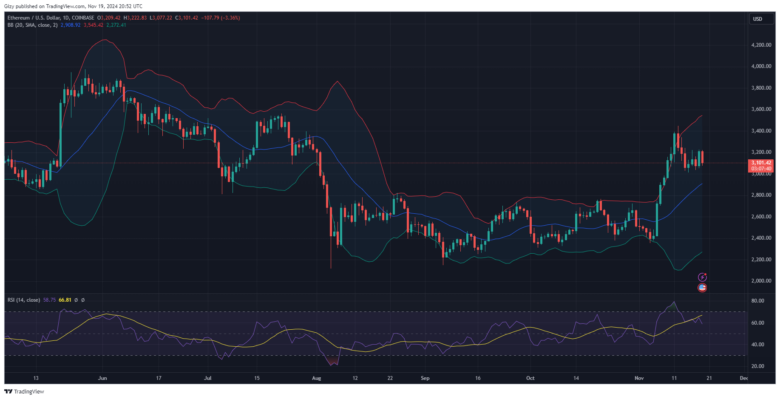
    The apex coin struggles to continue the uptrend as it grapples with notable selling pressure. It is exchanging at $3,125 and has lost almost 3% since the day started. The most recent price performance spreads fears of further declines. However, indicators hint at impending recovery.

    ETH is trading between the upper and middle SMA on the Bollinger bands. The upper band stretches closer to $3,600, hinting at huge room for more uptrends. RSI points to the exact prediction. It is below 70 after its brief spell above 70.

    Price movement over the last seven points to growing demand concentration at $3k. The bears also stage massive selloffs at $3,200, resulting in the asset’s failure to decisively breakout. The bulls will look to break the resistance. Such a flip will result in another attempt at $3,400. A close at the current price will guarantee such a trial.

    Nonetheless, ETH risks a drop below $3,000. There are notable buy orders around $2,800, which may be the coin’s next destination.

    SOL/USD

    Solana had one of its most significant bullish moves on Sunday. It started the day at $215 and surged after a brief decline. It revisited a level it hasn’t since over 2021, breaking above $225. It continued upwards, peaking at $241 and closing with gains exceeding 10%.
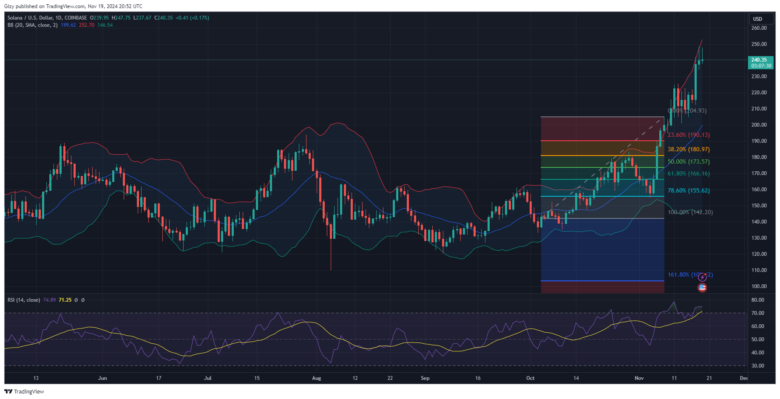
    The altcoin has since struggled to replicate the surge but gradually edged closer to $250. It hit a high of $248 during the previous intraday session. SOL attained the same level a few hours ago but is exchanging at $243.

    The most recent price performance shows growing bearish sentiment among traders. Some are taking profits while the bulls struggle to keep the uptrend on. However, the relative strength index is above 75; the asset is overbought and due for corrections.

    Price declines may set in the coming days as the altcoin loses momentum. The Bollinger bands point to an impending downhill movement. Solana consistently tests its upper band, which mostly happens when the uphill movement is nearing its end.

    The $225 mark served as a strong barrier a few days ago. The buyer may stage a buyback at this mark in the event of a downtrend. SOL risk further dip below $220. Nonetheless, it may break above $250 this week and edge closer to $260.

    XRP/USD

    XRP bulls were thrilled when Ripple’s co-founder had a meeting with President-elect Donald Trump. They registered their support for the move with a massive buying bullish action on Saturday. The coin started the day at $0.89 and surged above $1 for the first time in years. It peaked at $1.28 but met massive rejections, closing at $1.12. However, the asset gained 25%.

    The altcoin has since struggled to continue the uptrend. It registered losses exceeding 5% on Sunday but attempted recovery on Monday. It started the session at $1.05 and surged closer to $1.20 but retraced.

    The current-day price performance suggests an ongoing struggle for dominance between the bulls and bears. XRP dropped to a low of $1.06 and peaked at $1.14. Currently, printing a doji, there is no decisive winner, increasing price uncertainty.

    Nonetheless, the relative strength index shows that the asset may experience a further price decline in the coming days. It is at 84 after peaking at 93 on Sunday. The asset is still overbought, as the RSI remains above 70.

    If trading conditions worsen, the altcoin may lose its $1 status this week. The bears will look to push prices as low as $0.90. To prevent this, it is important that the bulls resume the uptrend. A bullish round will send XRP above $1.30.

  • Top Four Cryptocurrencies to Watch: BTC, ETH, ICP, AR

    Top Four Cryptocurrencies to Watch: BTC, ETH, ICP, AR

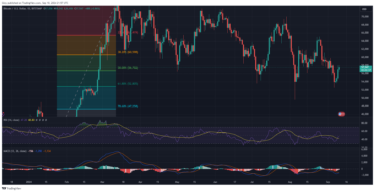
    BTC remained stuck below $58k over the last 48 hours. After testing, it faced significant rejections, resulting in the latest trend.

    The crypto market registered a significant change in trading volume during the previous intraday session as funds pumped in. Some estimate the increase to be over 30%. However, it gradually lost its spark as volume was down by over 9%. Nonetheless, the global cryptocurrency market cap is above $2 trillion.

    Optimism also returned to the market, as renowned wealth management firm Bernstein views the upcoming U.S. presidential election as a critical factor influencing Bitcoin’s price movements before the end of the year.

    Donald Trump and Kamal Harris are currently debating many topics. Crypto may be the frontrunner among them, and their comments may affect prices in the coming hours. Nonetheless, traders are still skeptical about the ongoing price trajectory.

    Will the crypto market continue its uptrend or resume its downhill movement?

    Top Five Cryptocurrencies to Watch

    BTC/USD

    Bitcoin is off to a good start with its significant push during the previous intraday session. It started trading at $54,876 but surged, flipping $56k with eyes on $58k. However, it failed to flip the mark and retraced as a result decisively. Nonetheless, it ended the day with gains exceeding 4%.

    On-chain data shows that it experienced a massive hike in trading volume during that period, which resulted in the price increase.

    Trading volume is currently dwindling as traders are returning to the previous sentiment. It is down by over 18% in the last 24 hours. Bitcoin is seeing small increases amidst the ongoing trend. It attempted $58k a few hours ago after a failed trial yesterday.

    It is worth noting that the apex coin is yet to climb above its pivot point after more than two attempts in the last 48 hours. Nonetheless, indicators point to an impending flip in the coming days.

    One such is the moving average convergence divergence. If trading conditions improve, the 12-day EMA is on the uptrend and will intercept the 26-day EMA in the next 48 hours. Although the RSI saw tiny movement in the last 24 hours, its small hike shows buying pressure that may fuel a bid above $58k.

    ETH/USD

    Ethereum chart shows that the asset has been on the uptrend over the last three days. It printed its most giant candle during the previous intraday session, attempting $2,400 following a slight scare that the decline may resume. It peaked at $2,385 as selling congestion mounted. Nonetheless, it registered gains of almost 3%.

    At the time of writing, it has yet to register notable price changes. The altcoin resumed its attempts at $2,400 and edged closer a few hours ago. It peaked at $2,395 but is seeing a minor correction as trading continues at $2,381.

    The asset is missing the spark from the previous day. In the last intraday session, it had an over 50% increase in trading volume, with a bulk coming from bullish activities. The reverse is the case, as ETH volume dropped by over 9%.

    Nonetheless, indicators hint at a possible flip of the $2,400 resistance. The moving average convergence divergence is printing a positive signal. If trading conditions improve, the 12-day EMA is on the uptrend and will intercept the 26-day EMA in the next 24 hours. Although the RSI saw tiny movement in the last 24 hours, its small hike shows buying pressure.

    Ethereum will look to edge close to its pivot point at $2,600 after breaking above the highlighted mark.

    ICP/USD

    Internet computer is seeing one of its most significant surges in the last three months. It started trading at $7.78 and surged, breaking its fourteen-day high at $8.73. It continued upwards and broke the $9 resistance. The asset is edging closer to its first pivot resistance at $9.12 and may flip it in the next few hours if trading conditions remain the same.

    The asset is seeing a more than 112% increase in trading volume. The main reason for the latest surge is unknown. However, the derivatives market points to a rise in open interest that may be positively reflected in prices. Currently up by over 15%, ICP leads the crypto top gainers in the last 24 hours.

    The altcoin continued the previous day’s surge, which saw it gain over 4%. It remains to be seen if the four-day EMA will end this week. Nonetheless, indicators are hinting at a continuation. For example, MACD displayed a bullish divergence a few days ago due to the uptrend.

    The relative strength index shows the asset could surge more as the metric sits around 64. The latest reading comes in response to the ongoing uptrend. The altcoin may attempt $10 this week.

    However, following the sharp rise, price movement suggests an impending correction. In previous times, ICP saw a notable decline after RSI hit 67; the same may happen this week. Prices may drop as low as $8.

    AR/USD

    Arweave has been in a downtrend over the last two weeks. The one-day chart suggests that it is yet to recover from this trajectory. As a result, it lost over 3% last week. However, the close, although negative, could hint at the end of the declines.

    Traders believed this would happen as the token registered notable increases during the previous intraday session. It started trading at $20 but surged to $21 after a brief dip to $19.8.  The day ended with gains exceeding 3%.

    The altcoin has shed off its small gains as it resumes the downtrend. It started trading at $20.8 but is exchanging at $19.8, indicating a more than 4% drop. In addition to ending the two-day surge, the asset has erased its accumulated gains.

    Indicators were looking positive during the previous day, as MACD’s 12-day EMA showed signs of halting its downhill movement. RSI also saw a small hike as buying pressure improved. However, the metrics have resumed their previous trajectory.

    Price movements suggest that the decline may end soon. If that happens, AR may resume its uptrend. It will look to break its seven-day high at $22. It may trade above this mark for an extended period until a push towards $25.

    Nonetheless, a new trend is unfolding. Arweave held prices above $19.7 over the last thirty days. The trend may continue this week until a breakout to retest supports. It may break the $19 support barrier, sinking as low as retesting the $17.

  • Crypto Analysis 23/8: BTC, TON, DOGE, ADA, TRX

    Crypto Analysis 23/8: BTC, TON, DOGE, ADA, TRX

    The crypto market is seeing fresh influx of investors due to BTC ETFs. While new investors are trooping in, others in the space are seeking to improve profitability by using other platforms that could guarantee ease.

    Tron is undergoing a significant change in its ecosystem as it moves to allow the launch of memecoins. The asset saw a significant increase in its revenue during the previous intraday session, and its profit exceeded that of Solana.

    The global cryptocurrency market cap is seeing small increases as several cryptocurrencies are gradually surging. With the assets registering notable increases, let’s see how they performed since the start of the week.

    BTC/USD

    Bitcoin just broke its fourteen-day high at the time of writing. It comes after several attempts at the mark with limited success. Nonetheless, it approached $62k more than once in the last three days, showing small increases in buying volume.

    The asset was on its way to $62k when it stopped at $61,424 on Tuesday. It experienced a short squeeze that fizzled out a few hours after it started. Nevertheless, it surged higher the next day and closed at $59k.

    BTC peaked at $61,838 on Wednesday and closed with gains of over 3%. It also ended the previous intraday session down by a few percent. The news of CZ getting closer to its release date did not generate the expected reaction. convergence divergence is on the uptrend, with the 12-day EMA continuing its surge. The metric is unaffected by the most recent slight decline.

    Bitcoin is seeing its biggest surge in the last fourteen days. It started the day $60,383 and started a surge that saw it crush the $62k resistance. It approached $64k but hated its advances due to small rejections at $63,856.

    Nonetheless, it is trading close to the peak and has been up over 5% in the last 24 hours. The RSI suggests a massive increase in buying pressure as the reason for the surge.

    TON/USD

    Toncoin gradually trended downwards over the first three days of the week. The bulls were exhausted after a 7% surge on Sunday, which resulted in the asset flipping several important levels. Since briefly rising above $7, the cryptocurrency did not make any significant attempts to continue this trend.

    On Monday, the asset struggled to maintain a price above $7 but was unsuccessful. It reached its lowest point this week during the previous intraday session, dropping by more than 2% to a low of $6.48. TON has erased all gains from Sunday in the last three days and is currently at a critical support level.

    Toncoin retraced to a low of $6.43 but then rebounded, creating a doji on Thursday. Many feared further decline as the current low represents the coin’s lowest point in seven days. The last time prices dropped below this level, the asset retested $6. It also previously acted as a launchpad at the $7 resistance level on several occasions.

    The cryptocurrency is reacting positively to the growing sentiment in the market. It is up by 4% at the time of writing and shows no signs of stopping. Indicators have remained bullish in response to the current trend.

    Nonetheless, the asset is approaching $7 but is facing small rejections at $6.75. It is the main hurdle before as it has lost momentum around this mark in recent times.

    DOGE/USD

    Dogecoin saw a massive increase in active wallets, leading to increased transactions that have impacted prices. It gained over 7% during the first three days of the week, with one notable hike happening on Wednesday.

    The coin saw gains exceeding 3% as it approached its two-week high. However, it faced strong resistance at $0.107 and stopped its upward movement at $0.11.

    The previous intraday session saw DOGE print a red candlestick, suggesting that bullish momentum is waning and signaling a possible end to the three-day uptrend. Although the price remains relatively stable at the moment, if the decline persists, it could drop as low as $0.10.

    However, current price actions suggest the previous assertions were false. The cryptocurrency crossed $0.11 and peaked at $0.112, gaining over 7% in the last 24 hours.

    Since breaking the fourteen-day high, the apex memecoin has been at a crossroads. Continuing the surge will result in the asset flipping $0.12, which is strong support. However, the current price is also strong resistance, and DOGE may face corrections.

    ADA/USD

    Cardano has been on the uptrend since the start of the week. The asset is up by over 16% on a weekly scale as its investors add more to their portfolios. Coinmarketcap shows that a massive increase in trading volume, the majority of which is from bullish traders, caused the latest surge.

    It had one of its biggest single-day surges on Wednesday, starting trading at $0.34 but surged to a high of $0.37. Although it faced small retracements, it ended the day with a gain exceeding 7%.

    The same trend is playing out at the time of writing as the asset approaches its highest level since the start of the month. It edges close to $0.40 but grapples with sellers’ congestion at $0.39. Nonetheless, the cryptocurrency is up by over 3%.

    The relative strength index also points to room for more uptrends, as it’s at 61.

    TRX/USD

    Trondao is currently a significant player in the crypto space. The recent launch of the first memecoin called Sunpump has attracted a lot of attention, prompting more traders to join the trend. This surge in interest has led to increased trading volume and subsequently, price hikes.

    The platform is now encouraging developers to create their own memecoins on Tron. As a result, the native token has experienced significant growth, increasing by more than 15% since the beginning of the week.

    Tuesday marked the most bullish day for the asset, with substantial gains. It began trading at $0.14 and reached a peak of $0.16, the highest it has been in over three years. The surge continued until the end of the day, resulting in a gain of over 12%.

    Conversely, Wednesday was one of the most bearish this week. After hitting a peak of $0.166, the token experienced a retraction, closing with losses of over 5%. The drop can be attributed to the relative strength index, which surged above 70 on Monday and remained elevated on Tuesday. The recent decline is a response to the asset being overbought.

    Currently trading at $0.158 following a doji yesterday. Although not up by a huge margin, the latest small push is in reaction to the bullish sentiment across the market

    The cryptocurrency’s inability to continue its surge can be attributed to the asset still being overbought, indicated by the RSI at 71. This may signal a further decrease in price in the coming hours. Nonetheless, the bulls must defend the price above the 50% Fibonacci retracement level at $0.145.

  • Top Five Cryptocurrencies to Watch This Week (Aug 20)

    Top Five Cryptocurrencies to Watch This Week (Aug 20)

    The crypto market saw a notable increase in the last 48 hours. The new week is looking promising for altcoins, as some are up by a huge margin, reclaiming lost levels. The global cryptocurrency market cap is up by almost 2% in reaction to this trend.

    BTT leads the top gainers as it surged by over 17% in with trading volume tripling over the last 24 hours. TRX reclaimed the tenth spot in the top 10 crypto market ranking as it registered gains exceeding 10%. The asset also surged to its highest in the last three years.

    Market sentiment is gradually changing as crypto products saw a significant inflow last week. Inflows amounted to $30 million as ETFs and other products took center stage. Such a shift in sentiment may also be reflected in prices. Will it happen this week?

    Top Five Cryptocurrencies to Watch

    1. Bitcoin (BTC)

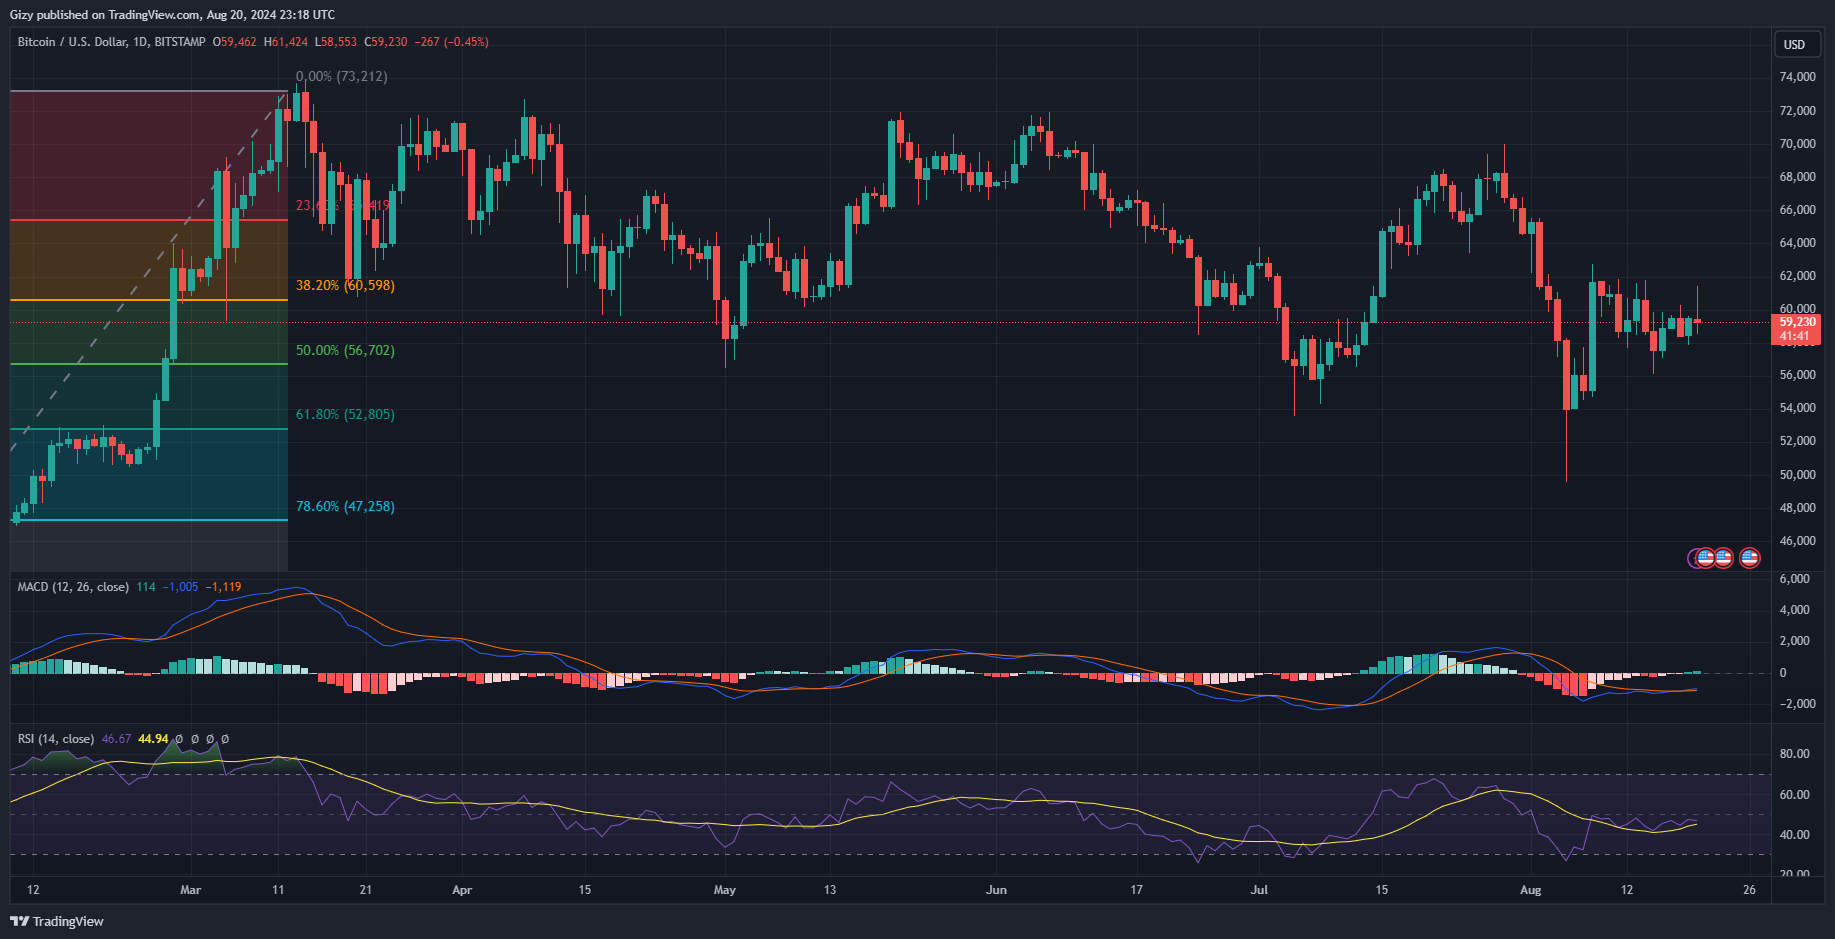
    Bitcoin attempted to reach $62k but failed to surpass it, peaking at $61,424 before retracing. After dropping to a low of $58,553, the coin rebounded and is currently trading at its opening price. Despite this, Bitcoin was unable to continue its upward trend.

    Various speculations exist about the cause of the recent price increase. One possibility is the surge in the price of gold, which reached a new all-time high a few hours ago. Although Bitcoin’s price didn’t sustain the surge, it has generated attention from traders.

    The latest attempt by Bitcoin buyers has resulted in some promising indicators. The moving average convergence divergence is showing buy signals and completed a positive crossover in the previous intraday session. The MACD’s 12-day EMA continues to support the current price trend.

    The relative strength index has also shown some minor variations in response to price actions in the last 48 hours. With a value of 47 indicating mounting buying pressure, it signifies a gradual increase in buying volume.

    If the buyers resume their activity, Bitcoin could surpass $62k in the next five days. Sustaining trading above this level will be crucial, as it will serve as a potential launchpad for an attempt at $64k.

    2. XRP

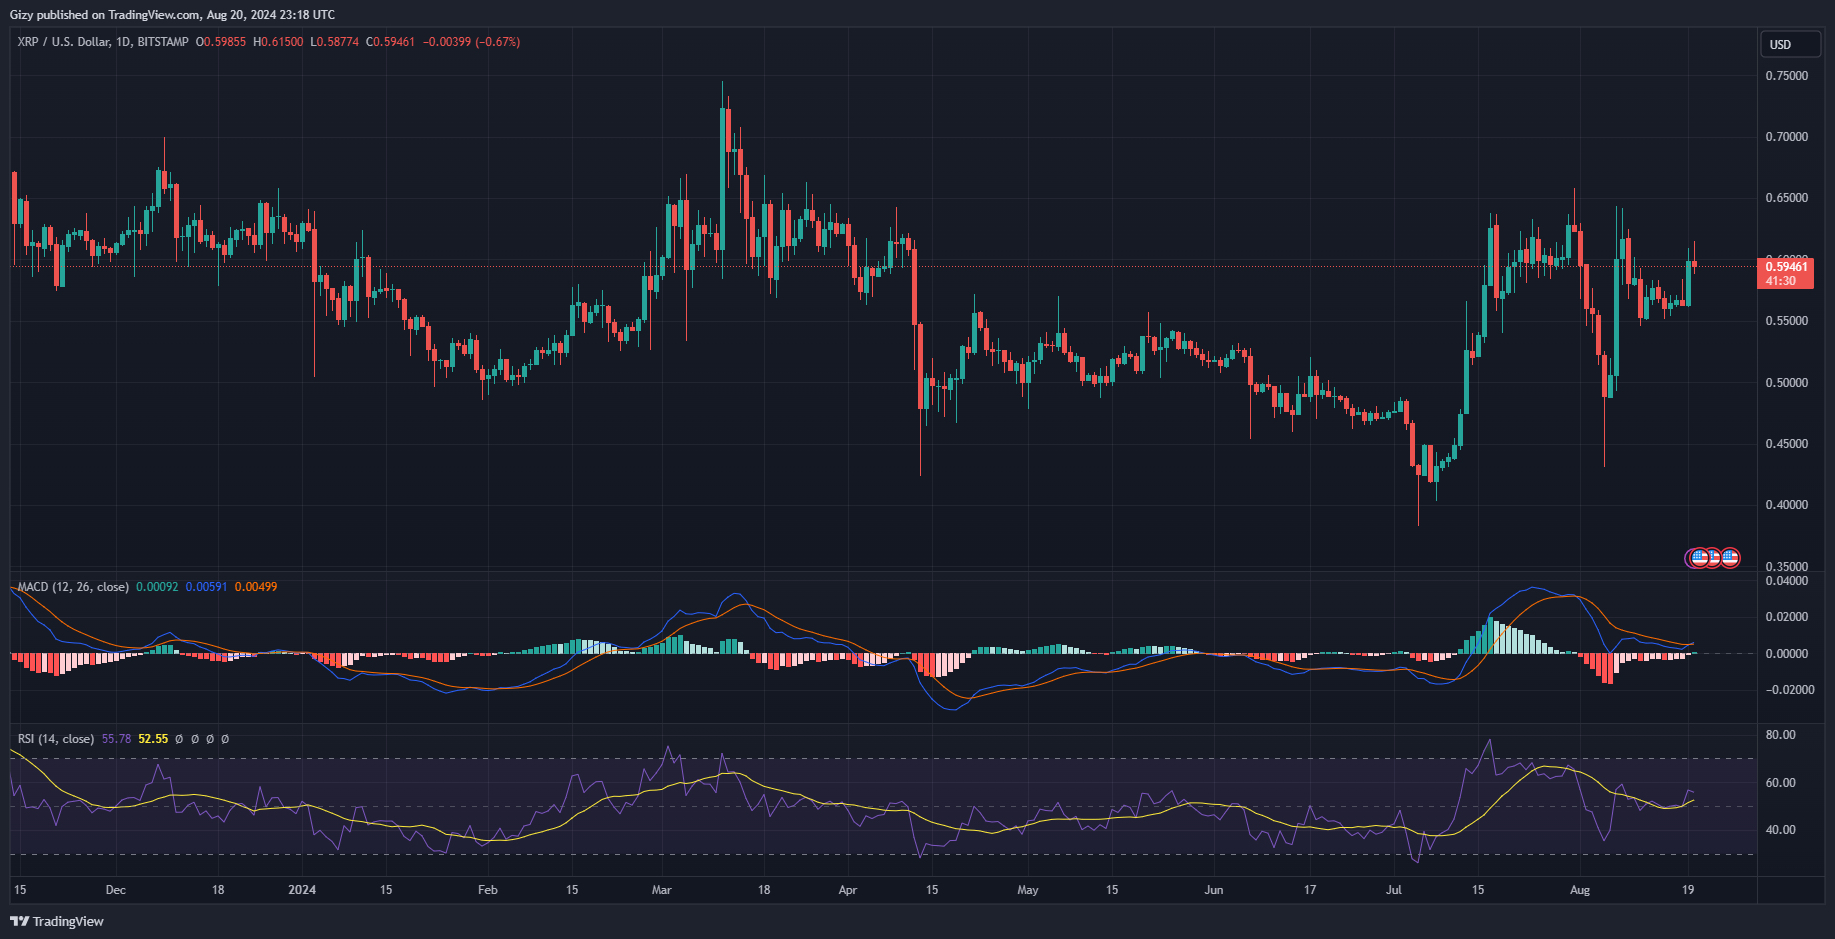
    XRP’s downward trend stopped after news of Ripple reaching a settlement with the court, resulting in a $125 million fine and ending a legal battle that lasted over three years. The SEC was satisfied with the verdict and did not appeal.

    However, the asset is struggling to maintain its price above a key level. It has held on to its pivot point at $0.55 since August 7 and is expected to continue this trend this week.

    In the previous intraday session, XRP had significant price fluctuations, starting trading at $0.26, briefly reaching $0.60, and then retracting. It closed with gains exceeding 6% but failed to surpass $0.62. It’s currently showing a red candle, raising concerns about a potential trend reversal.

    Despite this, indicators provide reasons to alleviate these concerns. For instance, the moving average convergence divergence showed a bullish divergence during the previous intraday session.

    Considering the bullish signal, XRP may test $0.62 and potentially break it. This could lead to a retest of its fourteen-day high at $0.64 and then possibly reach $0.65.

    3. Tron (TRX)

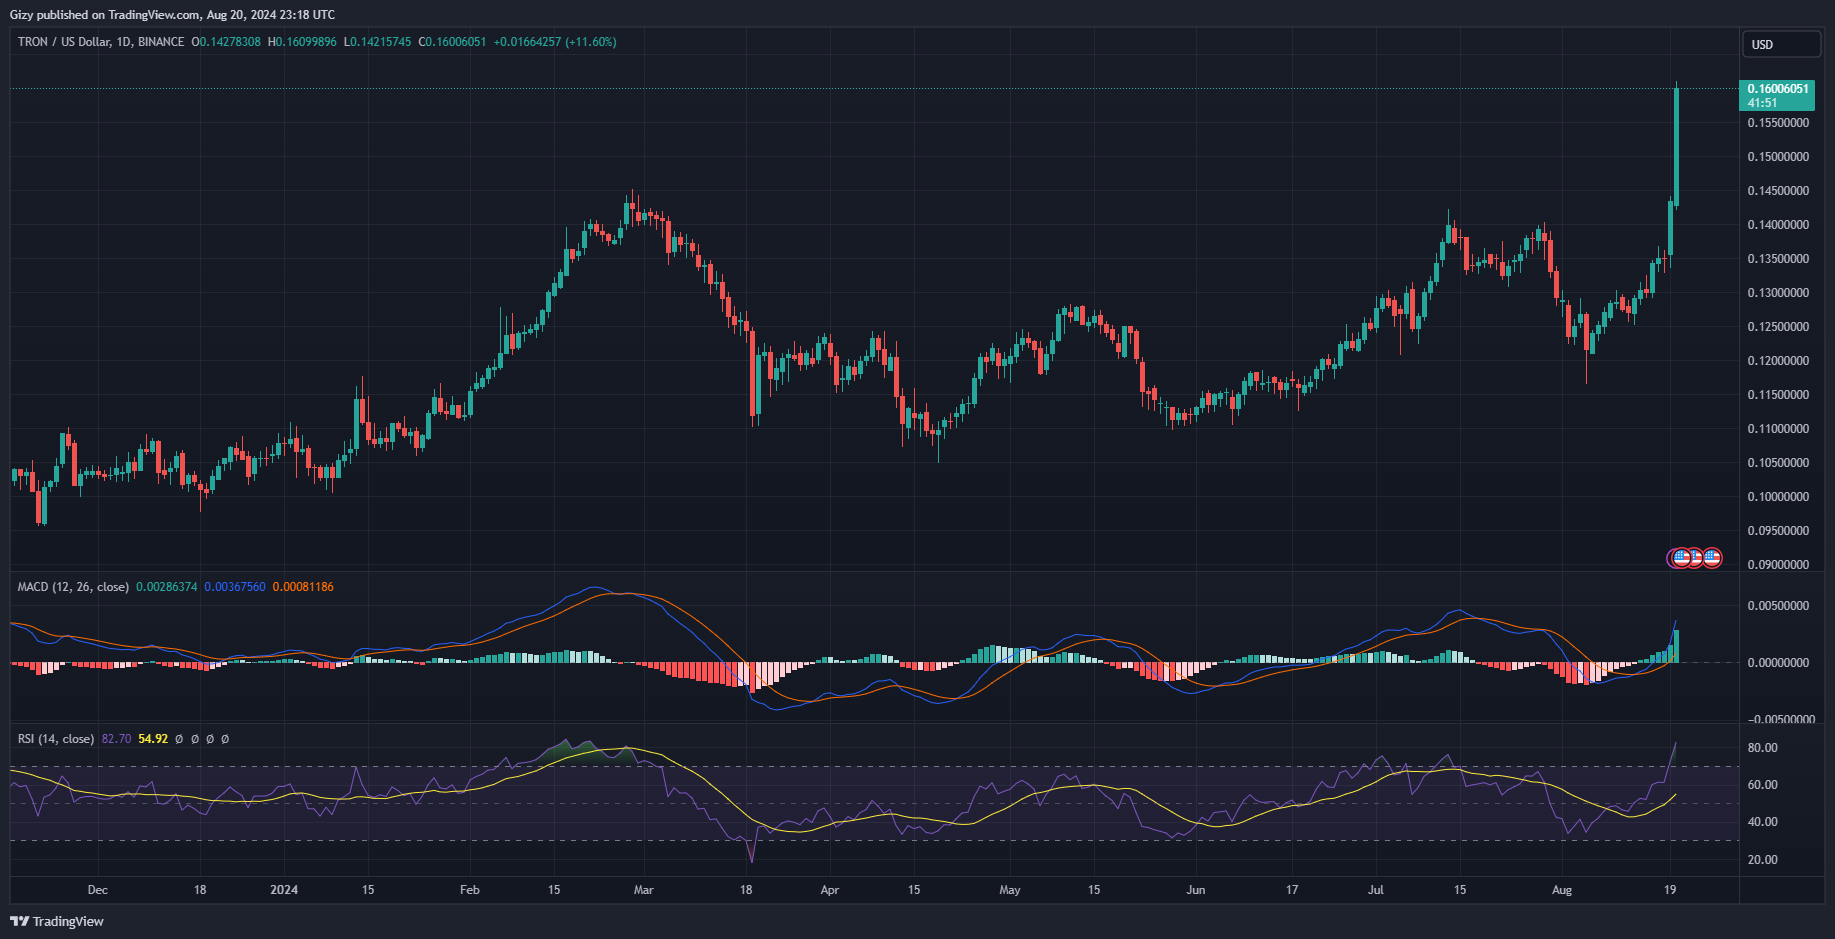
    During the previous intraday session, the asset showed significant increases. It started the day at $0.135, briefly retraced to $0.133, and then rebounded, surging to a high of $0.144. Despite failing to break through $0.145, it still recorded a gain of over 6%.

    It is worth noting that the introduction of Trondao has had a positive impact on TRX. Various sources have reported a significant increase in activity within the ecosystem due to the surge of one of the memecoins.

    The current trend indicates an ongoing uptrend as TRX continues to print large bullish candles. It has peaked at $0.16, surpassing several crucial levels, including the second pivot resistance at $0.15.

    The MACD’s 12-day EMA is the highest it has been in almost a month, and the 26-day EMA follows this upward pattern. The growing histogram suggests the possibility of further price increases.

    However, the relative strength indexes are sounding a cautionary note. The RSI has crossed 70 and is currently at 81, which indicates that the asset may be overbought. Corrections may be expected within the next 24 hours.

    The latest candle indicates that the asset peaked at $0.16 but encountered significant resistance. It remains to be seen if the uptrend will continue, and it is uncertain whether the asset will exceed $0.165.

    On the other hand, the bulls will aim to consolidate their gains. The R2 level suggests a small demand concentration and the $0.15 support level is not particularly strong. A slight dip in TRX’s value could potentially see it fall as low as $0.14.

    4. Brett (BRETT)

    Brett got a fresh listing from the South Korean exchange Upbit. The token has since experienced a massive explosion in trading volume. The buying and selling volume increased by over 376% in the last 24 hours as the cryptocurrency received the much-needed introduction to the Asian market.

    Binance also announced that it is listing the BRETTUSDT trading pair for perpetual future trading. The new exposure also adds to its performance as it is closely behind the largest gainer over the last 24 hours.

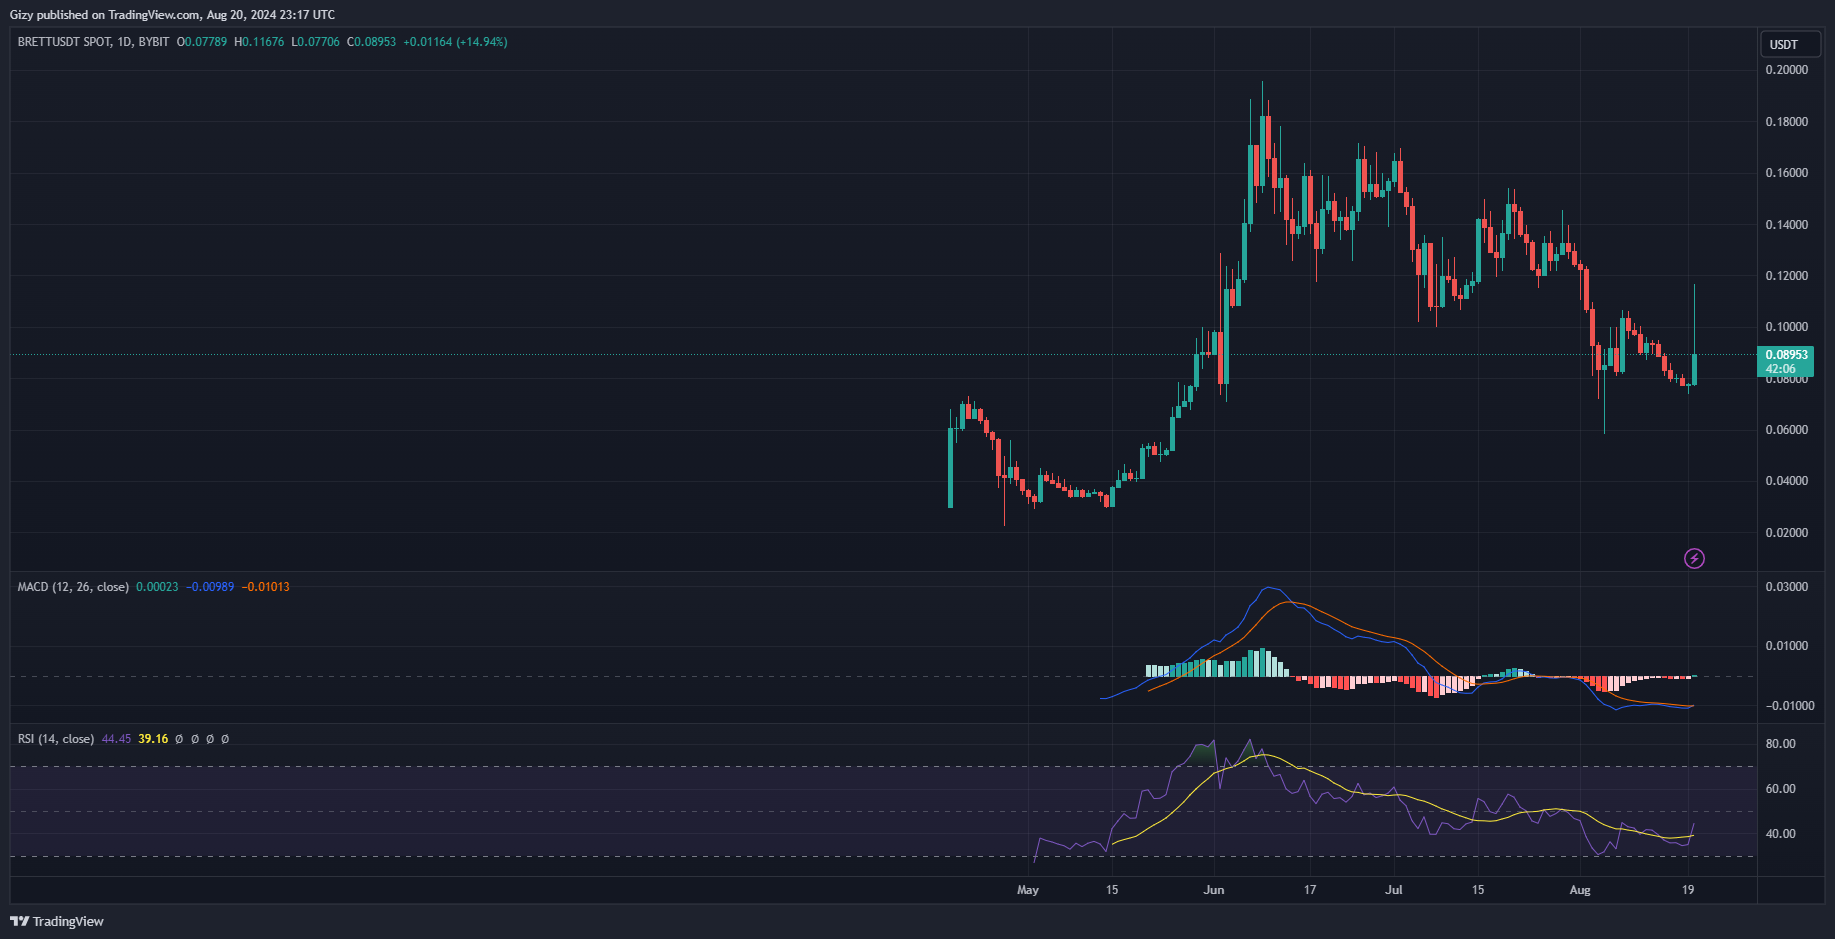
    The candle representing the day’s trading action suggests that traders are taking profit already. It started trading at $0.077 but shot to a high of $0.116, which represented a more than 50% increase at the time. However, it retraced as is exchanging $0.089, representing a more than 14% gain.

    The moving average convergence divergence hints at a further uptrend. The 12-day EMA is slightly above the 26-day EMA in reaction to the latest surge. Nonetheless, with the bullish convergence over, the divergence will continue, which may mean further price increases.

    The bulls will look to continue to the uptrend and retest $0.10. It remains to be seen if it’ll happen this week.

    5. Arweave (AR)

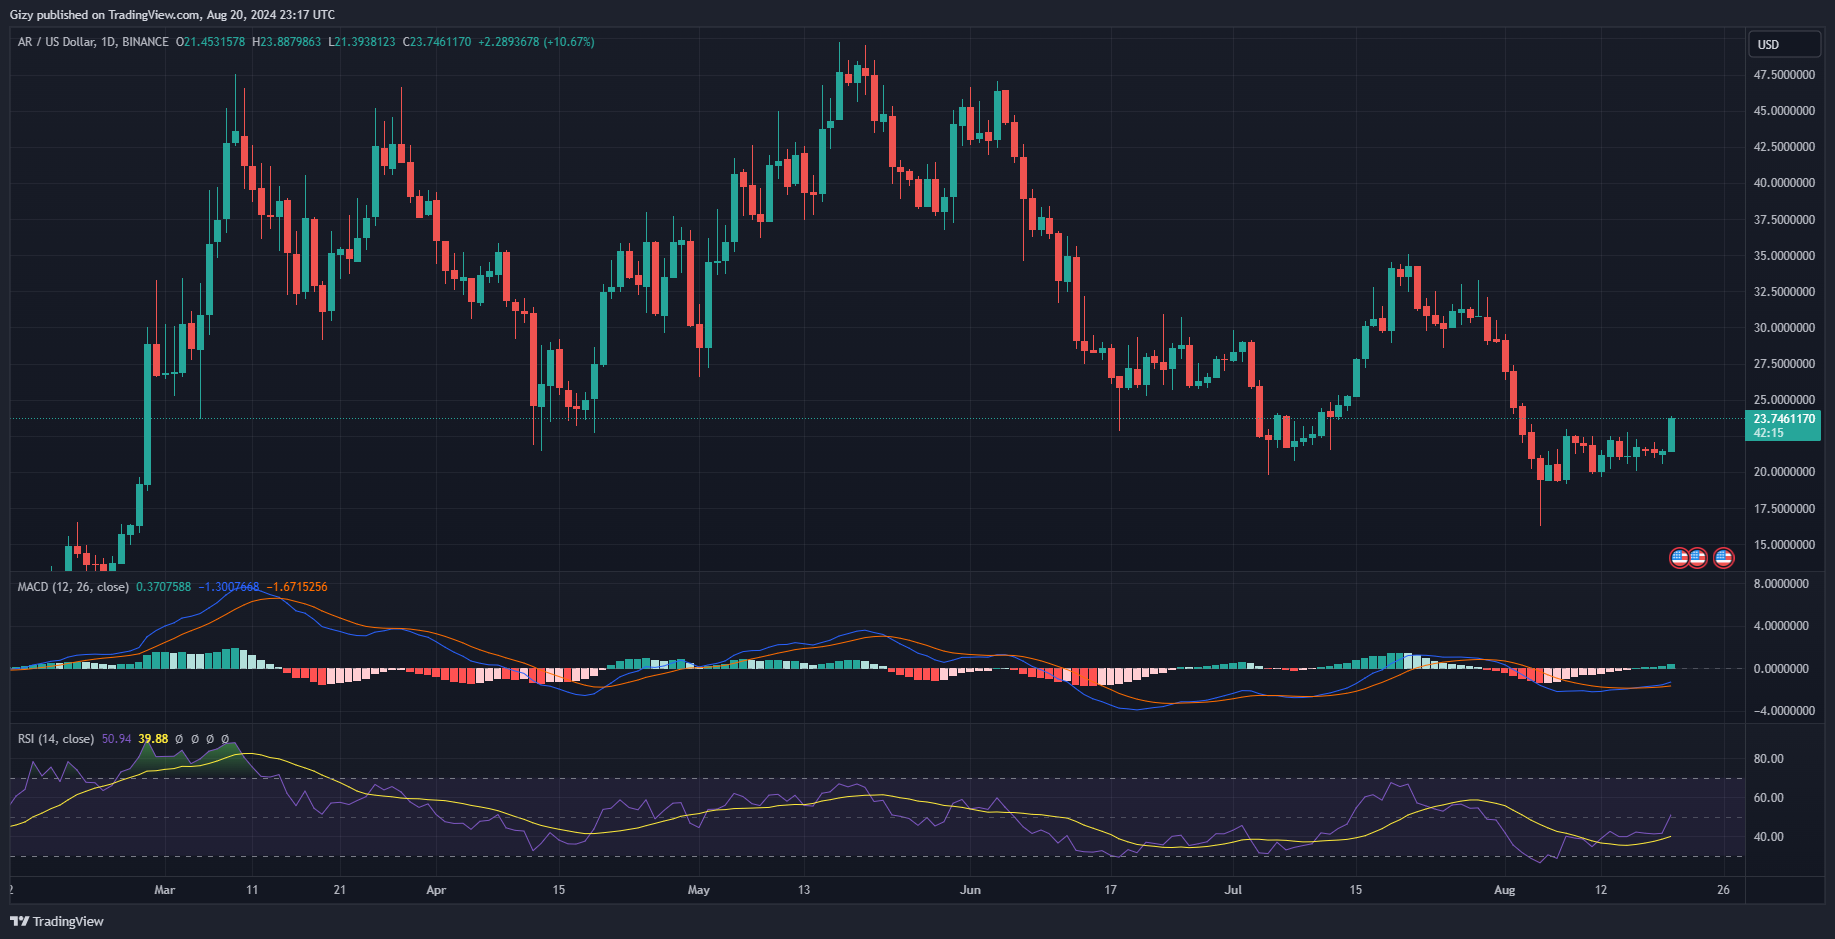
    Arweave is the fourth largest top gainer over the last 24 hours. It saw massive increase in trading volume, doubling during this period.

    Prices also reacted to the increases. It started trading at $21.4 but surged to a high of $23.7 representing a more than 10% increase. The asset has since traded close to its peak, which may indicate an ongoing buyback.

    MACD suggests that the buyback may continue as it continues printing buy signals. The Relative Strength Index also agrees with this reading. It is above 50, indicating that the asset is seeing moderate buying pressure.

    The next price target is $25. The cryptocurrency will flip it if trading conditions remain the same.

  • Crypto Analysis 30/7: BTC, ETH, SOL, BNB

    Crypto Analysis 30/7: BTC, ETH, SOL, BNB

    ETH continues to see further price declines in the last seven days. Since the ETF launch, the coin has not seen any significant improvement as outflows mount.

    Following promises by Donald Trump to make a United States Bitcoin reserve if elected, the current administration’s latest move of $2 billion worth of Bitcoin is viewed as against this promise. Crypto proponents further accused the government of trying to sabotage the bid. Nonetheless, there has been no indication it is planning to dump the transferred funds.

    However, the crypto market has yet to register any table improvements since the start of the week. Let’s see how some assets in the top 10 are performing.

    BTC/USD

    Bitcoin has not registered any price improvement since the start of the week. It is currently on the second day of consistent decline. The previous day’s action left many in shock as it retraced after looking so promising.

    During the previous intraday session, it surged to a high of $70k for the first time in almost three months. The hike sparked speculation of the asset’s return to its all-time high. Others called for a new ATH of around $74k. All speculation failed, as the coin saw massive declines. As a result, it closed at $666,65 and registered losses of more than 2%.

    Bitcoin’s downtrend is ongoing, with the coin seeing almost a 2% drop. It recently flipped the $66k support and is trading at $65k. Nonetheless, the bills are staging a buyback as the current candle shows a notable wick following its rebound at $65,302.

    However, indicators are still bearish despite the small efforts. The moving average convergence divergence is very close to completing a bearish convergence. Both the 12-day EMA and 26-day EMA are very close to interception, which may happen in the next 24 hours if the price improvement stops.

    Nonetheless, the relative strength index is yet to respond to the ongoing attempt at buyback. The metric is 54 and shows no signs of recovery. The trend may indicate lingering selling pressure amidst bullish efforts.

    ETH/USD

    Ethereum is seeing a small decline at the time of writing. Although not notable, the apex altcoin retested $3,200 but rebounded at $3,232. The latest decline marks another failed recovery attempt, as the asset failed to continue its climb after peaking at $3,365.

    The latest price trend closely mimics that of the previous day. ETH touched $3,400 but faced massive rejection and retraced. It dropped to a close at $3,317 and closed with gains of less than 2%. As a result of the latest trend, the asset is printing a doji on the weekly scale.

    Nonetheless, the latest price brings the apex altcoin closer to the first pivot support at $3,147. Indicators are also pointing to a possible retest. One such is MACD, which is printing sell signals. The metric showed a bearish divergence during the previous week and has since showed no signs of recovery.

    ETH continues to see massive resistance at the 50-day exponential moving average, which explains its recent failure to surge above $3,400. Amidst the failure, the coin continues to see less buying pressure pointed out by the accumulation and distribution chart.

    SOL/USD

    As of the time of writing, Solana is seeing positive fundamentals. A few hours before press, the United States Securities and Exchange Commission recently announced its withdrawal from a case that could define the asset under review as a security if won. The regulators stated that they want to amend their policies to accommodate cryptocurrency and other assets.

    However, it appears that the market ignored this bullish announcement and failed to react accordingly. As a result, it has continued its price decline, with an almost 2% drop in the last 24 hours. Nonetheless, the wick sticking out of the current candle suggests attempts at buyback. It rebounded at $175 and is exchanging at $179.

    Indicators have yet to react to the latest bullish actions, as the moving average convergence divergence continues to print sell signals. The 12-day EMA is heading for an interception with the 26-day EMA. This event may happen in the next 24 hours.

    The relative strength index is also on the decline amidst growing buying pressure. It is at 59 having been overbought last week.

    The bulls must defend prices above $180, as the sellers are likely to stage a decline below $170. Nonetheless, the asset may see notable demand concentration at the 23% fib level.

  • Top Five Cryptocurrencies to Watch This Week (July 16)

    Top Five Cryptocurrencies to Watch This Week (July 16)

    The cryptocurrency WLD has experienced a significant surge of over 21% in the past 24 hours, attributed to a boost in fundamentals from its parent firm. Market analysts anticipate that WLD and other assets will continue to see gains over the next five days.

    Furthermore, the global cryptocurrency market cap has surpassed $2.30 trillion, rebounding from its decline two weeks ago. This upturn, with a growth of over 2% in the last 48 hours, is driven by the upward movement of various assets that have reclaimed essential levels.

    One notable performer is PEPE, which has surged by more than 13% in the past 24 hours, reaching above $0.000012 and marking a remarkable 30% increase over the previous seven days.

    In other news, the German government has divested all of its BTC holdings, alleviating concerns among traders. This development has contributed to an improvement in market sentiment, as evidenced by the fear and greed index rising to 57, a substantial increase from the previous week’s value of 37.

    Given these bullish indicators, many are curious about the market’s anticipated performance in the upcoming days.

    Top Five Cryptocurrencies to Watch

    Bitcoin (BTC)

    Bitcoin is currently facing challenges in maintaining prices above $64,000. After reaching a high above $65,000, it dropped to as low as $62,000. Although it has rebounded to $64,418, the present candlestick pattern indicates a bearish trend, a deviation from the previous four days.

    Despite its climb above the pivot point, Bitcoin has struggled to maintain stability. Concerns relating to the potential impact of Mt. Gox on creditor reimbursement have contributed to recent volatility in the market. However, bullish indicators, such as the moving average convergence divergence, suggest that the cryptocurrency has displayed a bullish divergence and is on an upward trajectory. The 12-day EMA is approaching as trading conditions improve.

    In the immediate future, Bitcoin’s price may consolidate within a narrow range before a potential breakout. A drop from the current price could result in a decline to as low as $62,000. However, if trading conditions continue to improve, Bitcoin may achieve stability above $66,000.

    Ethereum (ETH)

    The much-anticipated ETH ETF is set to be launched next week. This has caused a lot of buzz within the trading community, with the asset being a hot topic of discussion on crypto-related platforms. The price of ETH has been steadily climbing since Friday amidst increasing speculation about the likelihood of Donald Trump becoming the next US president.

    Yesterday, ETH saw a significant surge in value, starting trading at $3,246 and coming close to hitting the $3,500 resistance level before retracting slightly. However, the day ended with the asset gaining over 7%. There are signs of a bullish trend emerging, and it seems that the cryptocurrency might be gearing up for another substantial increase in value.

    It’s important to note that there’s a significant amount of selling pressure around the current price. The Fibonacci retracement levels indicate a balanced struggle between buyers and sellers, as ETH remains above the 23% Fib level.

    Given the concentration of demand at the current price, ether may trade within a horizontal channel before making a final push past $3,500.

    The upcoming ETF launch might drive the price to attempt reaching $4,000, but it’s also likely to stabilize above $3,500. However, if selling pressure increases, it could lead to a drop to $3,200, especially if the 23% Fib level is breached.

    Solana (SOL)

    Solana experienced a significant resurgence, reaching a high of $162 after being absent from the market for over a month. Its return to $160 has sparked speculation about potential further bullish actions.

    These predictions are supported by the coin’s consistent rise over the last five days. A notable event was when it surpassed its pivot point two days ago, starting at $141 and climbing to $148, briefly surpassing the highlighted mark.

    The decisive breakthrough occurred during the previous intraday session, reaching $160. The 12-day EMA is also rising in response to the asset’s recent surges. As indicative of potential further increases, Solana is currently contending with flipping a short-term resistance. Historically, $163 has acted as a barrier to small hikes, but has broken after several attempts.

    A decisive breakthrough of $160 would ensure a rise above the 23% Fibonacci level, presenting another level for the bulls to defend. This breakthrough could occur within the next five days.

    On the other hand, the bears may seize control of the coin, staging selloffs that will see the coin retrace below critical levels. One such is $150. The bulls must defend this mark, as a slip will see the altcoin retrace below $140.

  • Top Five Cryptocurrencies to Watch This Week (July 8)

    Top Five Cryptocurrencies to Watch This Week (July 8)

    Most cryptocurrencies have been on the decline for the past seven days. Relief is in sight, and they see a notable recovery. However, several fundamental factors cause the current downtrend.

    One such is from Mt. Gox. It recently transferred over $2 billion bitcoin from one wallet to another. Traders started panicking as many anticipated that the defunct exchange is planning to dump its bag in anticipation of settling creditors.

    The German government continues to dump its Bitcoin bag. It has sold over 50% of its holding in the last thirty days. Nonetheless, it ramped up its pace, selling over 10,000 in the last seven days.

    Amidst the selloffs, the long-awaited Ethereum ETF is set to hit the market this week.

    Top Five Cryptocurrencies

    Bitcoin

    Currently, Bitcoin is experiencing modest gains with an attempted push past the $58,000 mark, although it has not managed to stabilize above this level and has retraced. Despite this, efforts to reach $58,000 are ongoing.

    Market panic has notably decreased, leading to positive shifts in certain on-chain data. For instance, there has been a more than 2% decrease in exchange reserves, indicating a decrease in supply as buyers absorb the excess available supply. Although there was a 0.24% increase in this metric in the last 24 hours, buyers are making significant headway.

    Germany, the largest seller, has sold over 50% of its holdings in the past fourteen days. As its holdings decrease, selling pressure may diminish.

    The moving average convergence divergence is responding to the increased buying activity of the coin. After being below 0 for several days, the metric is now showing positive signs. Additionally, the 12-day EMA has halted its downward trend and may begin an upward trend if market conditions remain stable.

    The potential upward trend of the 12-day EMA could signal bullish momentum and may indicate further price increases.

    In the upcoming days, it is anticipated that Bitcoin will surpass $58,000 and potentially test $60,000. However, it is likely that consolidation below the highlighted resistance level will persist over the next 24 hours before any breakout occurs.

    Ethereum

    Over the past four days, Ethereum has been trading within a range defined by the first and second pivot support levels. If it closes around $3,000, it will add to this pattern, with the $3,200 mark being a critical level to watch.

    However, there are concerns about the asset retracing, which could lead to another test of the S2 support at $2,800. The support has held up following two previous attempts in the last four days.

    Ethereum retraced from its high of $3,095, creating a wick, and the current movement is filling this wick, potentially indicating a continuation of the gains. Despite this, ETH has struggled to stabilize above $3,100 and may not see significant gains upon closing.
    The news of an Ethereum ETF hitting the market is seen as positive and is expected to impact prices. Traders are anticipating a potential surge that could break the coin from its current horizontal trend.

    According to the Fibonacci retracement, a close above $3,000 could provide the necessary relief for the S2 support. Currently trading at $3,062, the coin is above the 50% Fibonacci level, which is considered a strong point by many. The next level indicated by the metric is the 38% level at $3,179, with the expectation that Ethereum will surpass this level before the week ends.

  • Top Five Cryptocurrencies to Watch This Week (May 27)

    Top Five Cryptocurrencies to Watch This Week (May 27)

    On May 28, Mt. Gox moved over $9 billion worth of Bitcoin, causing the top coin and other assets to register significant price declines.

    The news of such a move in anticipation of a selloff also affected the global cryptocurrency market cap. It failed to register any significant changes in the last 24 hours. Nonetheless, a closer look at the chart suggests a gradual decline in the market cap.

    Aside from the small decline some cryptocurrencies experienced during the current intraday session, the question of how the crypto market will perform in the coming days arises.

    Top Five Cryptocurrencies to Watch

    Bitcoin (BTC)

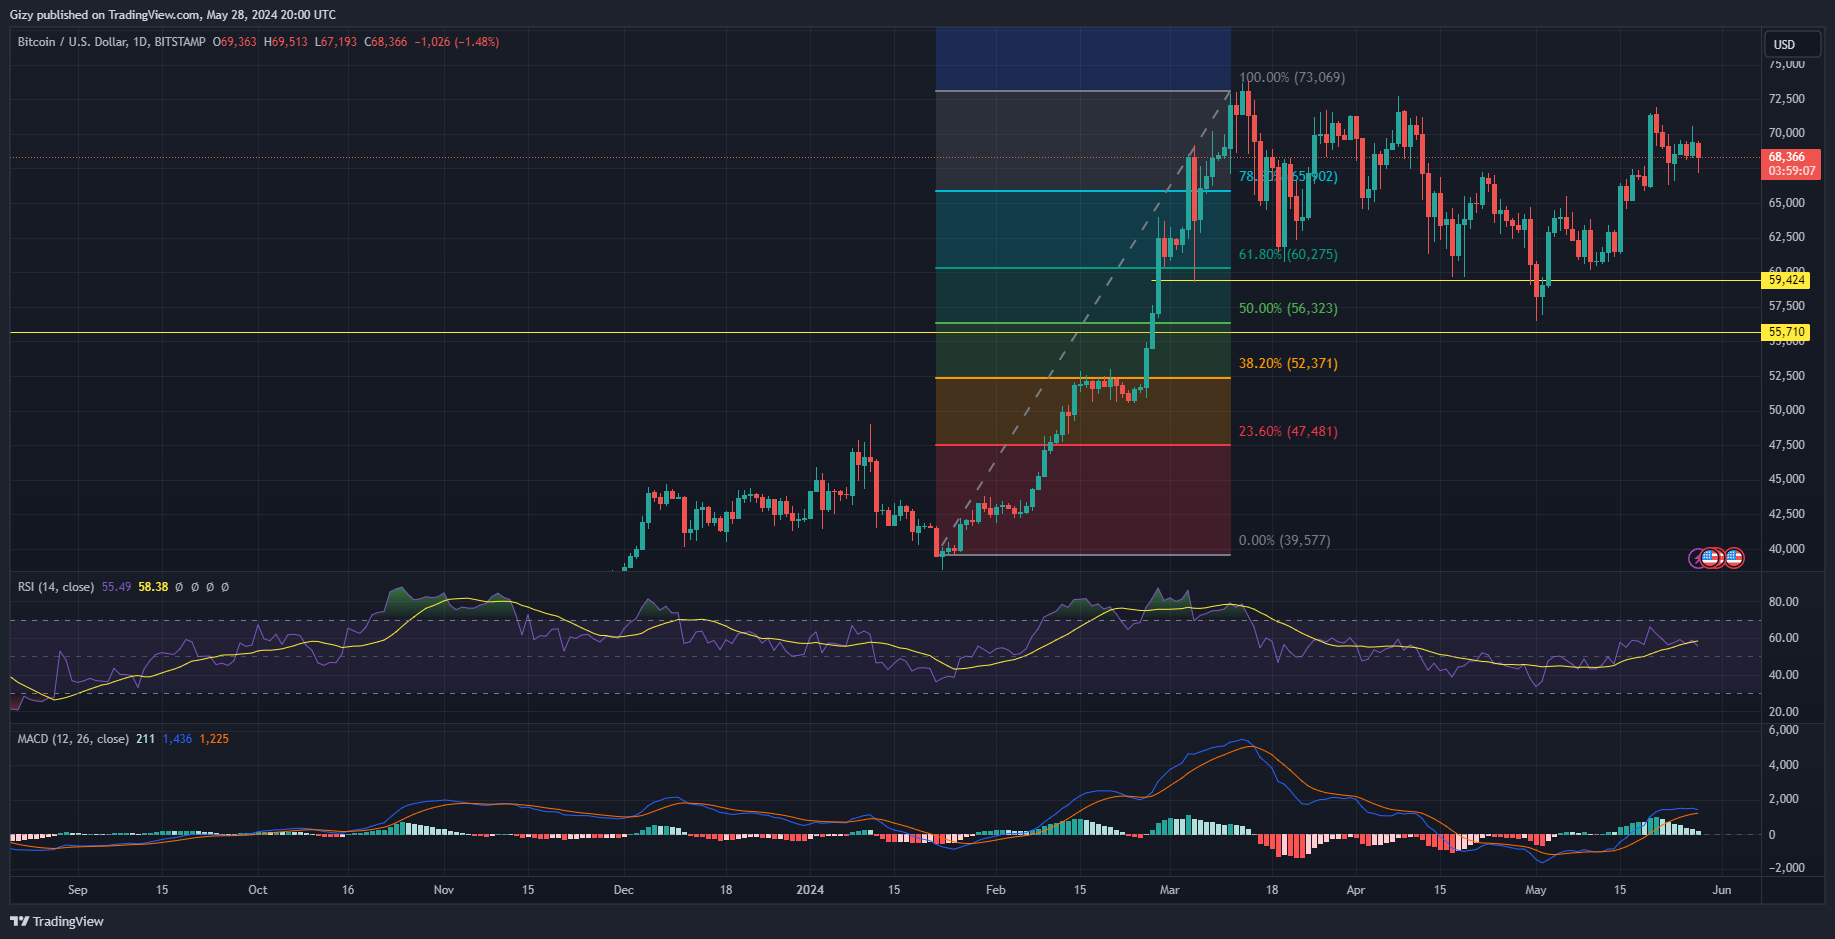
    Bitcoin is currently experiencing an over 2% decline at the time of writing. It was the worst-hit asset in the top 10 as the negative fundamental was centered around it. It has dropped to a low of $67,100 and is struggling to keep prices above $68k.

    The most recent trend is the opposite of what transpired during the previous intraday session. BTC was mostly bullish as it climbed above $70k after more than four days below it. However, the stay above the mark was shortlived as it faced massive rejections at $70,600.

    In the last five days, price action has been range-bound as the coin failed to decisively flip the first pivot resistance. During the period under consideration, it tested the mark consecutively, faced rejections, and lost momentum.

    BTC’s latest low indicates that the asset is edging close to testing the pivot point at $64,100. In response to the most recent trend, the relative strength index is also on the decline. It dropped 54, which still places the bulls at an advantage.

    Nonetheless, the bears may seize the initiative as the moving average convergence divergence is displaying sell signals. The 12-day EMA is close to intercepting the 26-day EMA. With the bearish convergence almost complete, the divergence will take place.

    A continuation of the most recent dip will expedite the process, and the apex coin may drop as low as $64k before recovery.

    Dogwifhat (WIF)

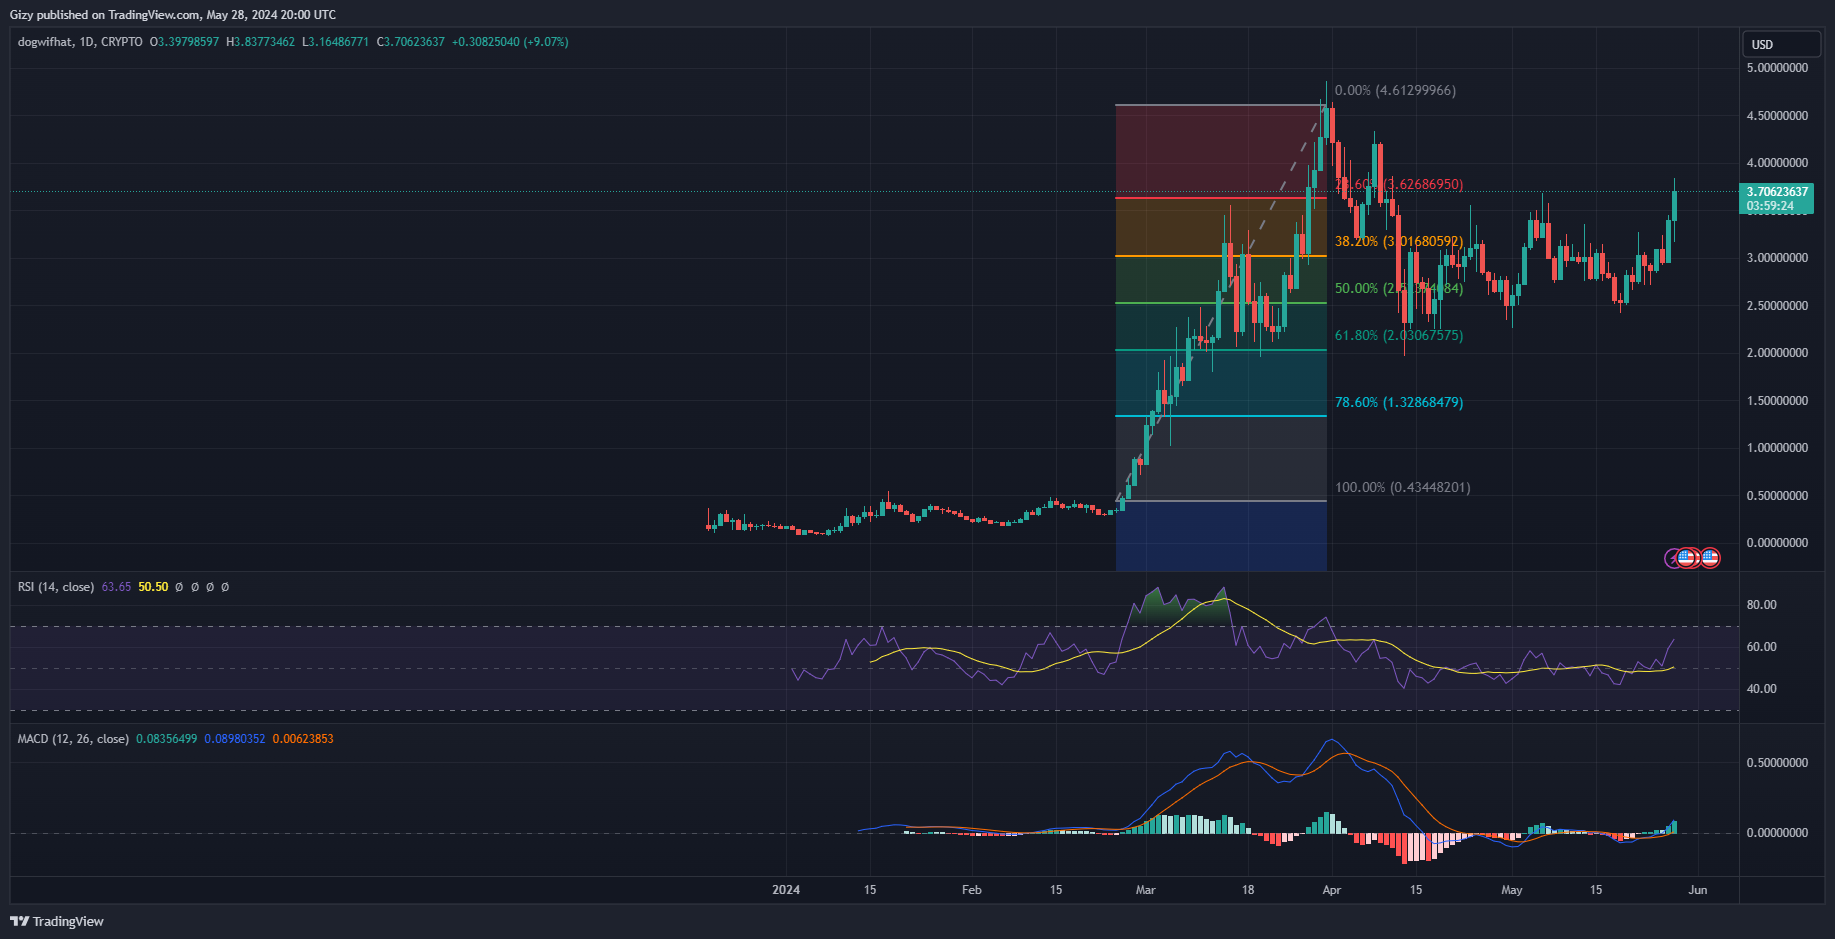
    WIF is experiencing more bullish actions than prevalent sentiment. It edged closer to testing the first pivot resistance but faced major rejections at $3.83. Nonetheless, it dropped to a low of $3.16 a few hours ago before rebounding.

    The most recent surge continues the previous day’s bullish trend. It peaked at $3.44 after kicking off at $2.95. It also ended the period with gains exceeding 15%. Following the hike, it decisively flipped its pivot point.

    With the continuation of the uptrend, the token is edging close to testing the next pivot level at $4.10. Currently up by 9%, the RSI is on the uptrend in reaction to the massive increase in buying volume. WIF saw a more than 60% increase in trading volume in the last 24 hours. The metric is at 63, which points to room for more price hikes.

    The current price $3.70, is above the 23% Fibonacci retracement level. This means it may form a new support around the mark due to the demand concentration present.

    MACD is printing no new signals, which may indicate the continuation of the uptrend. The bulls will look to close the week above the first pivot resistance.

    Stacks (STX)

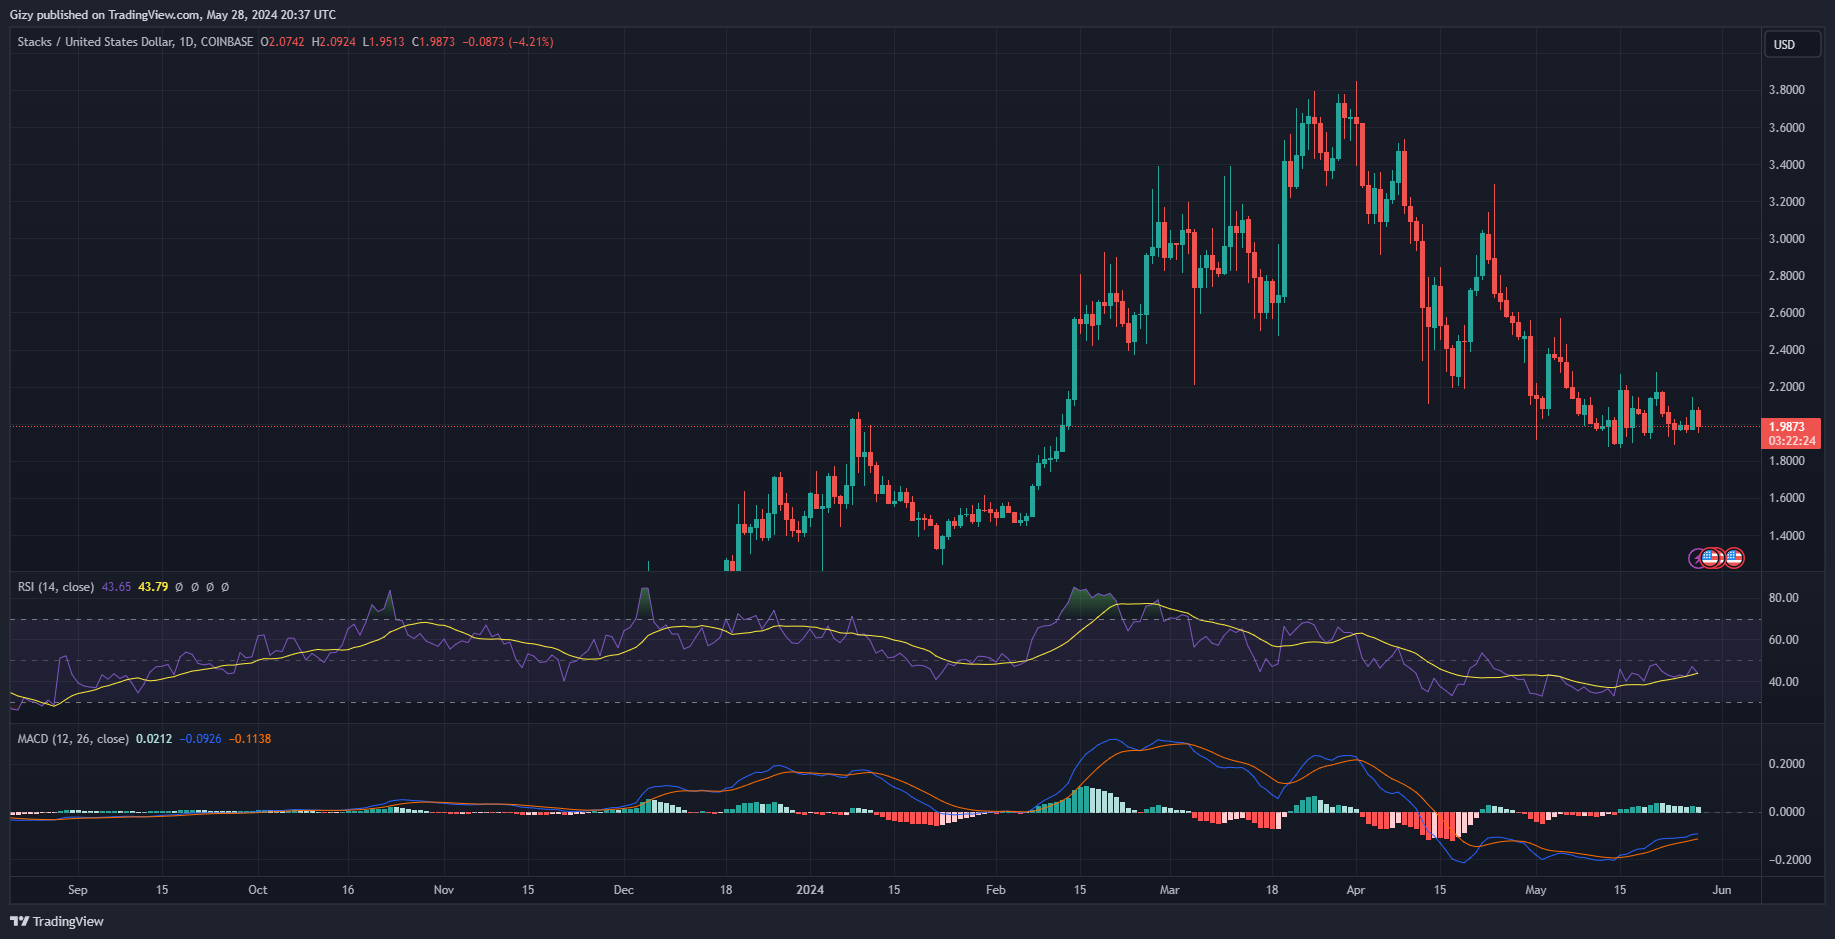
    Stacks is gradually picking up volatility after over four days of reduced movement. However, the last 48 hours were marked with both ups and downs. For example, the previous intraday session saw the asset gain over 5% as it peaked at $2.14. However, it is losing more than half the gains it accumulated during the previous day.

    Trading at a loss of more than 4%, STX may be gearing up for another decline. Currently trading at $1.98, it briefly lost the $2 support.

    The relative strength index points to a notable increase in selling pressure as the culprit of the most recent decline. This comes amidst the over 30% increase in trading volume it saw in the last 24 hours. the metric is at 43 due to this trend.

    MACD is still on the uptrend but will print a sell signal if the bulls fail to stage a buyback. The histogram accompanying the indicator has been almost equal over the last five days. However, if the price decline persists, the 12-day EMA will start a downtrend and intercept the 26-day EMA this week.

    Stacks will retest $1.80. It remains to be seen if it will rebound at this mark. On the other hand, the bulls may stage a buyback and send the asset above $2.10.

    Floki inu (FLOKI)

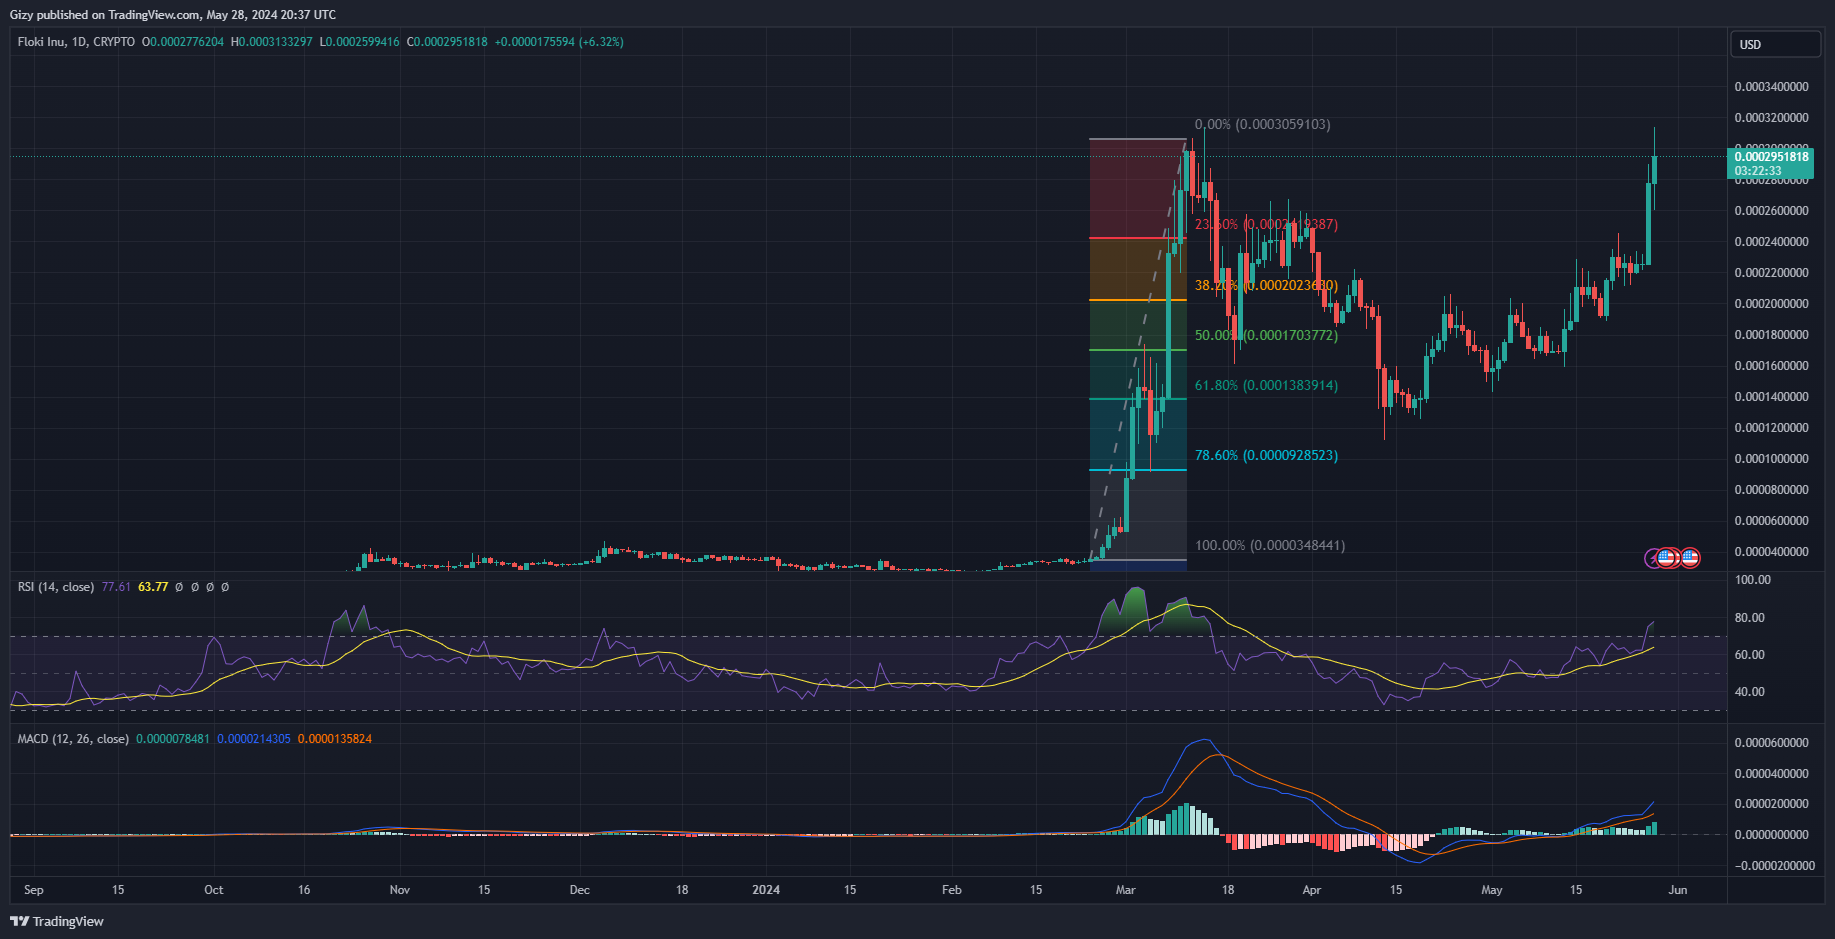
    Floki is up 30% this week, up 16% from the previous week. This comes after it started trading at $0.00019 and peaked at $0.00024.

    The previous intraday session saw volatility return to the altcoin after more than three days of being range-bound. It kicked off the day at $0.00022 and surged to a high of $0.00028. Nonetheless, it ended the day less than its peak but registered gains of over 23%.

    The current price movement suggests that the uptrend is coming to a grinding halt. It surged close to its all-time high but failed to flip it. It faced small corrections and is trading at $0.00029. Nonetheless, the hike comes amidst a decline to $0.00025.

    Currently up by over 5%, the asset is heading to another green close. However, RSI is above 70 which may mean sell signals for many. At 77, the altcoin is under consideration is overbought and further corrections are incoming.

    Nonetheless, the moving average convergence divergence is silent. The 12-day EMA is still on the uptrend.

    With the impending downtrend, FLOKI will drop to the 23% Fib level at $0.00024. Further slip may result in a drop below $0.00022. However, the asset may register a new ATH before the decline starts.

    Sei (SEI)


  • Top Five Cryptocurrencies to Watch This Week (May 13)

    Top Five Cryptocurrencies to Watch This Week (May 13)

    Most cryptocurrencies have seen significant price declines over the last 24 hours. As a result, the global cryptocurrency market cap is down by over 2% in the last 24 hours, compared to less than 4% in the previous seven days.

    The latest decline comes amid reports of Gamestop’s massive rallies. Following the hike in stock value, GME traded for $80 per share in the early hours of May 14. This sparked speculation about whether this is a sign the alt-season is arriving soon.

    Pepe’s latest run further supports this claim. It is up by over 21% on the weekly scale, having attained a new ATH a few hours ago.

    However, the most recent surge in some altcoins did not affect major coins in the top 10. Will they pick up?

    Top five Cryptocurrencies to Watch

    1. Bitcoin (BTC)

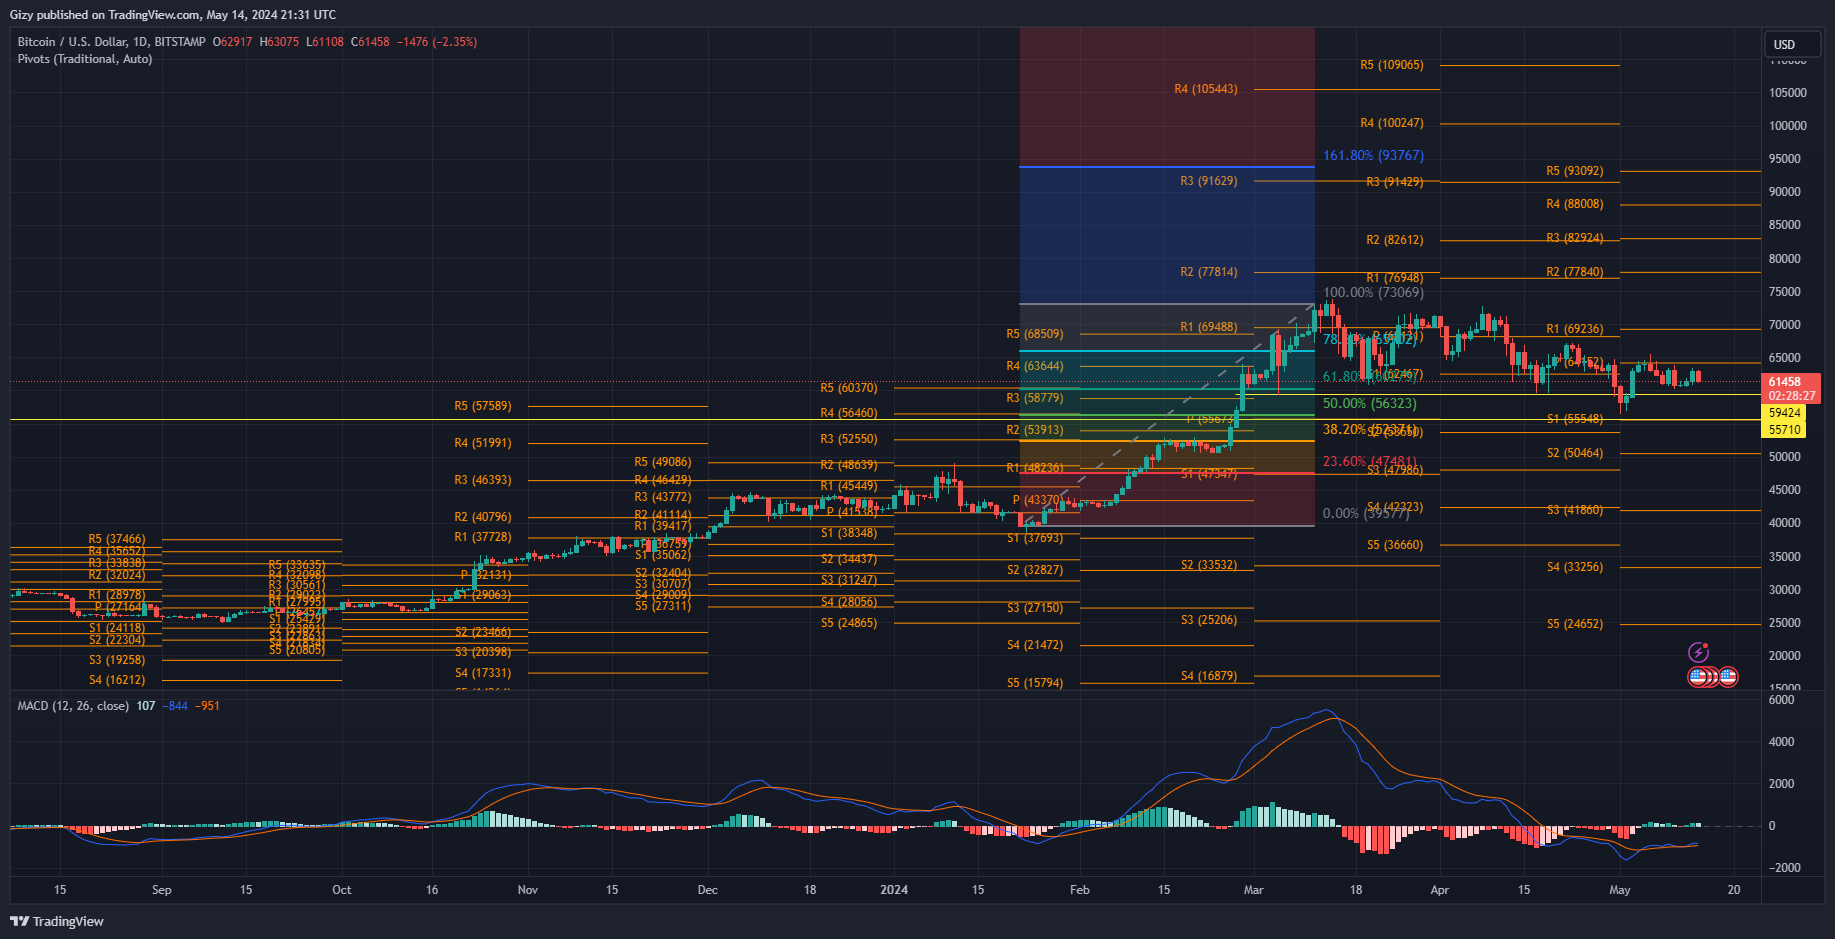
    Bitcoin is edging closer to testing its seven-day support at $60,500. The latest move shows the apex coin lost all the gains it had accumulated during the previous intraday session. The gains came amidst fresh endorsements from two US senators.

    Due to this, it is yet to register any notable price changes on the weekly scale. It is also printing a doji in response to the most recent trend. With the pattern of closing lower than it started the week, BTC will retest $60k.

    Nonetheless, the mark held out following several attempts within the last seven days. The price mark is also close to the 61% Fibonacci retracement level, which many expect rebounds at following a significant dip.

    The bulls will also look to restart the uptrend. They will look to reclaim stability above $65k, as many analysts suggest that this is the make-or-break level for the top asset. The apex coin must decisively flip the pivot point at $64k.

    However, the moving average convergence divergence indicates a further price decline. The 12-day EMA has halted its ascent and may start downhill as the coin loses momentum and buying volume. If this happens, the bears will eye a decline to $59k.

    2. Pepe (PEPE)

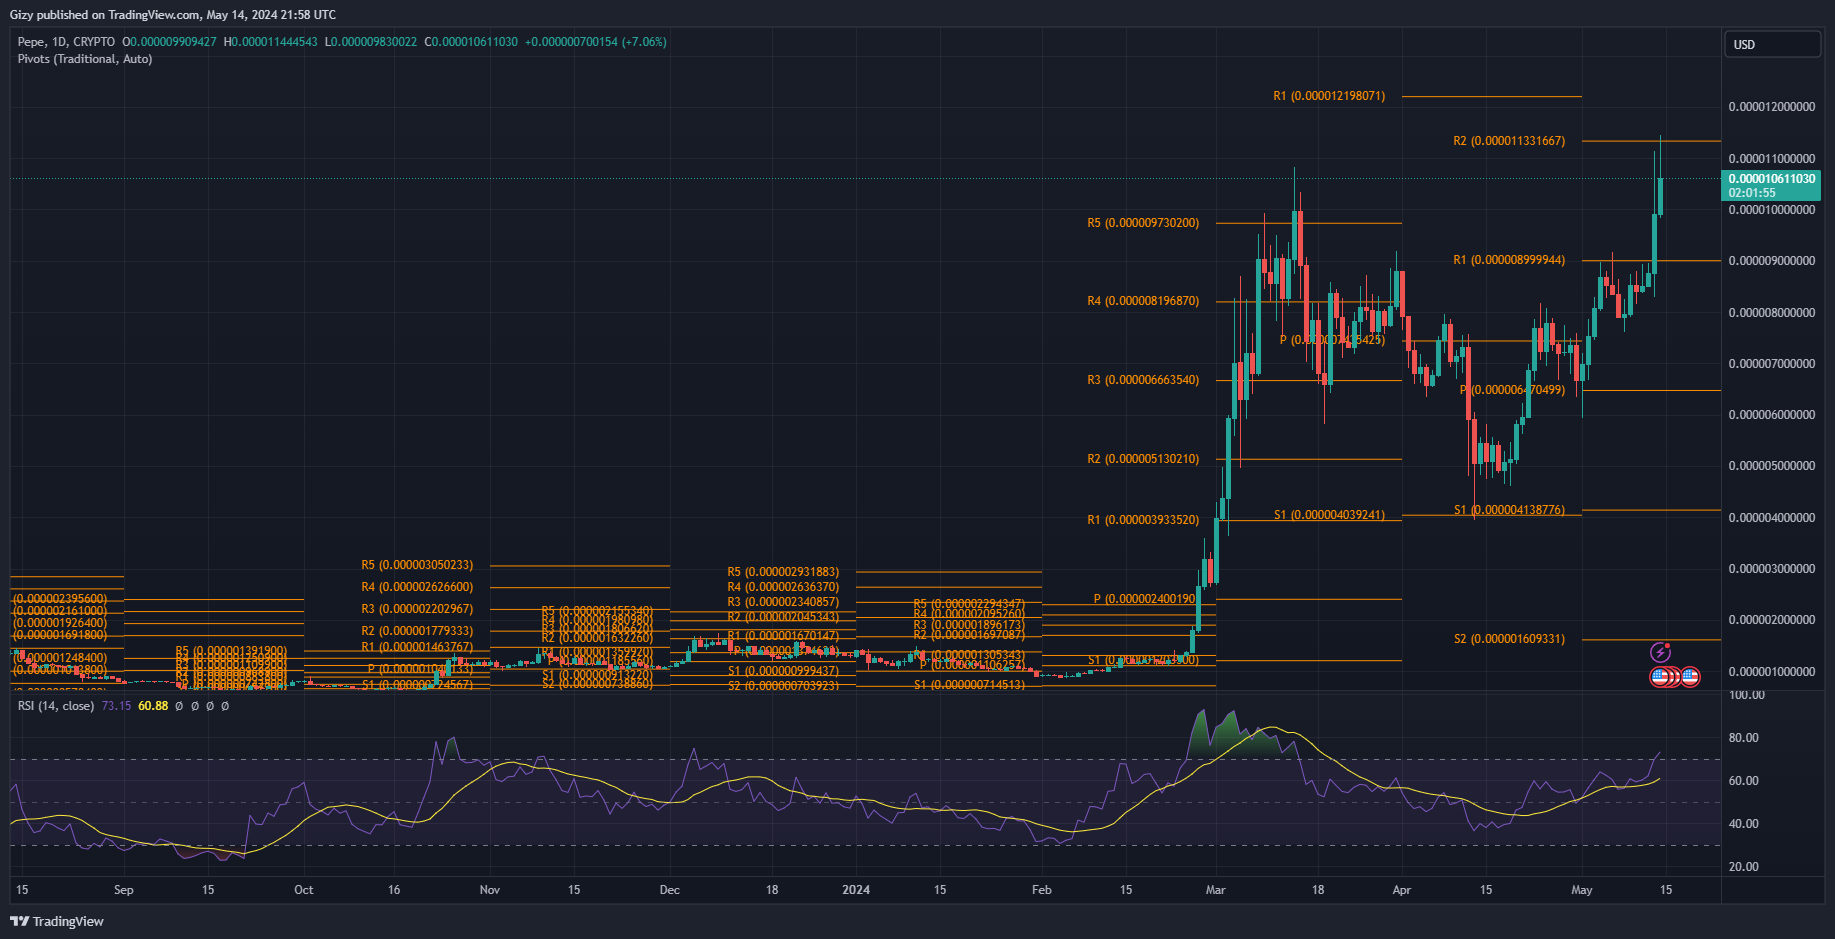
    PEPE surged to a new ATH barely 24 hours after the previous one. During the previous intraday session, it started trading at $0.0000087 but peaked at $0.0000111, the all-time high as of May 13. Following the milestone, several traders took profit. As a result, the asset ended the day with less than half its total profit.

    The same trend took place during the current session, as the token surged to a new ATH. It went less than 3% higher as it climbed above its second pivot resistance at $0.0000113. As with the previous day, traders took profit, and speculation of the asset’s next price action differs greatly as uncertainty grows.

    Nonetheless, if the bullish trend continues, the bulls will look to retest the second PR. Flipping it decisively will result in the PEPE surging as high as $0.000012. MACD points to this possibility as the indicator 12-day EMA continues its uptrend.

    However, the relative strength index is blaring warnings. Due to the recent bullish move, the asset has been overbought as it has crossed 70. This means the coin will experience notable corrections in the coming days.

    If the bearish reading plays out, the token will sink as low as the first pivot resistance at $0.0000089. The bulls must defend this level, as failure will result in a drop to $0.0000080.

    3. Render (RNDR)

    Render is currently seeing one of the biggest corrections in weeks. It is struggling to keep its price above it seven-day support at $9.90. Nonetheless, it is experiencing significant demand concentration at the first pivot resistance.

    Nonetheless, the most recent price movements are the opposite of what the asset had during the previous intraday session. It gained almost 4% compared to the more than 10% loss during the present intraday session.

    In response to the most recent change in trend, MACD is printing sell signals. The 12-day EMA halted its uptrend. It’s lightly arched downwards and will start going downhill if selling pressure continues. This will result in the start of a bearish convergence. Additionally, RSI is at 54 after dropping from 67 in less than 24 hours as selling pressure mounts.

    Currently trading above the 50-day EMA, a further price decline will see the asset retest this critical metric. It could also drop to $9.30 after it loses its current support at $9.90.

    On the other hand, the bulls will attempt buyback. The next target may be the second pivot resistance at $12. Nonetheless, the asset must gain stability above $11 to achieve this feat.

    4. Floki Inu (FLOKI)

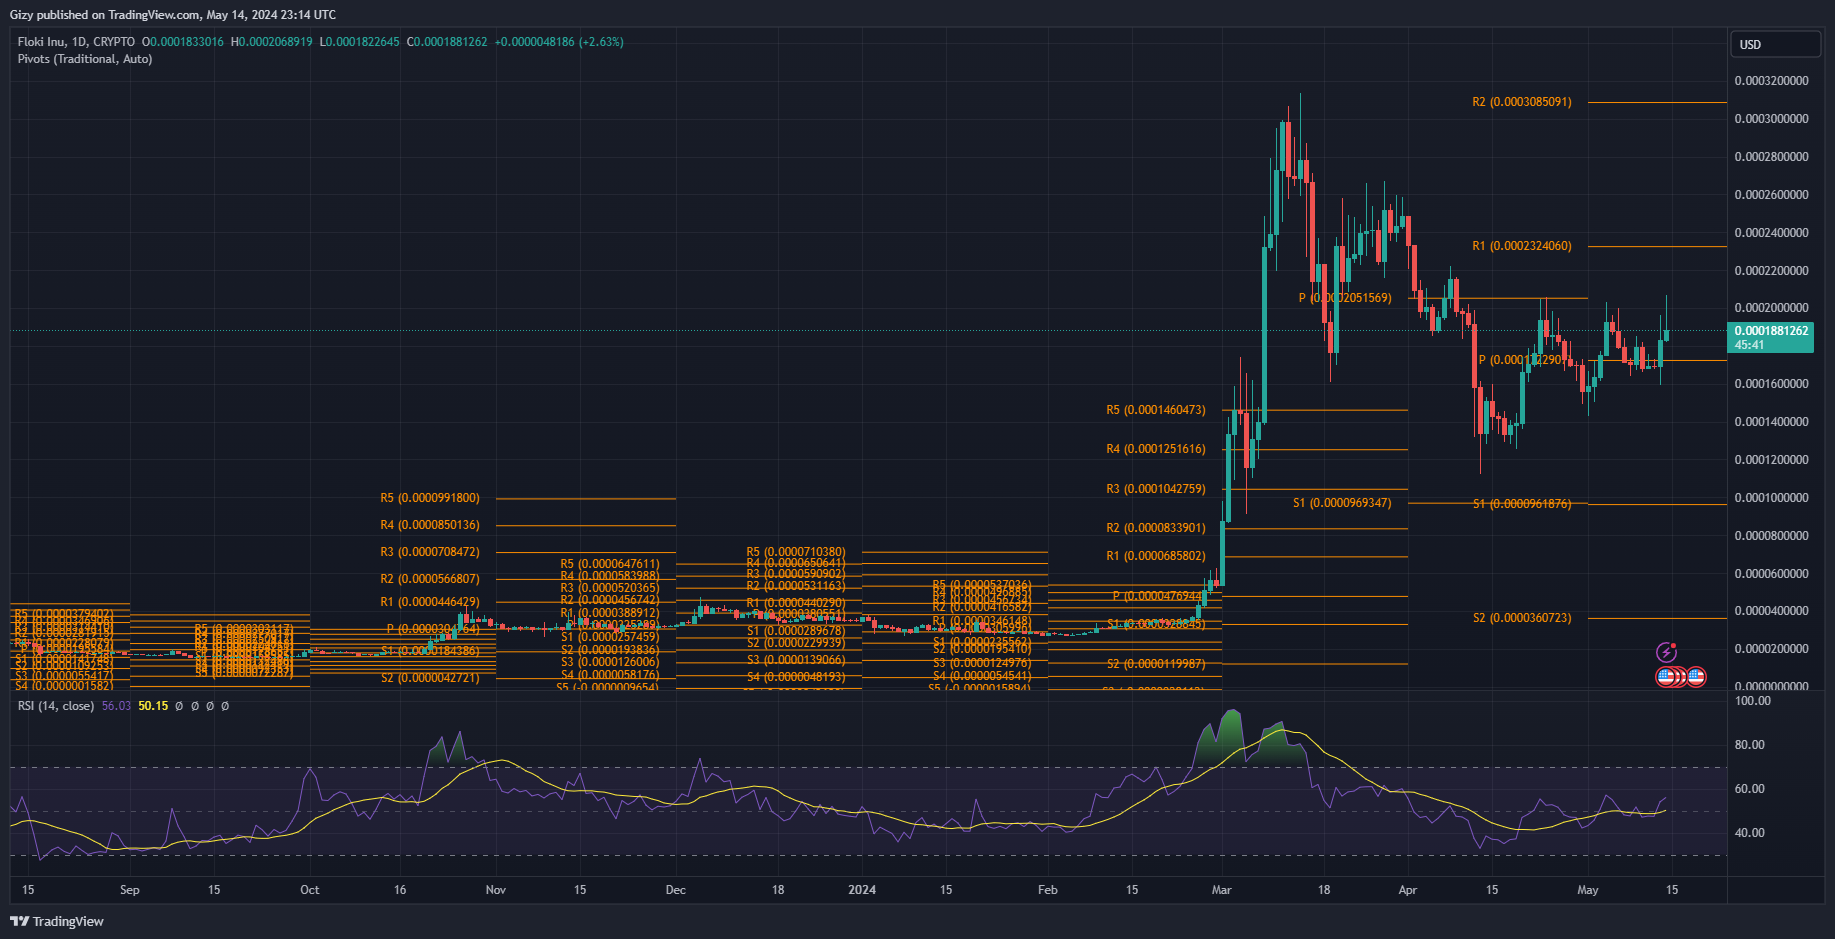
    Floki is also seeing a significant change in value in the last seven days. It gradually attained its seven-day high during the previous intraday session as it started trading at $0.00016 and surged to $0.00019. It faced massive corrections at the mark afterward and ended the day with gains of over 8%.

    It attained a new high during the current session. The Ethereum token peaked at $0.00020 but is trading at $0.00019, which signifies gains of over 3%. The latest surge also marks an over 10% increase on the weekly scale.

    Nonetheless, in response to the most recent surges, the relative strength index is on the rise. It is at 56 which places the bulls at an advantage and hints at further price increases.

    In the same vein, MACD is printing buy signals. The 12-day EMA is on the uptrend following a close bearish divergence. The latest change in trajectory comes amidst the growing buying pressure the asset is seeing.

    With the bearish readings from these indicators, Floki will continue to trade above its pivot point at $0.00017. It will edge to retest the first pivot resistance at $0.00023. To attain this, the asset must gain stability above its seven-day resistance at $0.00020.

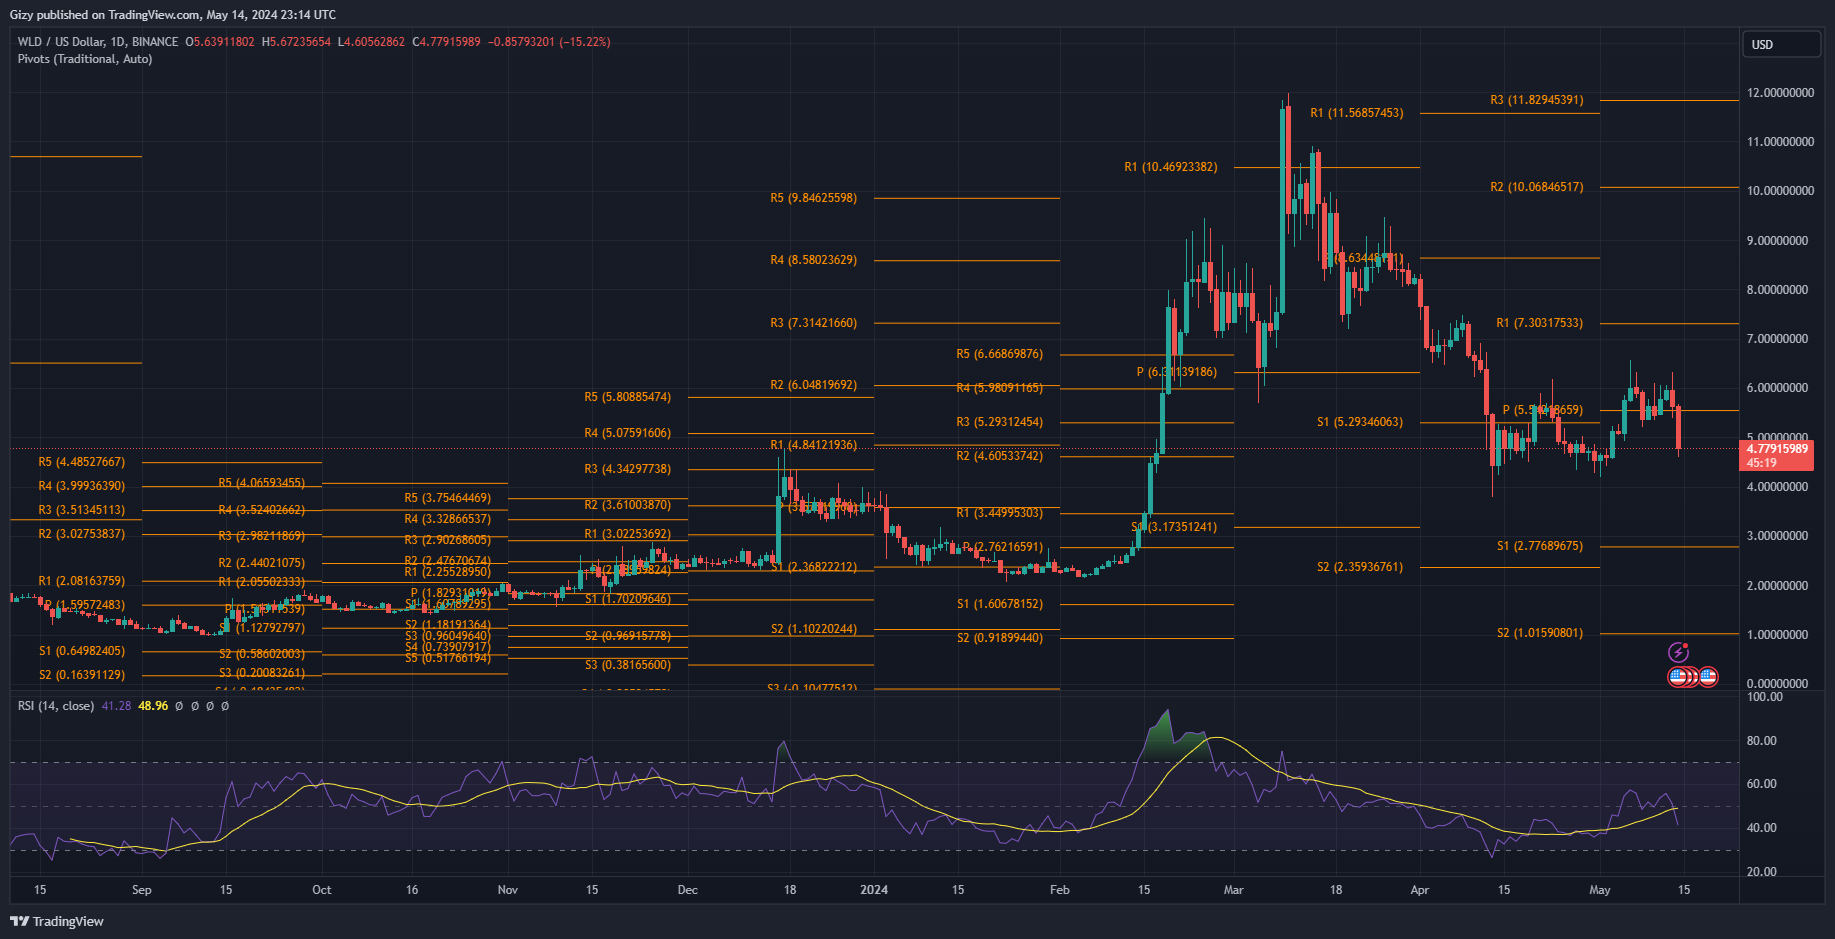
    5. Worldcoin (WLD)

    Worldcoin is facing a lot of backlash from the crypto community following the announcement of a possible dump by insiders. They estimated the dump would be around billions worth of WLD, which would result in a massive price decline.

    Some traders sold their bags in a bid to avert such losses. This explains the asset’s current downtrend. It has been down by over 15% in the last 24 hours as several indicators flipped bearish. Nonetheless, the most recent dump is a continuation of the previous day’s trend that saw it lost over 5%.

    It remains to be seen if the decline will continue. It will retrace as low as $4.30 if the downtrend continues. However, the bulls may attempt recovery the coming days.

  • Top FIve Cryptocurrencies to Watch This Week (April 30)

    Top FIve Cryptocurrencies to Watch This Week (April 30)

    Most cryptocurrencies are down considerably and have retested several essential levels. Ethereum retraced by over 5% in the most recent market and dropped below $3k.

    A few minutes ago, Binance founder Changpeng Zhao was imprisoned for four months for failing to establish adequate anti-money laundering protections. The crypto market is reacting to this news as the bleeding market has worsened in the past hour.

    In response, the global cryptocurrency market cap is down by almost 2%, bringing the total loss to over 4% on the 24-hour scale. Some of the top losers over the last 24 hours included SEI, HNT, and LDO, as they lost over 10% each.

    With the decline getting deeper, how will the market perform this week?

    Top Five Cryptocurrencies to Watch

    1. Bitcoin (BTC)

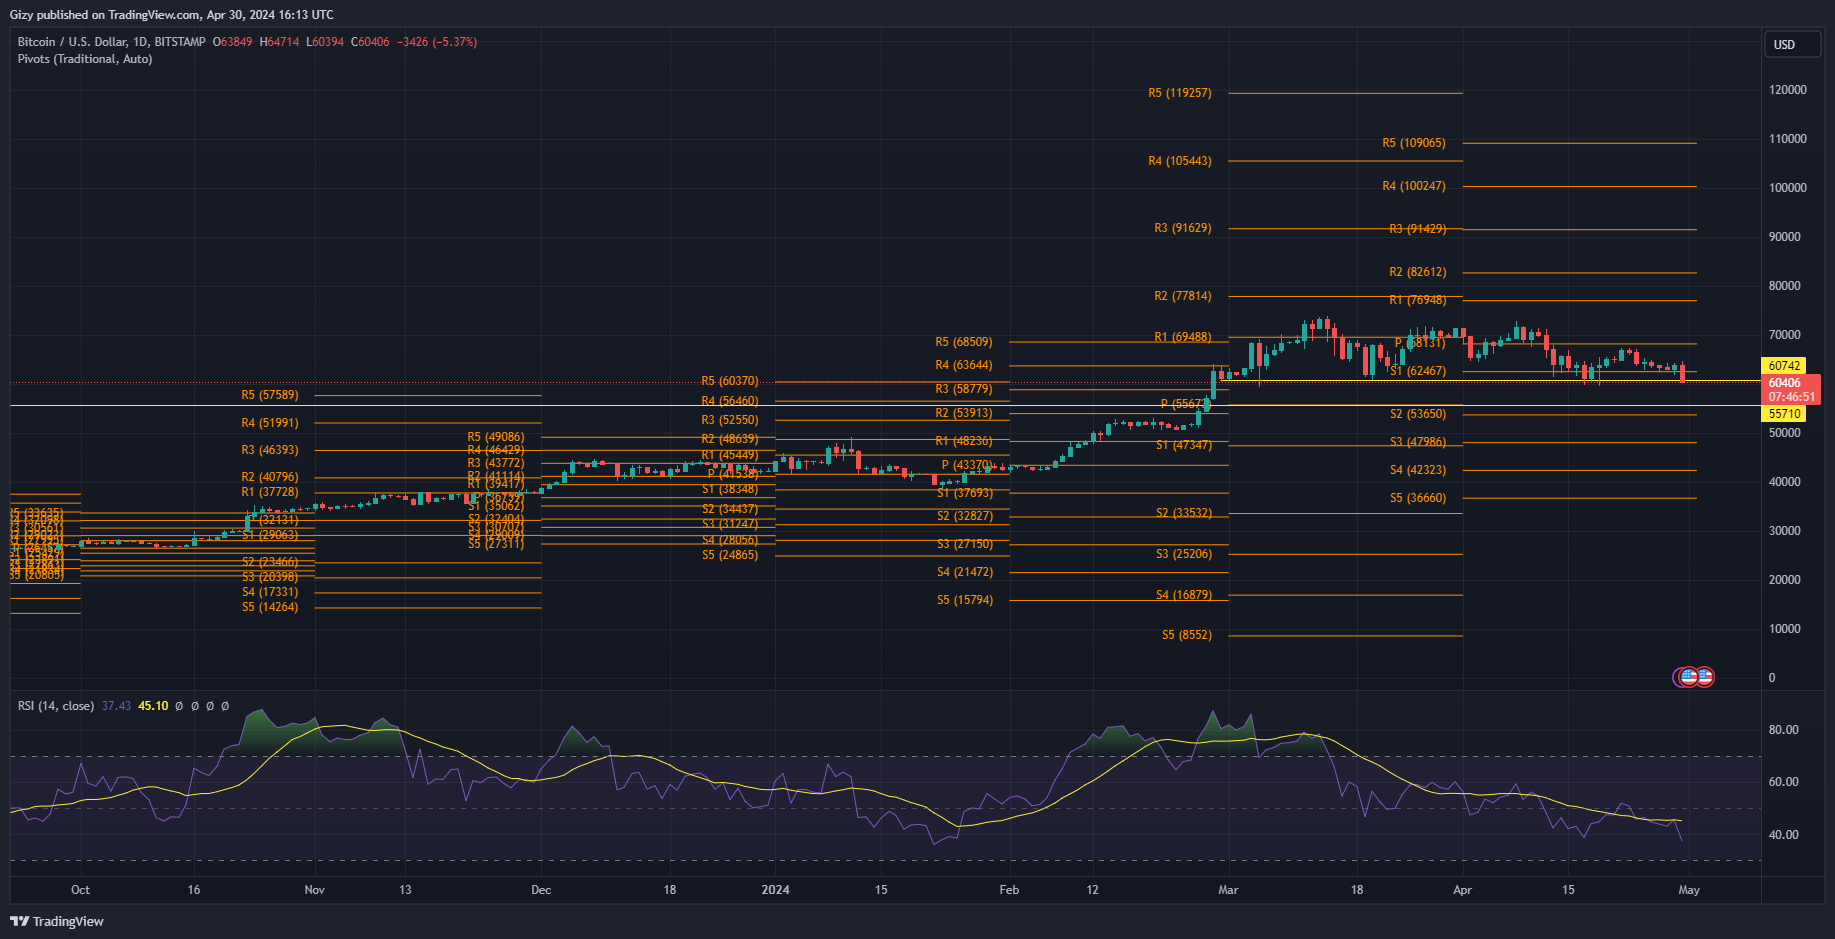
    Bitcoin is not off to a good start this week, continuing the trend it experienced last week. During the previous week, the coin closed with losses exceeding 3%. It surged to a high of $67k but dropped to a close at $63k as the bulls failed to sustain prices.

    Following a Monday marked by intense price volatility, the asset is seeing huge supply as more traders sell off their bags. As a result of the bearish action, the apex coin is currently exchanging at $60,700. The current price shows recovery, as it tested $59k but rebounded.

    Nonetheless, indicators are blaring. One such is the moving average convergence divergence. Following a close bullish convergence, the 12-day EMA continues its descent and is at its lowest level in a year. The decline will continue if the bulls fail to force price recovery in the coming days.

    The relative strength index points to a reversal in price trajectory. The metric is currently trending at its lowest mark in a year. Based on previous movements, the coin sees a buyback when the RSI hits this level.

    If that happens, the apex coin will attempt recovery. Having regained stability above the 61% Fib, the asset will look to gain strength above the 78% Fib at $66k. However, if the selloff continues, BTC will retrace as low as $56k.

    2. Toncoin (TON)

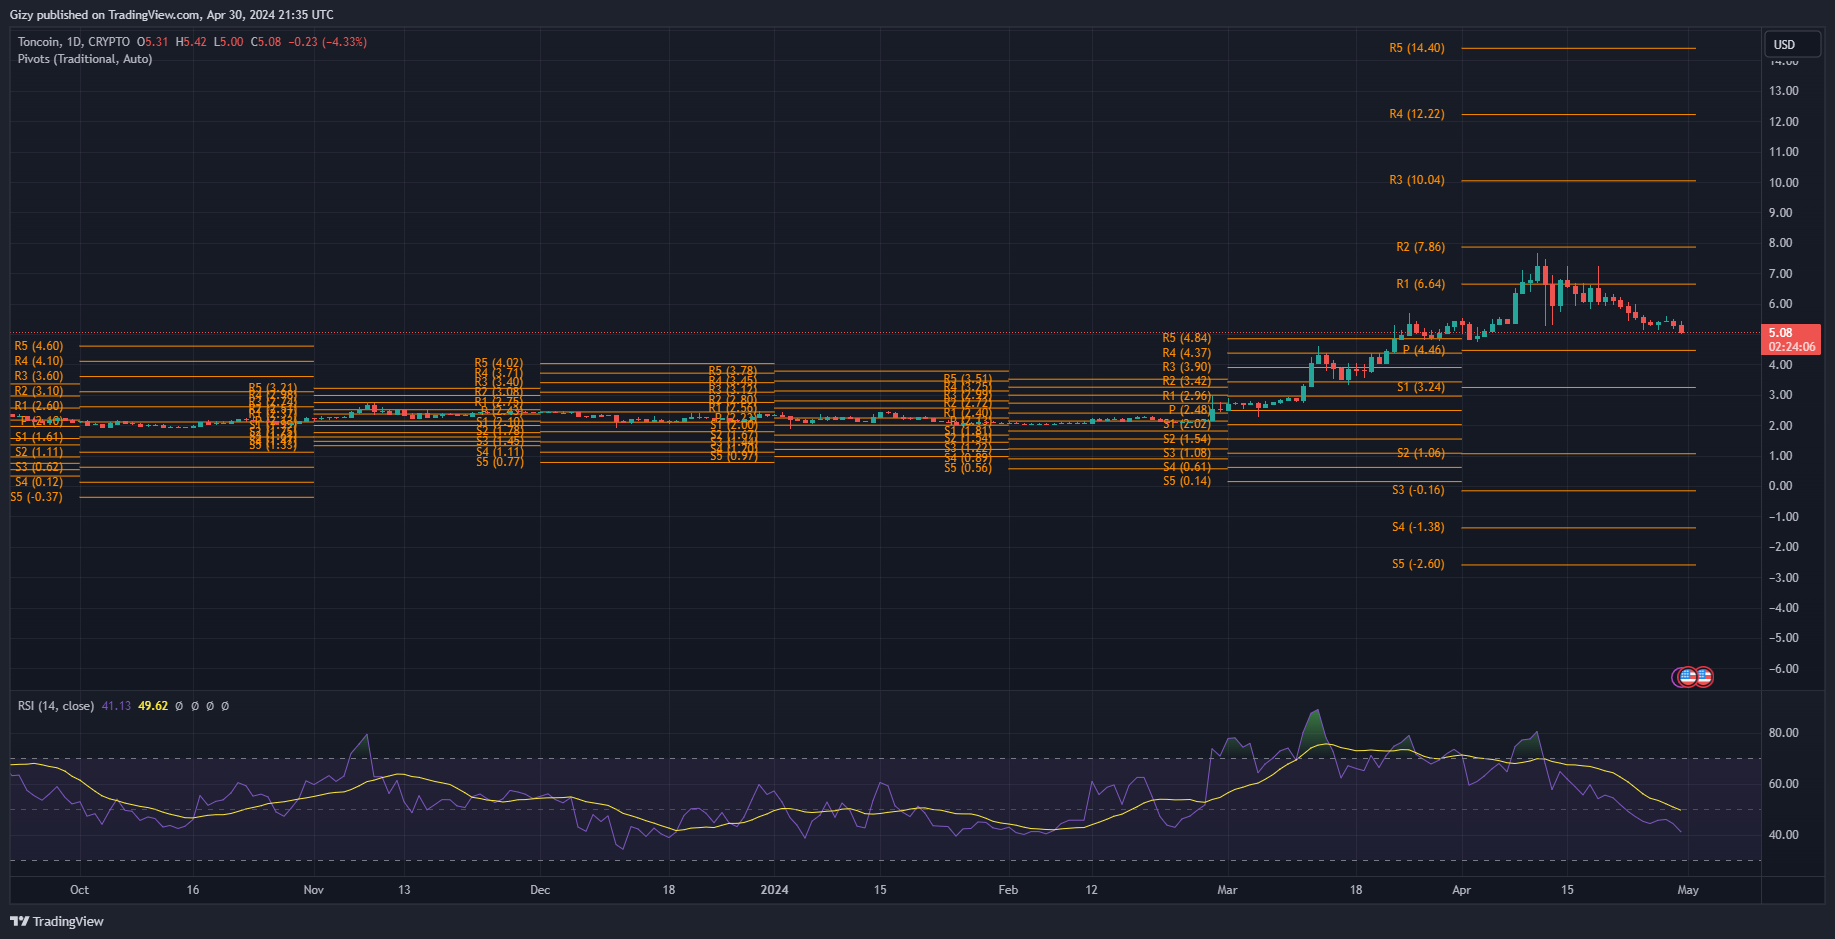
    Toncoin is yet to recover from its decline. During the previous week, it peaked at $6.23, sparking speculations of a return to its previous high. However, this never happened, as it ended the session at $5.42, with losses exceeding 11%.

    Since the new week started, the coin has lost over 6%. However, it showed signs of recovery a few hours ago, peaking at $5.42 but retracing after hitting a brick wall. Due to this, the price went downhill, and it is exchanging at five as the bulls defend the support.

    Nonetheless, the bullish action had little to no effect on indicators like RSI as it continued its downtrend—the metric places the bears at an advantage as it is currently at 41. Nonetheless, previous trends reveal that buyback is imminent as the relative strength index approaches a level the bulls have defended recently.

    If this happens, the asset will hold the $5 support for the rest of the week. It will also attempt the first pivot resistance at $6.64. To achieve this feat, the bulls must accumulate above $6.

    On the other hand hand, if the bearish trend continues, TON may slip below $5 to test its pivot point at $4.46.

    3. Tron (TRX)

    Tron experienced a lot of bullish push during the previous week as Justin Sun continued his bullish escapades. As a result, the asset gained over 9% and hit a peak of $0.12 for the first time in almost fourteen days.

    However, it failed to continue the bullish trend, as it is currently down by over 2% on the weekly scale. During the previous intraday session, it attempted $0.11 but met support and rebounded. The same is playing out during the current session. The asset rebounded at its prior low and is exchanging at its previous low.

    RSI is at the same level as the previous day in response to the most recent trend. However, MACD is hinting at further price declines. The 12-day EMA halted its ascent and will start a downtrend if the TRX has a bearish close today.

    The chart pattern is also printed as a bear flag due to the previous bullish trend. Traditionally, following the bearish pattern, the asset will experience significant declines. Based on previous price movements, the asset may retrace to as low as $0.115 this week and continue downwards. If the current selloff worsens, it may drop as low as $0.110.

    4. Hedera (HBAR)

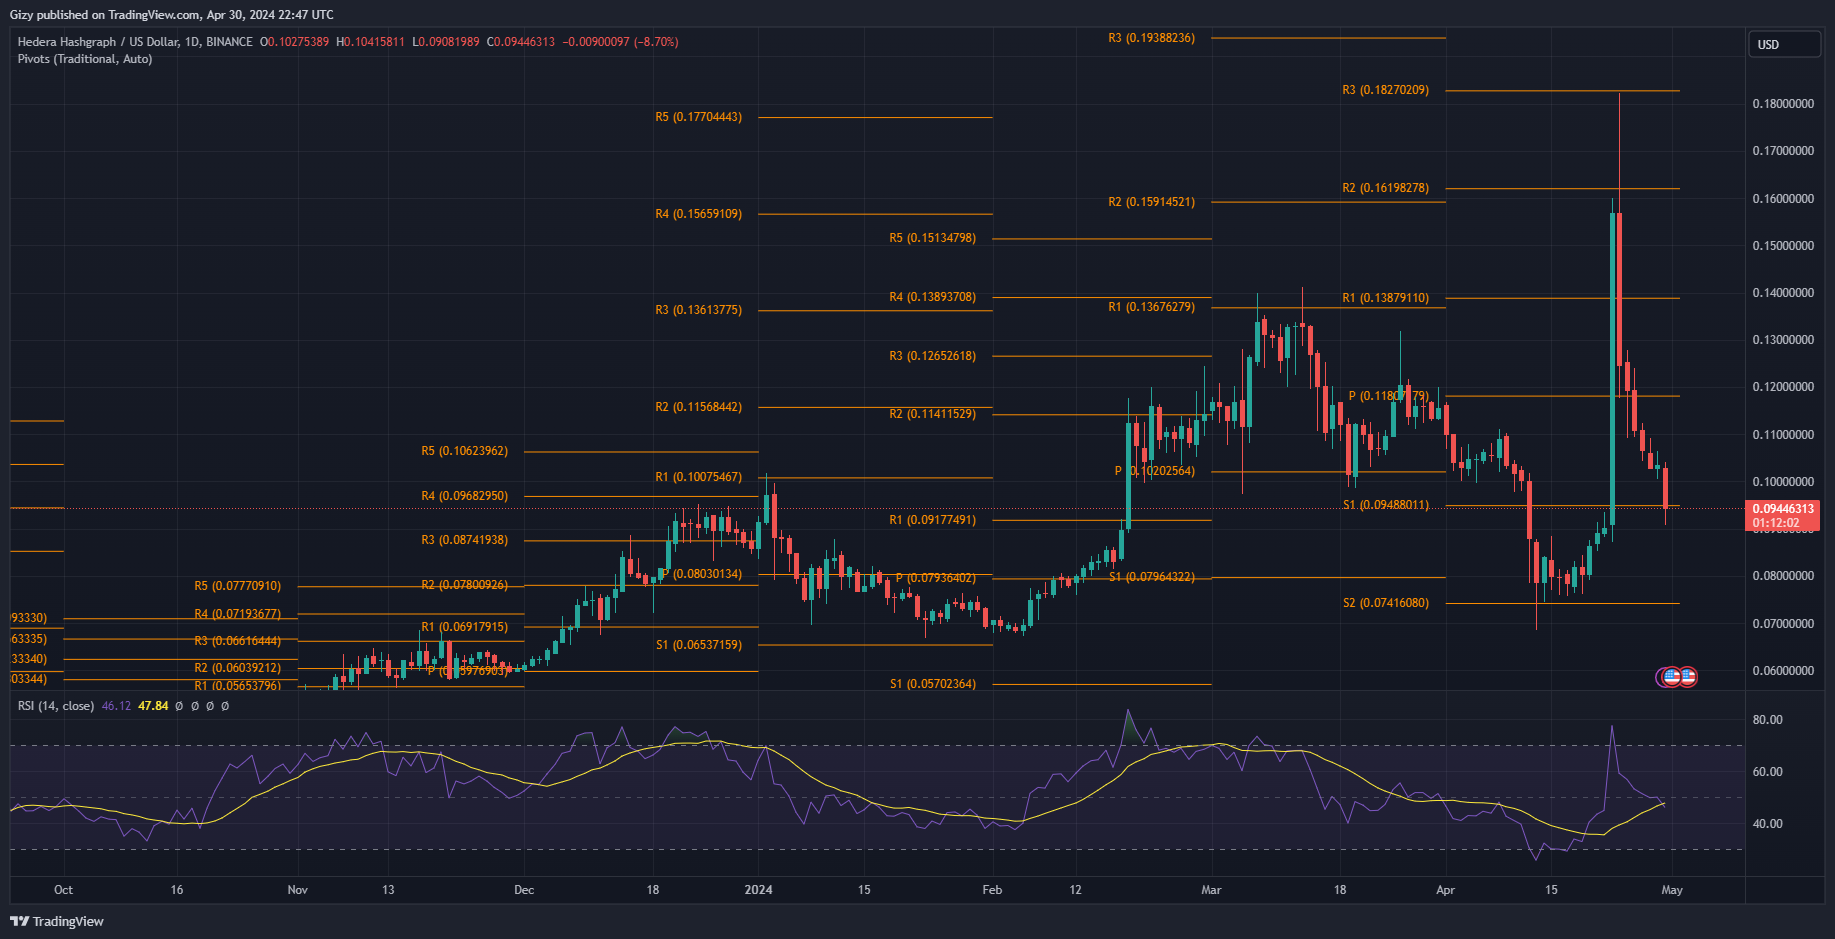
    During the previous week, Hedera displayed a lot of volatility. This came as it enjoyed a massive push from fundamentals. Rumors of the asset getting a new use case with BlackRock made waves. According to the reports, the asset managers were going to use the project to tokenize some real-world assets.

    In response, it surged by over 73% in 24 hours. The firm refuted the claim the next day, and HBAR retracted it following the announcement.

    It showed minor signs of recovery during the previous intraday session but failed to hold the uptick as prices retraced. It has not made any positive moves since the current session started, as it is seeing one of its most significant declines.

    It is currently down by over 9%, exchanging below its first pivot support at $0.94. The relative strength index suggests room for further decline as it is at 45, giving the bears an advantage. If the downtrend continues, the token will return to its previous low at $0.074.

    Nonetheless, the bulls will attempt recovery. If the market trajectory changes, they may push for a retest of $0.11 in the coming day.

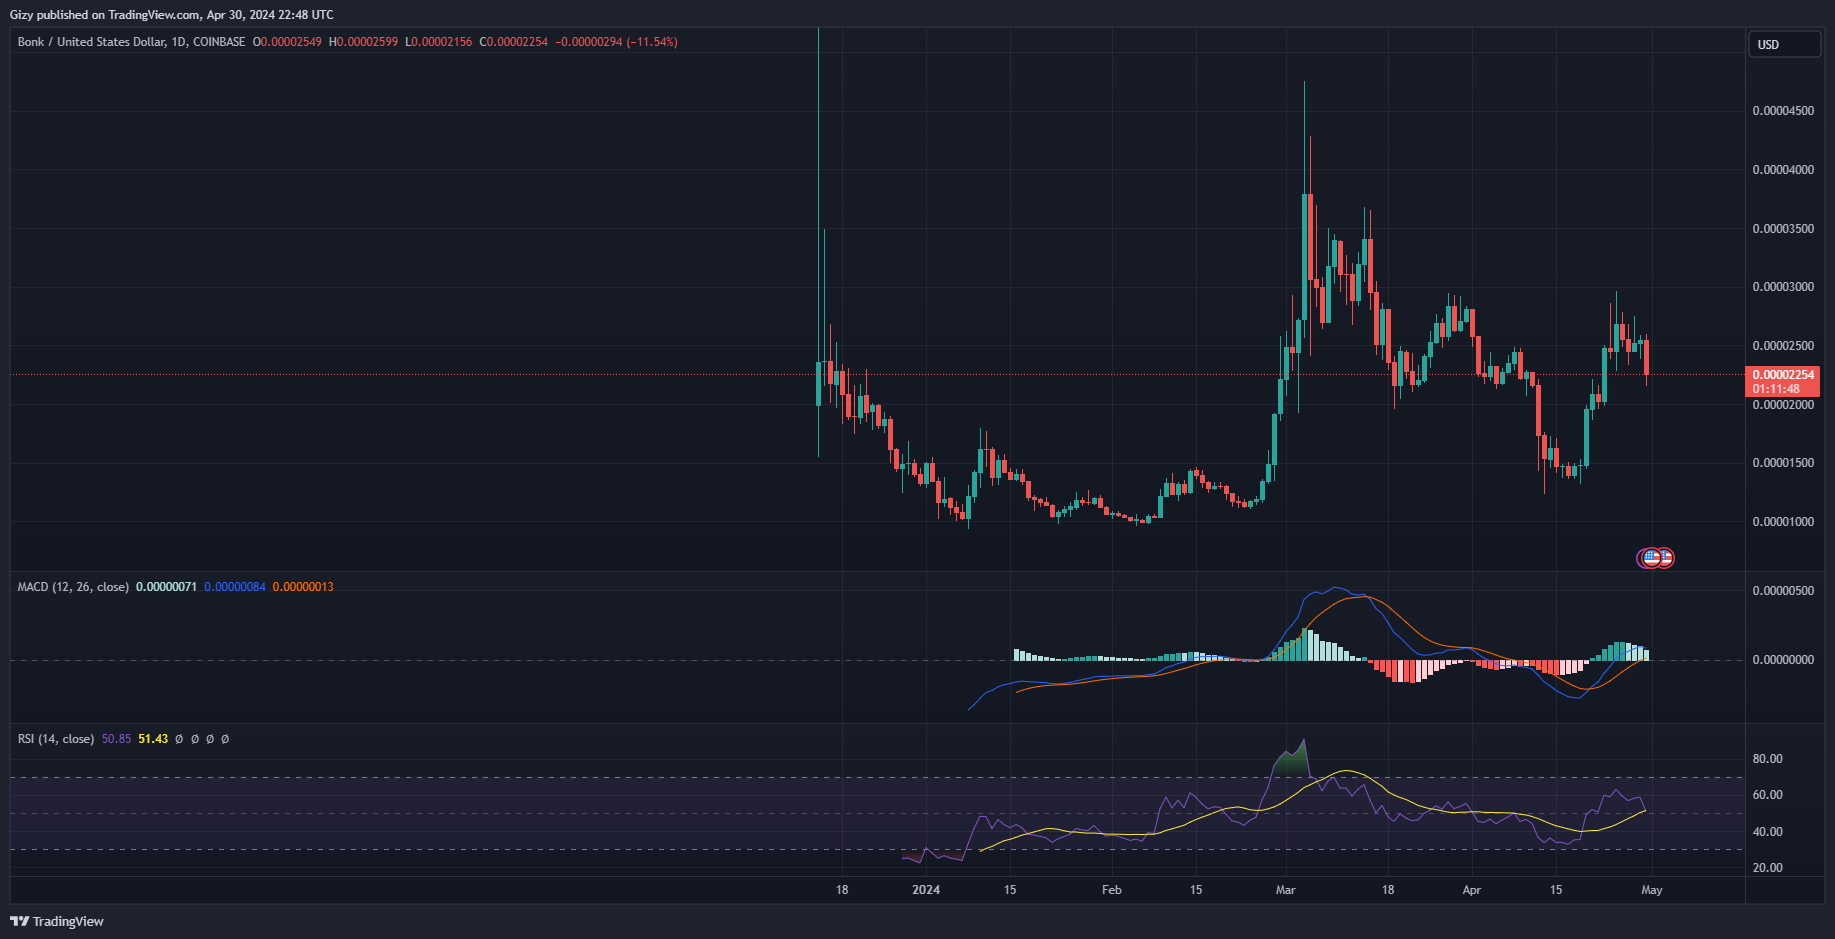
    5. Bonk (BONK)

    Bonk is currently on the decline and shows no signs of recovery. The bulls attempted a buyback during the previous intraday session, as the coin retraced to a low of $0.000023 but closed at its opening price.

    Currently down by over 11%, the token rebounded from a low of $0.000021. A closer look at the moving average convergence divergence suggests a continuation of the downtrend. The 12-day EMA is heading downhill and will intercept the 26-day EMA in bearish convergence

    Nonetheless, the coin is trading above the 50-day EMA, which means it is still maintaining its bullish posture. This could spell out a possible recovery for the asset. It will return and look to climb above $0.000025.