
BTC remained stuck below $58k over the last 48 hours. After testing, it faced significant rejections, resulting in the latest trend.
The crypto market registered a significant change in trading volume during the previous intraday session as funds pumped in. Some estimate the increase to be over 30%. However, it gradually lost its spark as volume was down by over 9%. Nonetheless, the global cryptocurrency market cap is above $2 trillion.
Optimism also returned to the market, as renowned wealth management firm Bernstein views the upcoming U.S. presidential election as a critical factor influencing Bitcoin’s price movements before the end of the year.
Donald Trump and Kamal Harris are currently debating many topics. Crypto may be the frontrunner among them, and their comments may affect prices in the coming hours. Nonetheless, traders are still skeptical about the ongoing price trajectory.
Will the crypto market continue its uptrend or resume its downhill movement?
Top Five Cryptocurrencies to Watch
BTC/USD
Bitcoin is off to a good start with its significant push during the previous intraday session. It started trading at $54,876 but surged, flipping $56k with eyes on $58k. However, it failed to flip the mark and retraced as a result decisively. Nonetheless, it ended the day with gains exceeding 4%.
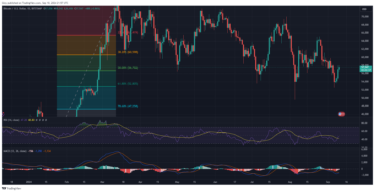
On-chain data shows that it experienced a massive hike in trading volume during that period, which resulted in the price increase.
Trading volume is currently dwindling as traders are returning to the previous sentiment. It is down by over 18% in the last 24 hours. Bitcoin is seeing small increases amidst the ongoing trend. It attempted $58k a few hours ago after a failed trial yesterday.
It is worth noting that the apex coin is yet to climb above its pivot point after more than two attempts in the last 48 hours. Nonetheless, indicators point to an impending flip in the coming days.
One such is the moving average convergence divergence. If trading conditions improve, the 12-day EMA is on the uptrend and will intercept the 26-day EMA in the next 48 hours. Although the RSI saw tiny movement in the last 24 hours, its small hike shows buying pressure that may fuel a bid above $58k.
ETH/USD
Ethereum chart shows that the asset has been on the uptrend over the last three days. It printed its most giant candle during the previous intraday session, attempting $2,400 following a slight scare that the decline may resume. It peaked at $2,385 as selling congestion mounted. Nonetheless, it registered gains of almost 3%.
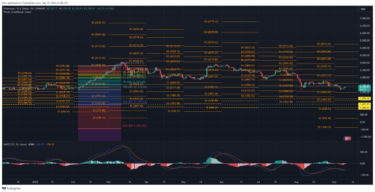
At the time of writing, it has yet to register notable price changes. The altcoin resumed its attempts at $2,400 and edged closer a few hours ago. It peaked at $2,395 but is seeing a minor correction as trading continues at $2,381.
The asset is missing the spark from the previous day. In the last intraday session, it had an over 50% increase in trading volume, with a bulk coming from bullish activities. The reverse is the case, as ETH volume dropped by over 9%.
Nonetheless, indicators hint at a possible flip of the $2,400 resistance. The moving average convergence divergence is printing a positive signal. If trading conditions improve, the 12-day EMA is on the uptrend and will intercept the 26-day EMA in the next 24 hours. Although the RSI saw tiny movement in the last 24 hours, its small hike shows buying pressure.
Ethereum will look to edge close to its pivot point at $2,600 after breaking above the highlighted mark.
ICP/USD
Internet computer is seeing one of its most significant surges in the last three months. It started trading at $7.78 and surged, breaking its fourteen-day high at $8.73. It continued upwards and broke the $9 resistance. The asset is edging closer to its first pivot resistance at $9.12 and may flip it in the next few hours if trading conditions remain the same.
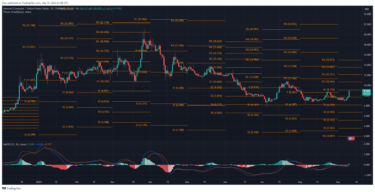
The asset is seeing a more than 112% increase in trading volume. The main reason for the latest surge is unknown. However, the derivatives market points to a rise in open interest that may be positively reflected in prices. Currently up by over 15%, ICP leads the crypto top gainers in the last 24 hours.
The altcoin continued the previous day’s surge, which saw it gain over 4%. It remains to be seen if the four-day EMA will end this week. Nonetheless, indicators are hinting at a continuation. For example, MACD displayed a bullish divergence a few days ago due to the uptrend.
The relative strength index shows the asset could surge more as the metric sits around 64. The latest reading comes in response to the ongoing uptrend. The altcoin may attempt $10 this week.
However, following the sharp rise, price movement suggests an impending correction. In previous times, ICP saw a notable decline after RSI hit 67; the same may happen this week. Prices may drop as low as $8.
AR/USD
Arweave has been in a downtrend over the last two weeks. The one-day chart suggests that it is yet to recover from this trajectory. As a result, it lost over 3% last week. However, the close, although negative, could hint at the end of the declines.
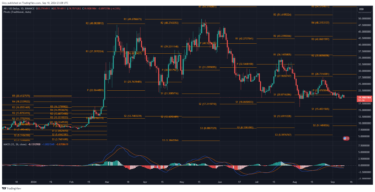
Traders believed this would happen as the token registered notable increases during the previous intraday session. It started trading at $20 but surged to $21 after a brief dip to $19.8. The day ended with gains exceeding 3%.
The altcoin has shed off its small gains as it resumes the downtrend. It started trading at $20.8 but is exchanging at $19.8, indicating a more than 4% drop. In addition to ending the two-day surge, the asset has erased its accumulated gains.
Indicators were looking positive during the previous day, as MACD’s 12-day EMA showed signs of halting its downhill movement. RSI also saw a small hike as buying pressure improved. However, the metrics have resumed their previous trajectory.
Price movements suggest that the decline may end soon. If that happens, AR may resume its uptrend. It will look to break its seven-day high at $22. It may trade above this mark for an extended period until a push towards $25.
Nonetheless, a new trend is unfolding. Arweave held prices above $19.7 over the last thirty days. The trend may continue this week until a breakout to retest supports. It may break the $19 support barrier, sinking as low as retesting the $17.
