XRP was at the center of the biggest fundamental this month. Following Ripple’s partial victory against the United States Security and Exchange Commission (SEC), the asset attained levels it hasn’t in more than two months. As a result, it is closing one of its most bullish months with huge increases.
However, a closer look at the top 100 suggests that not all assets in the crypto market are closing positive changes in value. For example, FTM is currently down by 22%. It hit its lowest of the month five days ago when dipped to a low of $0.22. Nonetheless, it saw a high of $0.31.
Another top loser over the last thirty days is Curve Dao. It kicked off the period under consideration at $o.76 and enjoyed notable increases. As a result, it surged to a high of $0.87. However, following its peak, the cryptocurrency started a downtrend that saw it dip to a low of $0.53. At the time of writing, It is trading at $0.55 which is 27% lower than it opening price.
While many may fault the losses on other factors, it is important to bear in mind that the crypto market was not as lively the previous month. A look at the fear and greed index offers a brief insight into the general sentiment over the last 30 days. It’s worth noting that the metric picked at 64. During this period, the sector under consideration saw significant increases. However, readings were mostly below 60 which showed that the market wasn’t fully bullish or bearish.
This also affected the global cryptocurrency market cap. It kicked off July at $1.19 trillion and surged to a high of $1.25 trillion. At the time of writing, it is worth 1.17 trillion which indicates that it’s lost a small amount of its value over the last 30 days. Nonetheless, XRP defied the general sentiment.
XRP Sees Best Performance of 2023
XRP kicked off July at $0.47. Like most assets in the crypto market, it was largely inactive throughout the first 5 days of the month. However, on the 6th day, it saw considerable decreases in price. As a result, it’s close to the second week of the month with more than 5% decrease.
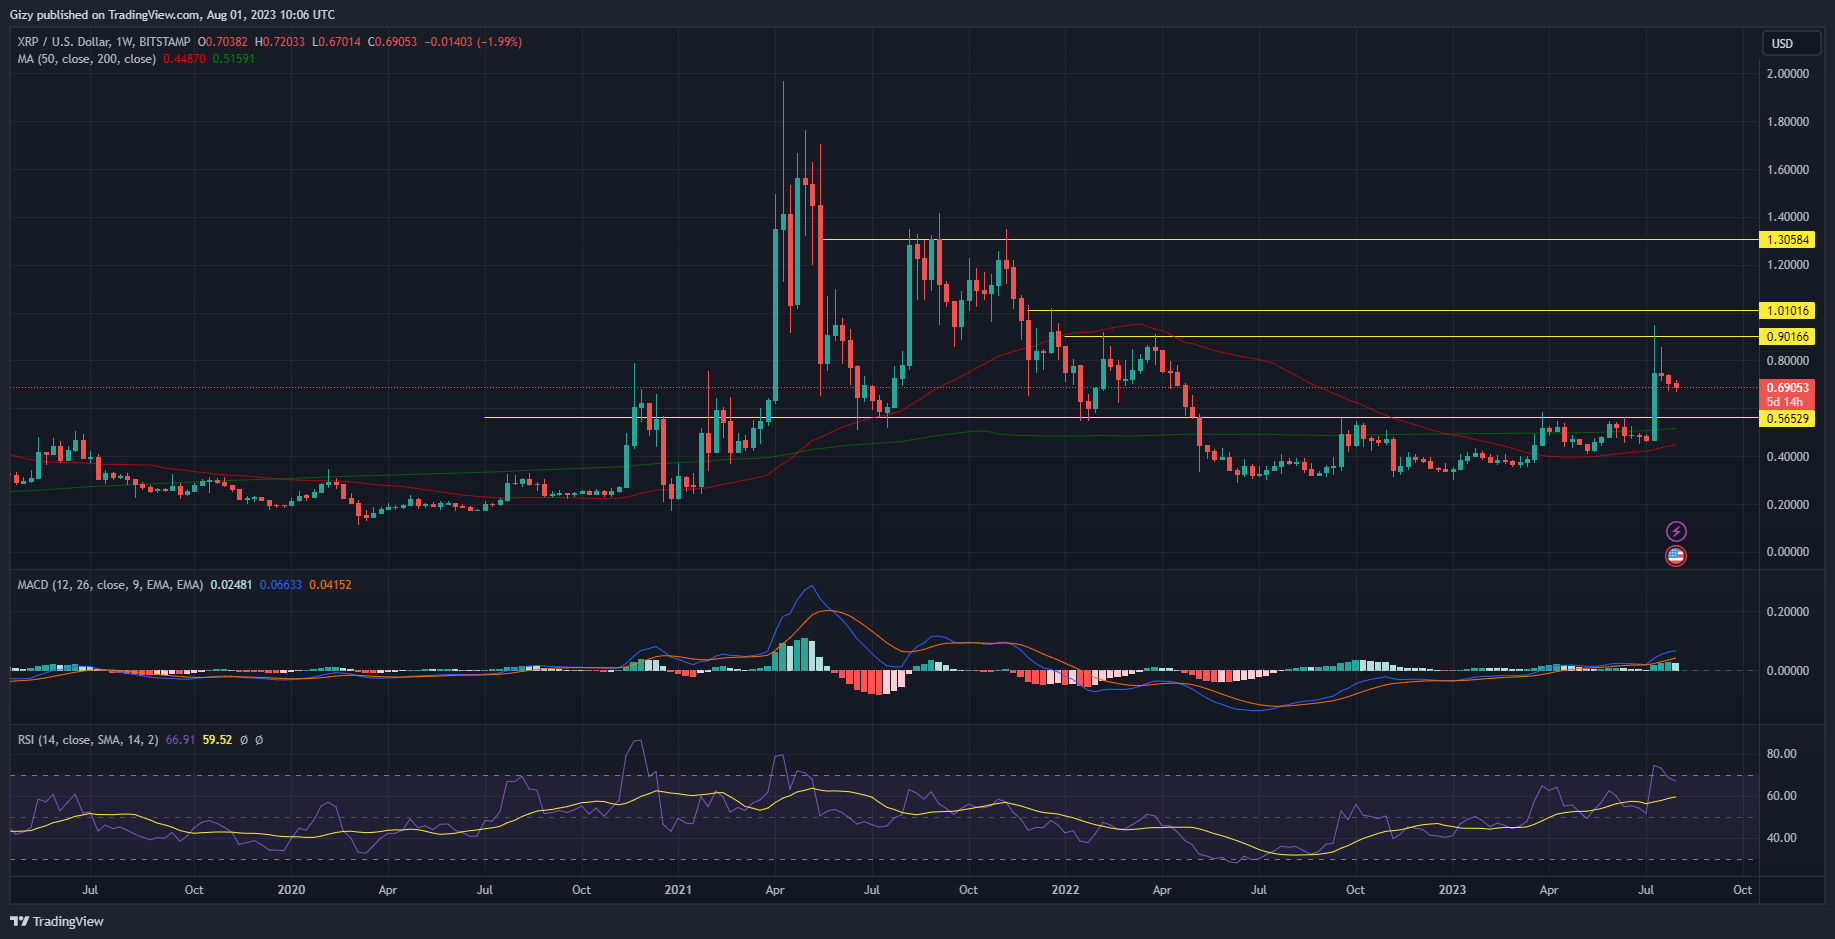
The third week was the most bullish as their assets registered the most games for the year. It kicked off trading at 0.46 and attained a new high as a result of a positive fundamental at this time. Due to this, the coin enjoyed a massive incline and buying volume. In response, prices climbed as high as 0.94. However, it retraced and ended the intra-week section at 0.74.
XRP registered gains of more than 50%. Following this massive increase, the assets did not see any big push at resistance anymore. The last two weeks of July saw the assets dip to a low of 0.67 and lost more than 5%. Nonetheless, at the current price, it is up by more than 45% on the monthly scale.
Many may wonder if the increase will continue. Indicators on the weekly chart, and explain mixed readings. For example, the moving average convergence-divergence maintained its uptrend during the last two weeks of the month. On the other hand, the relative strength index declined in response to the increase in selling volume. At the time of writing, it is at 66.
While many may find it hard to come to a conclusion as to how prices will react in the coming days, it is important to note that the moving averages are bullish at this time. The 50-week moving average is arched upward and may intercept the 200-week leading to a Golden Cross. This may be perceived as an indication of a greater increase in price
Stellar Lumen Broke Above $0.14
Stellar Lumen was mostly bullish throughout July. Although like XRP, it had a bad start to the month. As a result, in its second week, it opened trading at 0.10 but dipped to a low of 0.094. It tried reclaiming the 0.10 support it failed as it ended the intraweek session at 0.099. This is just one indication that is lost more than 7%.
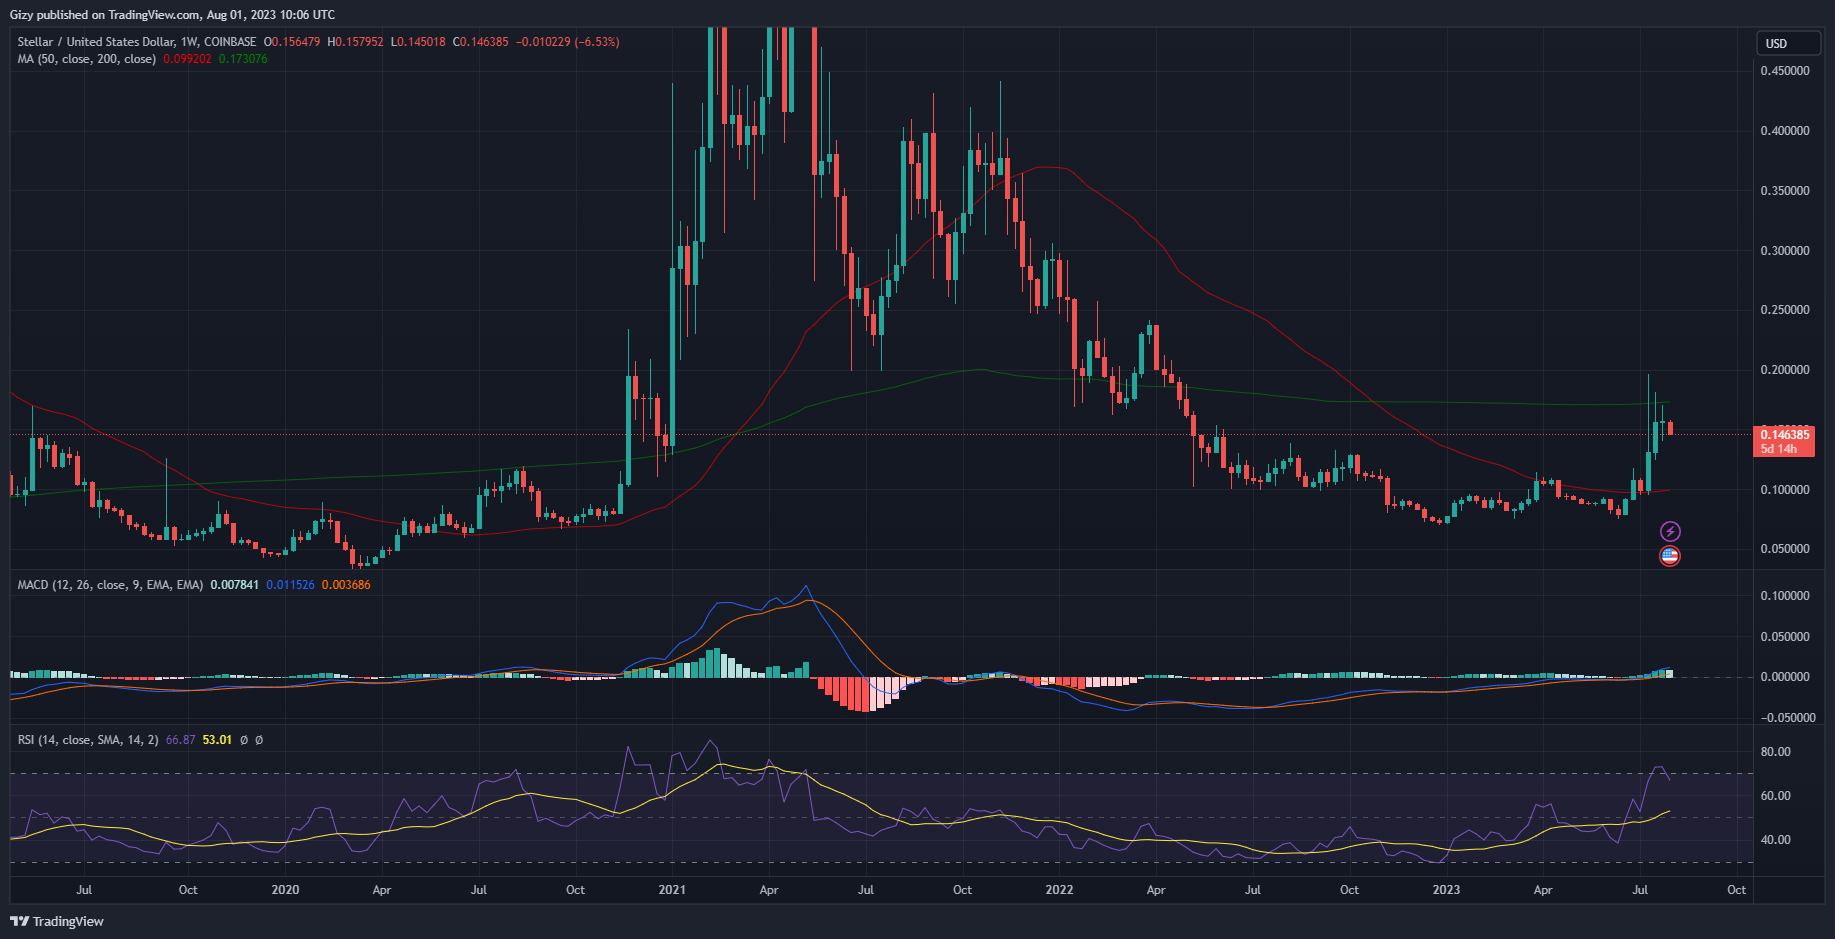
However, this changed in the third week. Following its open, XLM day to a low of 0.095. It rebounded and made an attempt at the $0.20 resistance. It failed in its bid, as it saw a strong rejection at 0.19. As a result, it dropped to a close at 0.13. Nonetheless, this signifies a more than 32% increase.
The bullish actions continued in the 4th week. This time the coin lost its momentum at 0.18 and dropped to a close at 0.15. In the end, it registered gains of more than 18%. Over the previous seven days, it made another attempt at resistance but failed and returned to its opening price as we notice doji representing trading action.
It is worth noting that XLM is currently overbought. The relative strength index currently stands at 72 which is an indication of an impending downtrend. This may affect the coin’s performance next month. If this happens, it may lose its 0.14 support and dip as low as 0.10.
On the other hand, the 50-week moving average is currently bullish. This may be an indication of more price increases ahead. This may open the way to another test of the 0.20 resistance. Will it break?
