Bitcoin is currently grappling with notable selling pressure at the time of writing. It recently surged to a high of $109,503 after rebounding a few hours ago.
The coin currently prints a doji as the asset is back to its opening price. Although the latest price action may appear unimpressive, it reflects a significant shift from Friday. The bulls are gradually edging as the bears are exhausted.
Nonetheless, the past 30 days have delivered intense action across the Bitcoin market, with investors and institutions fueling activity on multiple fronts. Wallets that once appeared dormant came alive, while major players continued accumulating the apex cryptocurrency. These moves reflect the market’s shifting tone after a historic rally earlier in the year.
A key development occurred when Satsuma Technology concluded its oversubscribed funding round, raising $217 million on August 6 to bolster its Bitcoin treasury. The funding attracted major investors like ParaFi, Pantera, DCG, and Kraken, highlighting Satsuma’s growing role as companies increasingly adopt Bitcoin in their financial strategies.
Additionally, another company continued its acquisition strategy, investing $51 million in Bitcoin during market corrections, albeit at lower volumes than in the past. Despite this, accumulation persisted through August, with HODL15Capital reporting that public treasury companies collectively added 4,330 BTC, showcasing ongoing institutional interest.
In addition to direct purchases, investors increasingly sought Bitcoin-linked financial products. Early in the month, US spot ETFs spotted robust inflows, yet this enthusiasm was short-lived. For the first time in four months, the sector recorded a negative net flow, culminating in August with total flows at $751 million, indicating waning momentum following a prolonged investment phase.
Bitcoin Hits a New Milestone
The price dynamics mirrored this mixed sentiment. On August 1, Bitcoin surged over 10%, setting the stage for a rally that resulted in a new all-time high. On August 14, the cryptocurrency reached $124,517, surpassing July’s high by $1,281. However, this peak was quickly followed by a significant retracement, as the asset lost over 4% shortly after.
Weekly charts clearly illustrate a shift in direction following this peak. The coin fell nearly 2% during the week of August 11 and then dropped another 3% in the subsequent week. A brief rebound created false optimism when Bitcoin dipped to $110,671 from $117,465 before closing at $113,478.
The final week of August proved even more bearish. Bitcoin dipped below $110,000 for the first time in nearly two months, reaching a low of $107,389 before recovering slightly. Overall, Bitcoin closed the month down nearly 6%, marking its first decline since April. The performance has prompted traders to consider potential market changes as September begins.
Considering these developments, analysts now witness two contrasting narratives. Some suggest that Bitcoin may have room for another upward movement in September, pointing to the US Federal Reserve’s recent inclination toward interest rate cuts as a potential supportive factor.
Historically, looser monetary conditions have benefited risk assets, suggesting that Bitcoin could capitalize on this dynamic in the short term.
Conversely, historical trends warrant a note of caution. September marks Bitcoin’s most notably bearish month on record, with the asset typically losing more than 5% on average during this period, making it the steepest seasonal decline of the year.
Data spanning the last 15 years reveals that nine Septembers have closed negatively, with the sharpest decline occurring in 2011, when Bitcoin plummeted by over 44%. The following year was a stark contrast, with a rise of over 13%. This historical backdrop injects uncertainty into the current outlook.
Technical Indicators Signal Deeper Declines
Technical analysis adds another layer of concern. Weekly assessments reveal Bitcoin trending lower after a long-anticipated correction, with several indicators suggesting additional downward pressure.
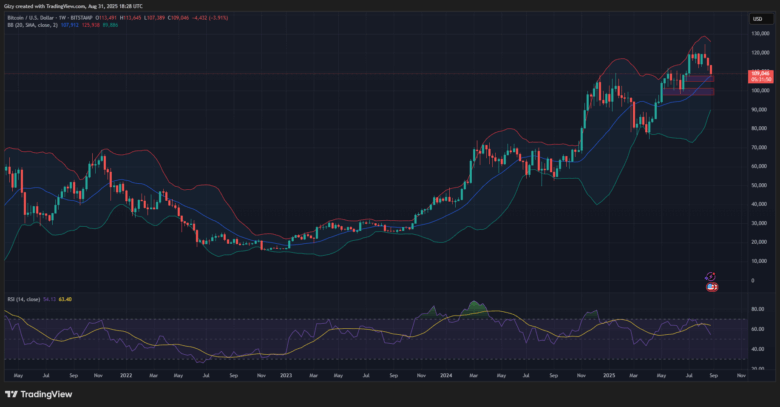
First, the Bollinger Bands highlight key risks. On July 11, Bitcoin tested the upper band before falling to a fresh monthly low within weeks. Historically, this formation often precedes movement toward the lower band, which could position Bitcoin closer to the $90,000 mark.
Second, relative strength readings indicate potential weakness. Bitcoin entered overbought territory during the first week of July. Although subsequent corrections have brought RSI readings back to neutral, the indicator has not achieved levels typically associated with sustainable rebounds.
Past cycles show Bitcoin often experiences losses exceeding 25% after entering the overbought phase. The current 10% decline suggests further downside may be expected.
If these trends continue, Bitcoin could see a further drop of around 15%, potentially pushing prices below the symbolic $100,000 mark. Technical projections support this possibility, with Bollinger Bands indicating a lower boundary near $90,000. While such a decline wouldn’t signal the end of a long-term bullish cycle, it would highlight the ongoing volatility defining the cryptocurrency market.
Overall, August delivered a blend of milestones and warnings for Bitcoin. Institutional players continued to add to their reserves, while ETFs faced their first setback in months, highlighting both the growth potential and inevitable corrections in price fluctuations.
As September unfolds, traders find themselves at a pivotal juncture shaped by supportive macroeconomic factors on one side and historically bearish trends on the other.
The question remains whether Bitcoin will break below $100,000 or find renewed strength. The weeks ahead will reveal how these opposing forces balance, ultimately determining the market’s trajectory amid the ongoing battle between bullish optimism and bearish realities.
Bitcoin Shapes Up For Rebound
Bitcoin is poised for further gains after halting its decline over the weekend. It is worth noting that it rebounded off the bollinger’s lower band a few days ago. Based on this metric, the apex coin may be gearing up for further increases.
Previous price movements suggest that the apex coin may surge, reclaiming $112k. It may continue upward, breaking $116k if the bulls sustain the uptrend.
Find Cryptocurrencies to Watch and Read Crypto News on the Go Follow CryptosToWatch on X (Twitter) Now
