The cryptocurrencies to watch this week were some of the most stable during the previous week. A closer at their weekly performance revealed that they saw little volatility. This mirrored the trend of major crypto assets.
The market capitalization of all cryptocurrencies was $1.12 trillion at the beginning of the previous week. Prior to two weeks ago, the market underwent a slow decline in value that caused it to briefly fall below $1.1T but end up closing above.
The sector’s failure to post gains and keep onto them continued during the previous intraweek session. As a result, it reached its peak of $1.15 trillion before declining to a low of $1.10 trillion and closing at nearly its opening price. The chart revealed that price movements were characterized by highs and lows.
The leading gainers at the moment were altcoins. This included RNDR. Over the past seven days, the asset has increased by more than 40%.
One of the key levels that it flipped during its climb was the $2.5 resistance. We saw multiple attempts at the mark over the time frame under consideration before it gave way on Sunday.
PEPE was among the largest losers during the past week. Despite the fact that its losses were not substantial, it lost more than 4%. Its position has decreased to 68 as a result of a decline in the market capitalization of all cryptocurrencies.
Because they didn’t have much of an impact on pricing, market fundamentals were basically nonexistent.
As the week’s second day begins, nothing has changed. However, the charts provide information about potential price behavior.
Top Three Cryptocurrencies to Watch
1. Bitcoin (BTC)
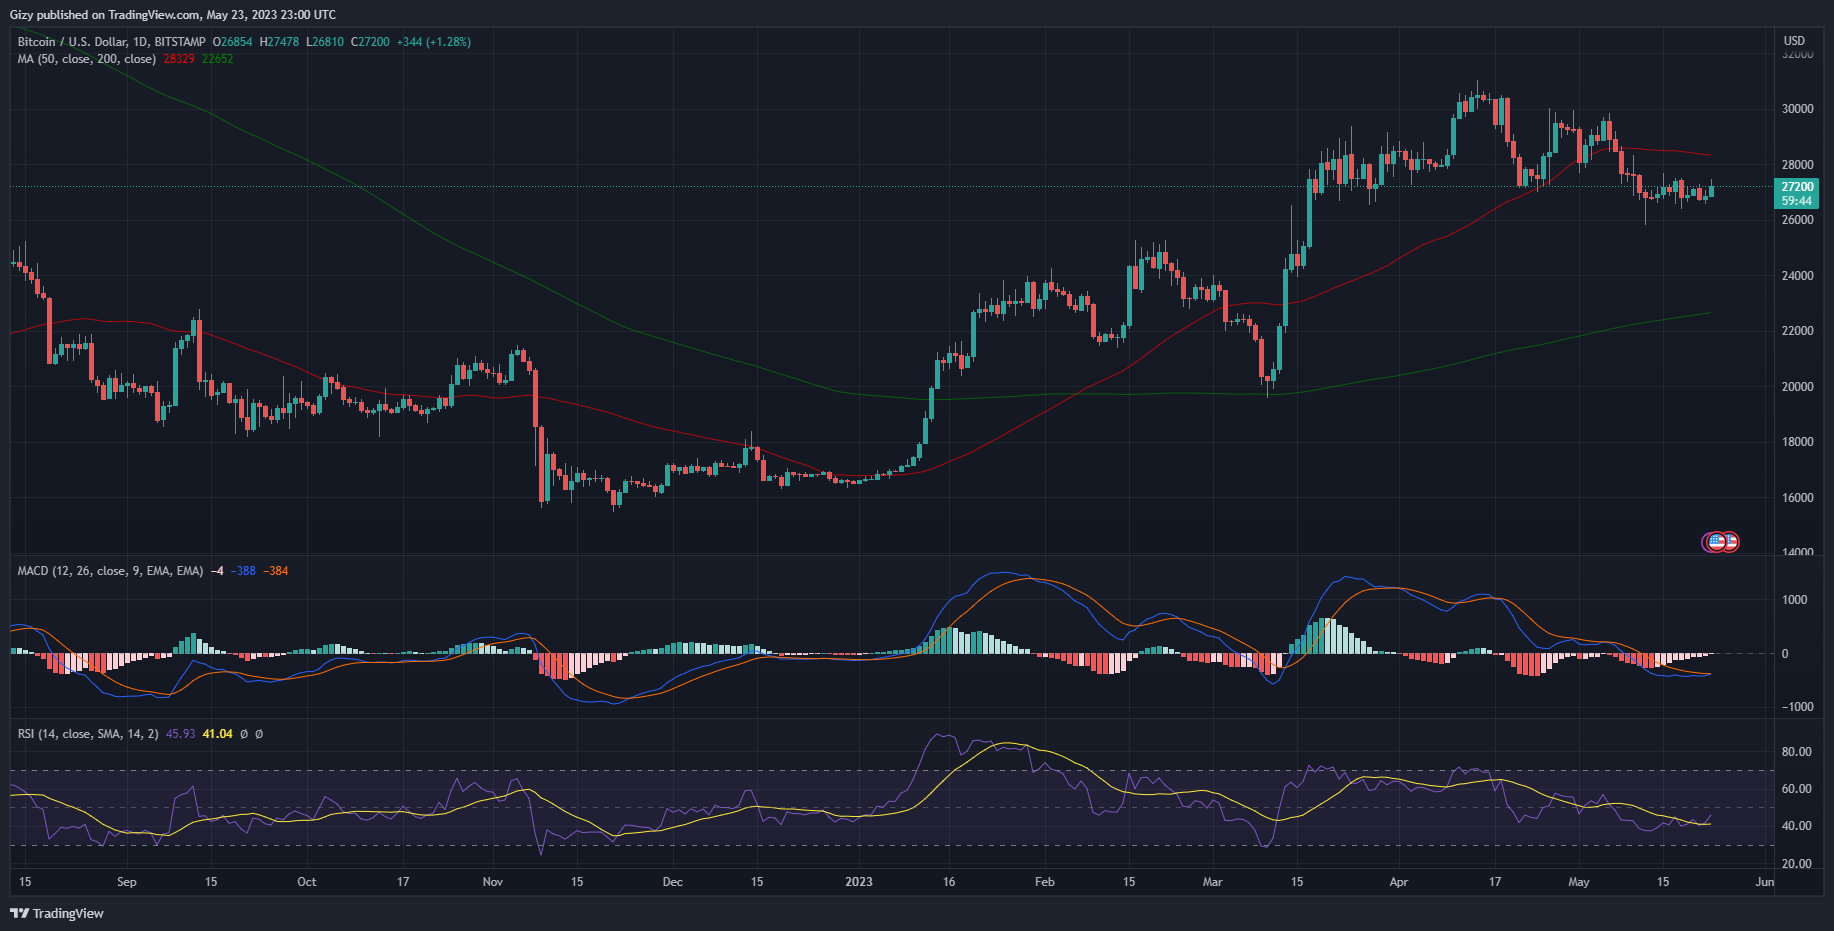
The previous week, the price of bitcoin was comparatively constant. It was unable to leave the trading channel it was in. when a result, its worth barely changed when it closed. We noticed a doji on the weekly chart, which shows that the asset peaked before dropping to a low.

One of the key moments on Tuesday was when it began at $26,933 and rose as high as $27,666. Despite the fact that there was no discernible price gain for the top asset at the end of the intraday session, this gave many people hope that future price increases were inevitable because Monday was also a good day.
This never happened, as BTC experienced its greatest loss on Thursday. Trading started at $27,413 and dropped to $26,374 before rising once more. Despite recovering, it ended up losing roughly 3%. Nevertheless, the top currency hit a new low for the week.
Over the course of the next three days, the coin’s price barely altered. However, many people would perceive the little greens on the chart as a sign of impending price improvement.
Examining the indications further demonstrates this point.
Although the measurements have not changed significantly, they have gradually become bullish. For example, MACD shows that BTC is going through a bullish convergence. The Relative Strength Index also stayed the same at 40.
A better price performance for the current intraweek session is predicted by indicators. For instance, the 12-day and 26-day EMAs have been deviated, according to the Moving Average Convergence Divergence. When a bullish divergence is going to take place, prices may react favorably.
The $28k resistance is one of the important levels to keep an eye on over the next five days. While getting closer to the target, the apex coin was unable to retest it. Due to the most recent prospects, it might try the specified level.
2. Ethereum (ETH)
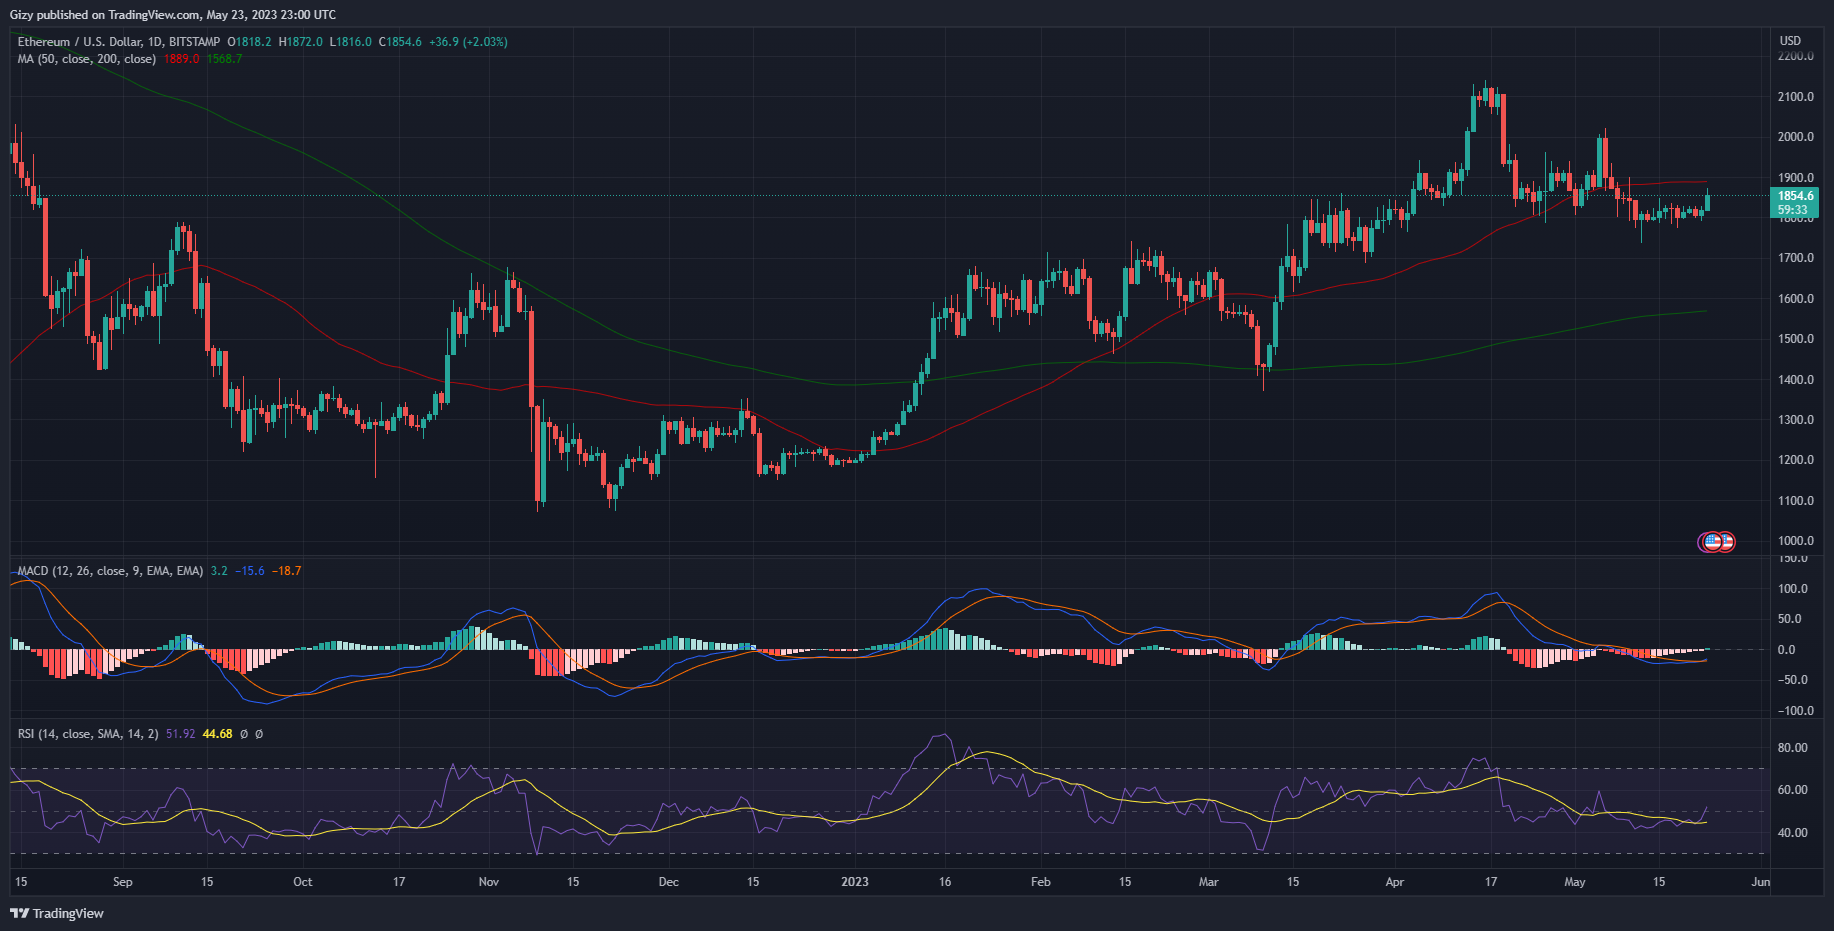
Ethereum had the same movement the previously highlighted asset. Like most cryptocurrencies to watch this week, it had very little volatility during the previous week. As a result, trading activity during that period was represented by a doji. This is also an indication that it retested key levels.

The first highlight of the week was on Monday. The altcoin kicked off trading at $1,800 and slowly edged toward $1,900. However, it halted the advance at $1,847 but registered gains of more than 2% in the end.
On Thursday, a complete reverse of what took place. ETH had its biggest dip as it kicked off trading at $1,822 but flipped a key level as the day progressed. It flipped the $1,800 support and dropped to a low of $1,777. It recovered but closed at the highlighted mark which signified a less than 2% decrease.
Over the last two days of the week, the largest altcoin was relatively bullish as it registered two green candles. It also affected indicators such as the Moving Average Convergence Divergence is showing huge positive signs. it displayed a bullish convergence which may also spell out more price improvements for the asset.
The previous intraday session is an indication of the statement above. Although not significant, it was a green. The current 24-hour cycle is also positive as ETH is up by almost 2%. Nonetheless, it peaked at $1,872 and is retracing as a result MACD is showing signs of further price increases.
It displayed a bullish divergence. Following this reading, ETH may see further attempts at $1,900.
Find Cryptocurrencies to Watch and Read Crypto News on the Go Follow CryptosToWatch on X (Twitter) Now

