

Most cryptocurrencies to watch this week experienced massive downtrends during the previous intraweek session. They had a massive decline in value. We also see a significant decline in value in the global cryptocurrency market cap as a result of this.
At the start of the session, it was valued at $1.02 trillion. Yet, its value drastically decreased during the course of the following seven days. It fell to a low of $914 billion, but then started to rise again, closing at $985 billion, representing an almost 5% decline in value.
A look at the market cap showed that the small recovery took place during the weekends. It also creates a pattern for future price hikes. This is what is happening right now as most cryptocurrencies are experiencing one of their largest rises.
Nonetheless, it is worth noting that fundamentals played a huge role in the previous week’s downtrend. News of Silicon Valley Bank shutting down had most traditional instruments in panic. We are seeing a repeat of the event as we noticed another massive reaction to prices.
This time, it’s positive. The rally across the market was buoyed by the Feds forecasting a decrease in interest rates. The release of CPI report also played an important role in the current rise of most crypto assets. Let’s see how some cryptocurrencies may perform this week
Top Five Cryptocurrencies to Watch
1. Bitcoin (BTC)
During the recent intraweek session, Bitcoin had several important levels challenged again. It started the week at $22k but fell as low as $19k by the end. Prices were also impacted by this, as evidenced by the strong negative indications on the indicators.
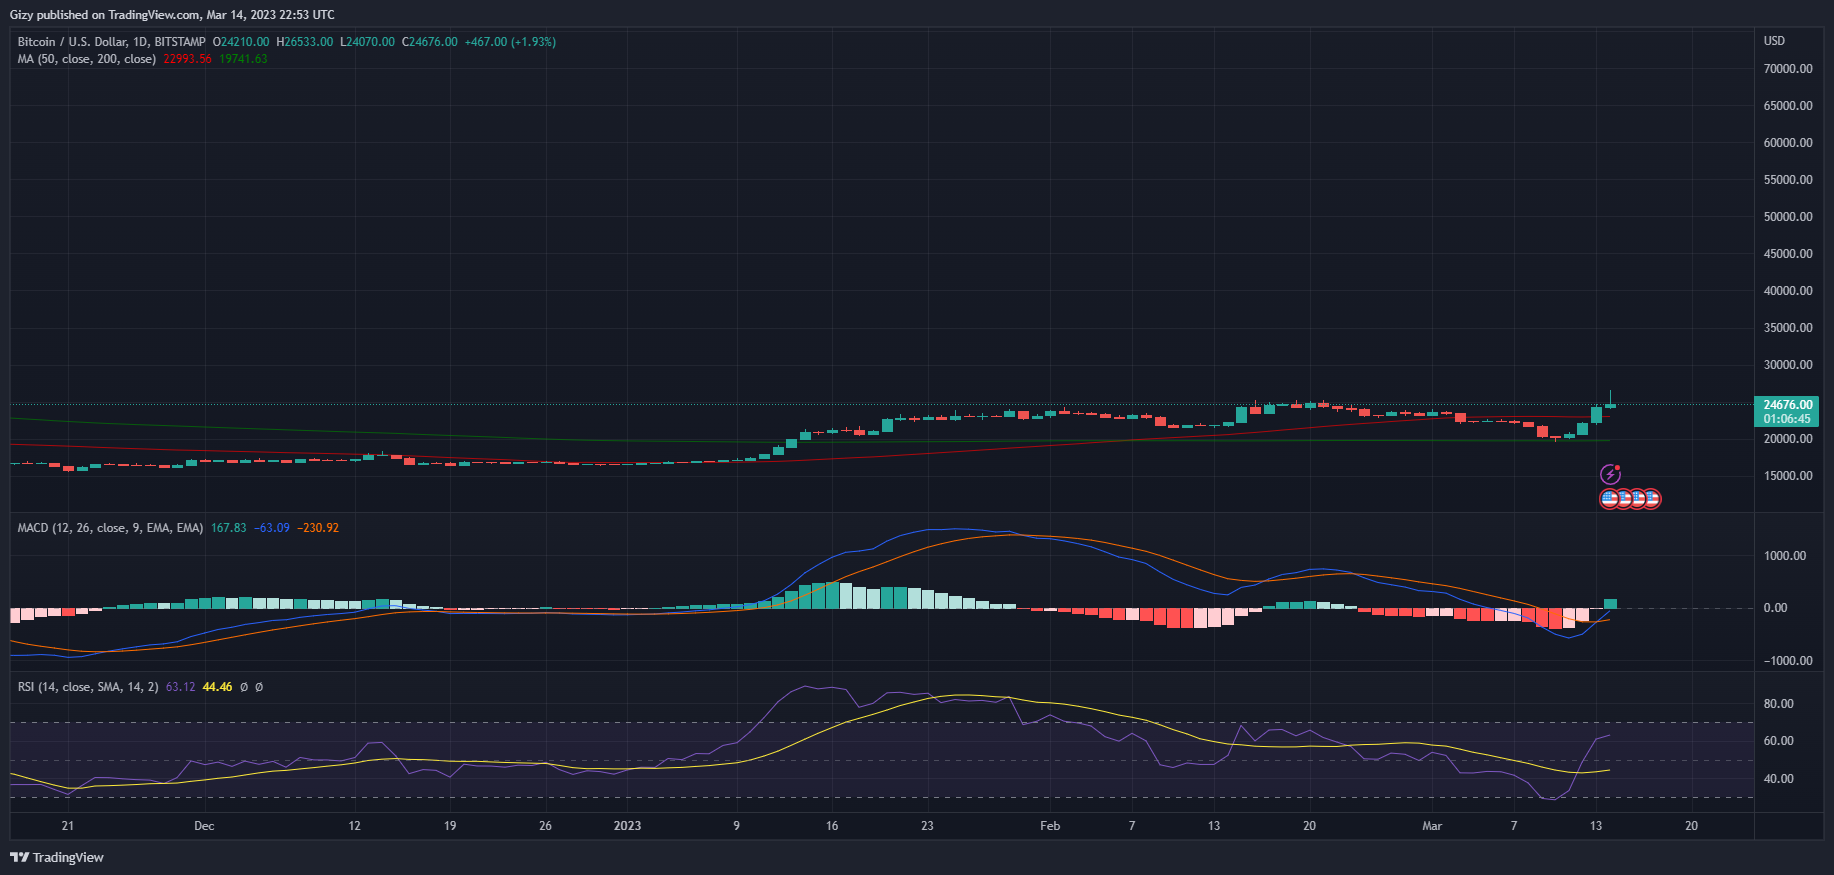
The Relative Strength Index, for instance, temporarily fell below 30 at the height of the bearish dominance. Since it fell below 0, the Moving Average Convergence Divergence was also impacted. In addition, we saw that the 200-day MA had curved and might be beginning a downturn.
While all of these indications indicated that the top asset will continue to trend downward, fundamentals are at odds with this prediction. We noticed a rise in buying activity after many encouraging news stories as the price of bitcoin reached its highest level in more than eight months.
As a result, the MACD and RSI both appear more favorable. For instance, both metrics are showing signs of further price increases after leaving their respective danger zones and becoming healthy. It is important to note that the highlighted MA is not changing.
The bullish indicators are contradicted by the candlestick pattern, which suggests the contrary. An uptrend’s end is only indicated by the inverted hammer pattern. If this proceeds, BTC might once again have trouble maintaining important supports. Its peak and current prices are a blatant proof of this.
The peak price of the pinnacle coin reached $26,400. It is currently below the $25k threshold at $24,700. Yet, we may anticipate that the impact of the optimistic fundamentals will persist. In this scenario, we anticipate a $27,000 attempt.
2. Binance Coin (BNB)
Over the past eight days, there have been several changes in attitude related to Binance coin values. While some were unconcerned, many said it was one of its worst performances. However, the asset’s extreme volatility is one of the things that makes it one of the best cryptocurrencies to follow.
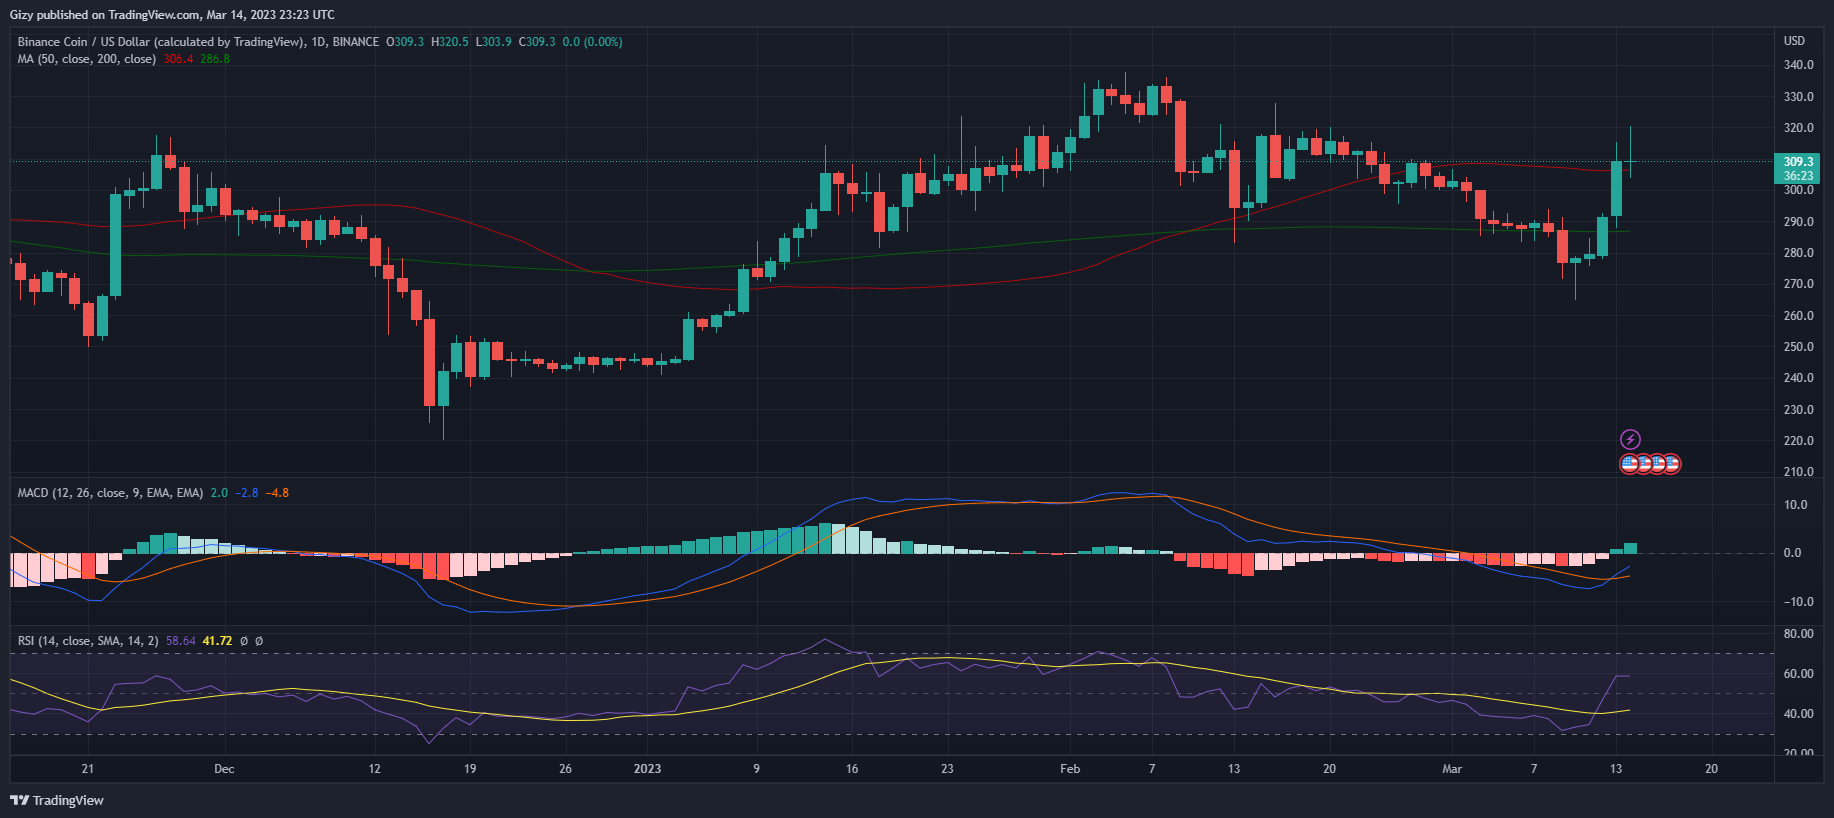
It began trading the prior week at $288 but fell as low as $271. It experienced extremely bearish readings on its indicators, just like the assets that were previously highlighted. For instance, the RSI sank as low as 21, and the MACD also experienced movement. But as the session came to a close, these readings shifted.
The coin experienced its highest week-long increase on Sunday. It increased by more than 4%, which also affected the indicators that were emphasized. Although the RSI was in an upswing, we saw an abrupt change in its trajectory. Also, the MACD showed a bullish convergence.
A divergence occurred as a result of trading activity in the preceding intraday session. According to this indicator, we may anticipate future price hikes. The $320 resistance is one of the important levels to keep an eye on right now. For the next six days, we might anticipate a retest of this mark.
Yet, we recognize that candlestick patterns do not appear to be as promising as the other criteria. The five-day advance may be coming to an end as the daily chart shows an inverted hammer. BNB could once more lose the $300 support.
3. Stacks (STX)