
SUI grappled with notable bearish sentiment last week. The one-week chart showed it was one of the top losers, retracing from $4.20 to a low of $3.43.
SUI is seeing the downtrend continue into the new week as it failed to erase the almost 9% decline. Nonetheless, the asset reflects the trend across some cryptocurrencies at the time of writing. While some failed are seeing no significant improvement, others are registering notable declines.
The latest trend comes with improved buying and selling across the crypto market. Trading volume increased by over 8% in the last 24 hours.
A significant shift in fundamentals is likely responsible for the industry’s slightly bullish state. The market saw a massive decline on Friday as the United States President announced a massive 50% tariff on the EU.
Over the weekend, Trump announced that he would delay the levies after his conversation with the head of the European Union. The market is responding to this change.
Monero is seeing a cooldown after its massive surge last week. It broke into the top 20, displacing Toncoin. Its 18% surge in the previous seven days is surprising as many expected its crash after Binance delisted it.
The crypto market is starting a little slow, with no massive price shift. Let’s see how the rest of the session plays out.
Top Five Cryptocurrencies
BTC/USD
The one-week chart shows that Bitcoin has been on the uptrend since the second week of April. It registered a doji last week following its decline to $102k and peaked at $112k. The question of whether this will be its first red week is gaining more attention.
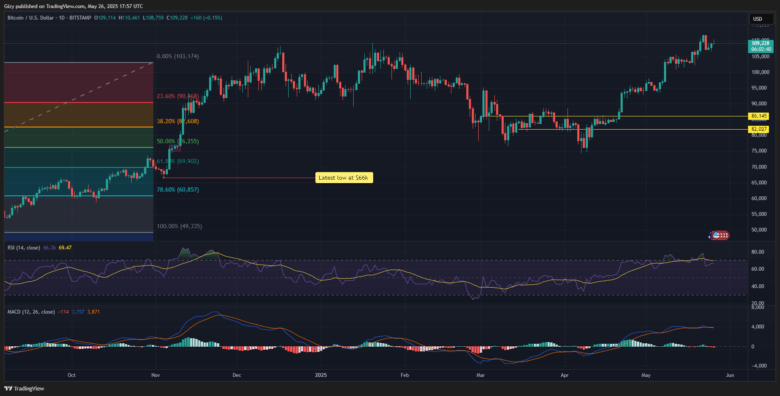
It is off to a sluggish start, peaking at $110,461 a few hours ago. The apex coin is back to its opening price as selling pressure mounts. Data from Cryptocurenciestowatch suggest that the latest decline was due to a slight decrease in trading volume.
Although BTC did not retrace as low as last Monday, RSI is at its lowest in the last three weeks. The metric showed that the apex coin was overbought for most of the period but slipped below 70 on Friday, hitting a low of 63. It suggests that the asset had seen one of its biggest spikes in selling volume.
The accumulation and distribution chart indicates that the bulls are yet to soak up the excess supply from Friday’s decline. BTC may see further declines as MACD flips bearish.
It rebounded off the $106k support last week. Its current price suggests it will lose the mark, slipping to $102k. Conversely, the bulls eye a new ATH at $115k.
HYPE/USD
Hyperliquid saw several massive single-day surges last week. It received an extra boost from Arthur Hayes, who predicted a possible hike to $100. Nonetheless, one of its biggest upticks happened on Thursday when it surged from $28.3 to 34, gaining over 18%.
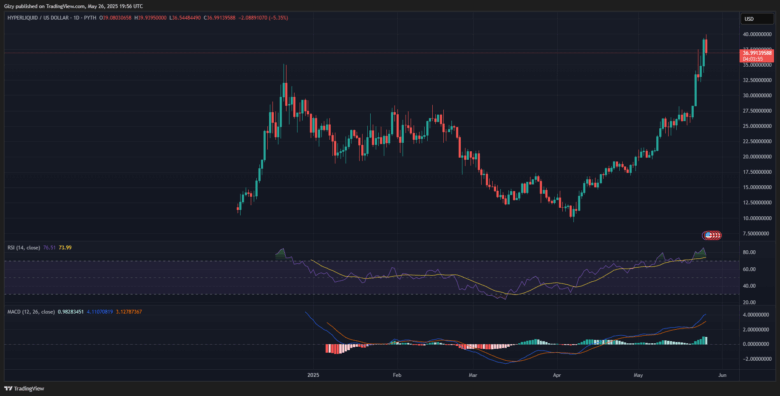
At the time of writing, the altcoin is struggling to continue the uptrend. It is notably declining, dipping from $39 to $36.8. It is down by over 5% amid a slight recovery. Traders fear a massive retracement following the over 40% hike last week.
The relative strength index shows that HYPE is overbought. It is at 76, signifying a spike in selling volume. The metric indicates more selling action may happen until it drops below 70.
Due to its notable demand concentration, previous price movements point to the $32.5 mark as a level to watch. A slip below this level may result in a retest of the $30 support.
SUI/USD
Sui retraced to $3.43 on Sunday but rebounded and closed at its opening price. It repeated the trend on Monday, dipping to the previous day’s low of $3.66. The coin is heading for a bearish close, showing no signs of recovery.
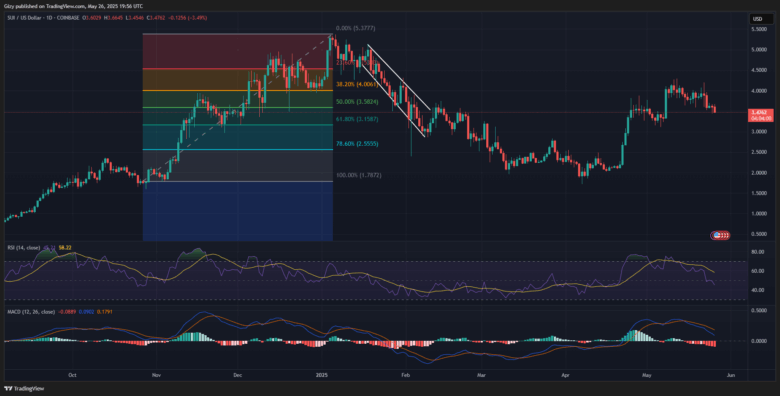
Data from Coimarketcap indicates that the asset is grappling with a slight decline in trading volume. This shows a drop in liquidity inflow that may affect buying volume. Nonetheless, the coin may be responding to several bearish fundamentals surrounding it.
The relative strength index shows that SUI is seeing a massive spike in selling pressure. The metric is at 45, its lowest reading since the second week of April. Previous trends suggest that it may be gearing up for a pullback.
The constant test of the $3.43 support indicates that the bulls are defending the mark. They may start a buyback that ends Sui above $3.80. However, it risks a slip to $3.20.
JUP/USD
Jupiter may end the day as the top gainer. It is off to a bullish start, surging from $0.55 to testing the $0.65 resistance. It faced notable rejections at $0.623 and trades a little low, but it may end the session with gains of almost 10%.
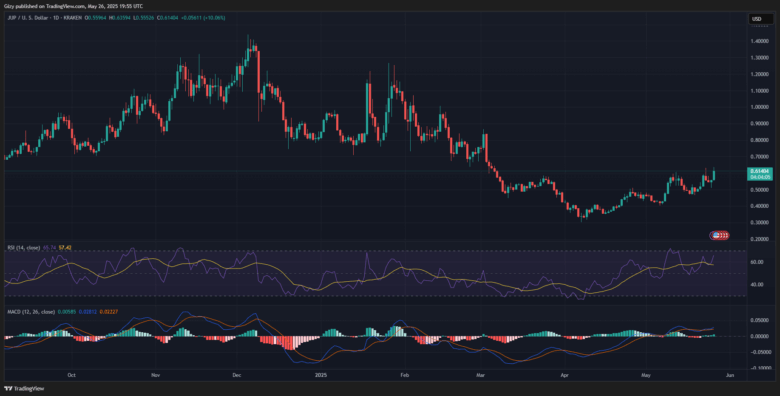
The token rebounded off $0.51 on Sunday and has since been on the surge. Indicators suggest that it may continue its over 8% increase this week. The moving average convergence divergence displayed a positive crossing between the 12-day and 26-day EMAs. Its bullish divergence was followed by massive increases over the last seven days.
RSI supports this claim as it trends at 65, showing room for further price increases. Previous price movement indicates that this is the second time JUP has tested the $0.63 mark with no success. The relative strength index suggests a possible flip this week.
However, it is worth noting that the asset broke above the bollinger bands a few hours ago. It risks massive descent in the coming days.
WIF/USD
WIF surged to a high of $1.19 a few hours ago but retraced as it faced massive selling pressure. At the time of writing, it trades at its opening price. While it failed to register any significant price change, it trades almost 8% higher than the previous day’s low.
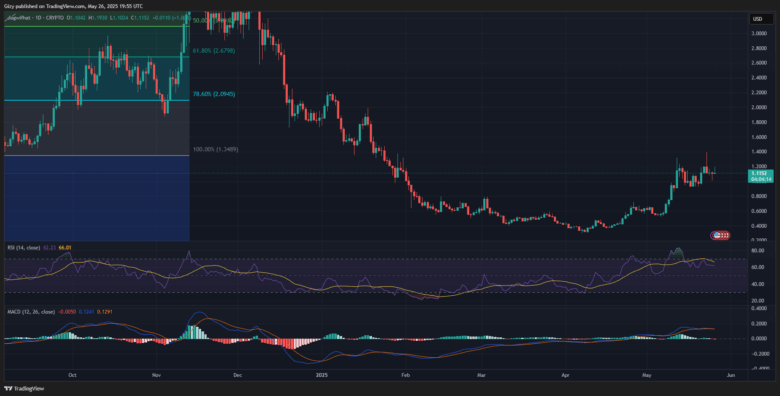
Indicators print conflicting predictions as to the next price action. RSI trends at 62 and has maintained this level for three days now. The almost parallel trend indicates an impending breakout. Its current reading shows room for more upside movement.
However, the moving average convergence divergence prints bearish signals. The metric displayed a bearish divergence on Sunday, which may indicate further declines.
Find Cryptocurrencies to Watch and Read Crypto News on the Go Follow CryptosToWatch on X (Twitter) Now
