
ETH is having one of its most significant declines in the last seven days. It is seeing a slow start to the week as many fear further descent.
ETH lost several key levels in the last 24 hours, mirroring the prevalent trend across the crypto market. Selling pressure reached a new height as fear and uncertainty spread.
The global cryptocurrency market cap retraced to $3.05 trillion and threatens to slip below $3 trillion if the downtrend persists. Trading volume increased by over 84% in the last 24 hours. Current valuations indicate that the reason for the hike is selling actions.
The crypto market saw almost no major bullish fundamentals that could positively impact prices. Will the trend continue this week?
Top Five Cryptocurrencies
BTC/USD
Bitcoin may slip lower as indicators flip bearish. The moving average convergence divergence displays a sell signal as the 12-day EMA intercepts the 26-day EMA. A bearish divergence is ongoing, which may mean further declines for the coin.
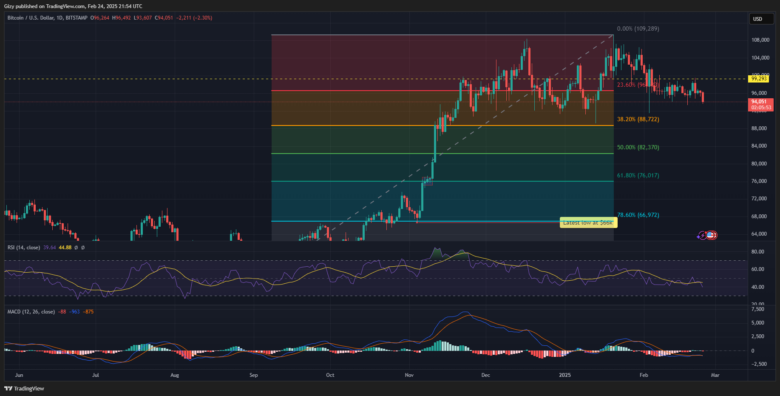
Nonetheless, the Bollinger bands point to a possible rebound. The apex coin currently trades below the lower SMA. It slipped from $96,264, broke the $94k support, and is trading at $92,883. The decline is ongoing, as the asset shows no signs of recovery.
Currently down by almost 4%, the bulls are gearing up for buybacks. BTC may see notable increases in price due to a spike in buying volume. However, MACD readings suggest it may continue its descent following the slight recovery.
Data from CryptoQuant shows that bears are gearing up to dump more assets. The exchange netflow is +1052%, indicating they are moving more coins from cold storage with the intent to sell. Due to this trend, the exchange reserves are also increasing.
The apex coin may continue downward if no notable shift in fundamentals happens. It may slip below $92k as the Fibonacci retracement level hints at a decline to the 38% fib level at $88k. On the other hand, it may rebound. However, it has a slim chance of breaking above $100k this week.
ETH/USD
Data from CryptoQuant shows that Ethereum was one of the worst hit by Monday’s selloffs. It shows a significant increase in exchange reserves. The exchange netflow shows a notable inflow from cold storage into these trading platforms with the intent to sell.
Transfer volume increased by over 401% in the last 24 hours, with active addresses rising by over 2% and transactions surging by 15%. US investors are showing intense selling pressure as the Coinbase premium is negative. This is the same trend across the Asian market as the Korea Premium is negative.
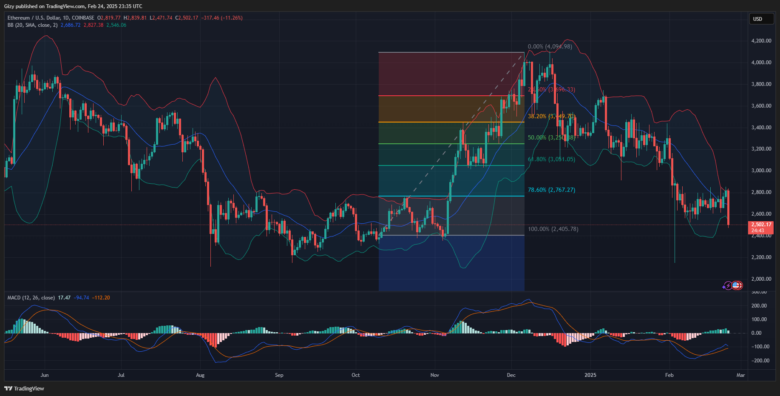
The spike in selling pressure resulted in massive price declines. ETH opened Monday at $2,819 but retraced after a slight increase. It broke its seven-day support at $2,600 and slipped below $2,500. The largest altcoin rebounded at $2,471 but is down by over 10% in the last 24 hours.
The Bollinger hints at an impending breakout. ETH trades below its lower SMA, indicating a possible trend reversal in the coming days. The uptick may take place on Tuesday, as previous price movement suggests that recovery may follow the current dip.
However, MACD prints sell signals at the time of writing. The 12-day EMA is on a downtrend in response to the ongoing price trend. A continuation of the bearish sentiment may see the completion of the bearish convergence, indicating further price declines. ETH may lose the $2,400 support this week.
OM/USD
Mantra was one of the top gainers over the last seven days. It surged from $7.42 to a high of $9.11 but retraced and closed at $8.50. It registered gains exceeding 14% during this period. The most recent hike marks its fifth week of consistent uptrend.
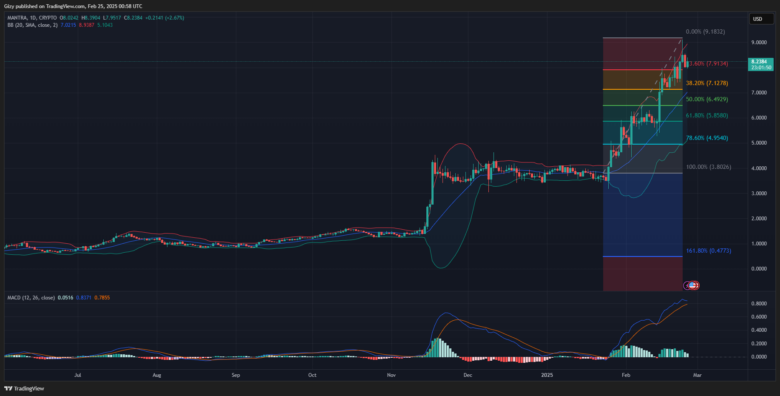
The upticks may not continue this week as the cryptocurrency is off to a slow start. It opened Monday at $8.49 but retraced after a slight increase and retraced, breaking the $8 support. The asset hit a low of $7.98 before rebounding.
Currently down by almost 5%, the moving average convergence divergence shows that the altcoin may see further declines in the coming days. The 12-day EMA halted its uptrend and is trending downward. The ongoing bearish convergence may indicate further decreases.
The Fibonacci retracement level shows that the asset still holds on to the 23% Fib level. However, readings from MACD hint at a possible slip below this level. It may continue downward until it retests the 38% Fib mark at $7.12. Due to notable demand concentration, it may rebound at this mark.
MKR/USD
Like OM, Maker experienced significant increases last week. It was one of the top gainers, surging from $989 to a high of $1,638, but retraced and closed at $1,523. It registered gains exceeding 54% during this period. The most recent hike marks its second week of consistent uptrend.
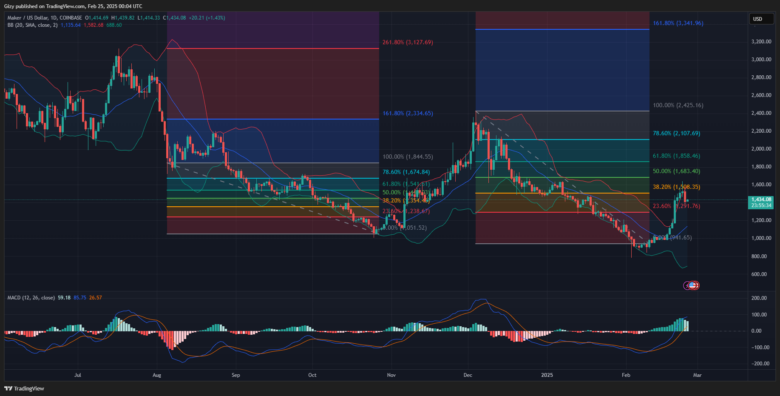
The upticks may continue this week as the cryptocurrency is off to a bad start. It opened Monday at $1,525 but retraced after a slight increase and retraced, breaking the $1,400 support. The asset hit a low of $1,382 before rebounding.
The latest decline sees it retraced below Bollinger’s upper band. It broke on Thursday and has since continued above it. The indicator points to the downtrend continuation as MKR still trades close to the upper SMA. It may retest the middle band at $1,135.
The Fibonacci retracement level shows the asset trading close to the 38% Fib level. However, readings from the Bollinger band hint at a possible slip below this level. It may continue downward until it retests the 23% % Fib mark at $1,291. Due to notable demand concentration, it may rebound at this mark.
TIA/USD
Celestia started the day at $3.23 but retraced, hitting a low of $3.16. It shows no signs of an impending rebound as reading from the bollinger points to a possible retest of the lower band.
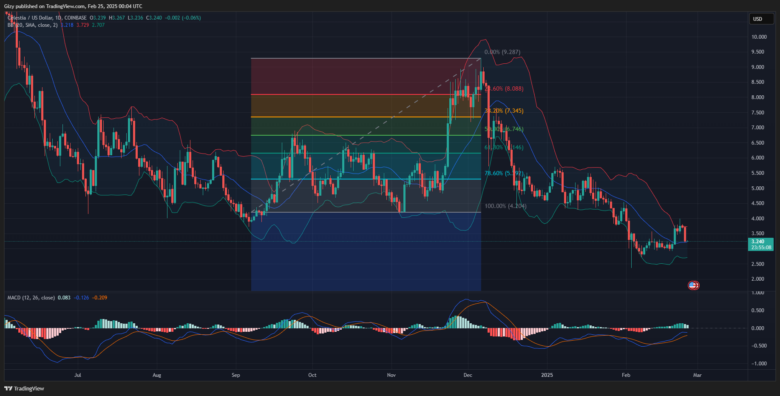
Currently down by almost 12%, the moving average convergence divergence shows that the altcoin may see further declines in the coming days. The 12-day EMA halted its uptrend and is trending downward. The ongoing bearish convergence may indicate further decreases.
Find Cryptocurrencies to Watch and Read Crypto News on the Go Follow CryptosToWatch on X (Twitter) Now
