
Ethereum failure to surge to a new all-time high amid the massive increase in Bitcoin’s price has left many traders frustrated.
The crypto community continues to criticize the asset for its recent failure. However, some investors remain optimistic about its prospects, citing several sources as reasons for their conclusion. Some noted that the revival of the altseason will enable the coin to attain its expected result. However, they failed to predict that this phenomenon would start.
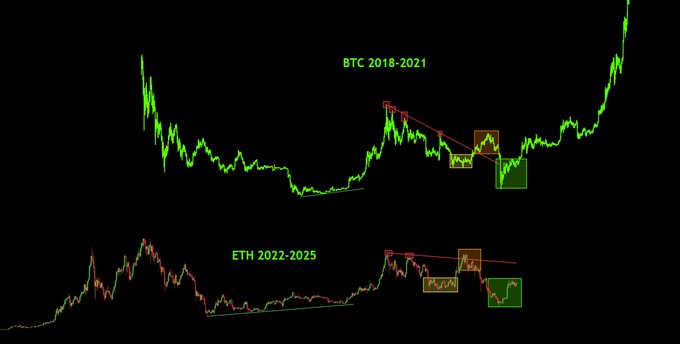
An investor presented further evidence that ETH is poised for a significant surge. D.I.Y Investing posted the image above on X as proof that the cryptocurrency is on the threshold of a massive breakout.
The figure shows a close resemblance between Bitcoin’s 2018-2021 run and the ETH 2022-2025 run. The largest cryptocurrency had a period of range-bound movement before a surge. The hike ended, and BTC experienced a massive retracement, returning to one of its lowest price levels. A parabolic run followed these trends.
Ether is currently at the last stretch of the trend and may see massive surges afterward. However, the sudden change in recent price patterns and market cycles creates a strong argument against this prediction.
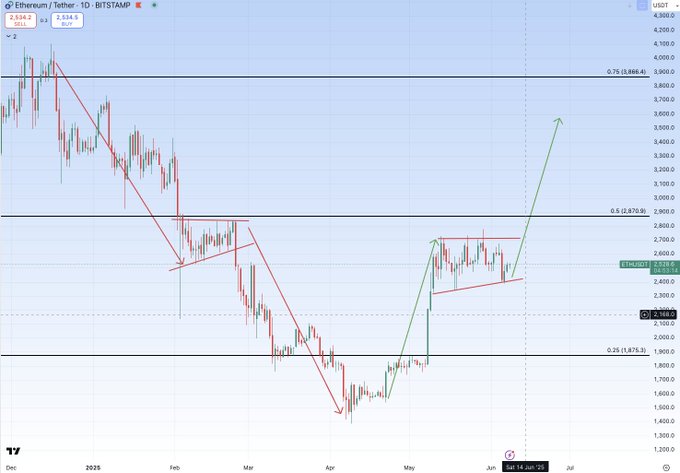
Nonetheless, ETH is shaping up for a short-term uptrend. Another X user presented a chart showing the asset in a range-bound movement and due for a breakout. The chart above suggests a potential breakout above $2,900 in the coming days.
Onchain Data Suggests Ethereum Will Retrace
Exchange flow data suggests that the current surge of the largest altcoin is unsustainable. These trading platforms are seeing a massive increase in inflows compared to outflows. Such a phenomenon may indicate an impending selloff as traders gear up to dump their bags.
Market data from the Asian and American markets reveals the reason for this trend. The Coinbase Premium is positive, while the Korea Premium is negative. ETH is seeing notable selling pressure from the latter region.
The fund market premium is negative, with volume declining. The latest reading from this sector suggests a change in the massive inflow ETFs saw last week. Data from Glassnode shows that Ethereum exchange-traded funds marked its fourth week of consistent inflows during the previous week.
Nonetheless, the derivatives market remains notably bullish despite the readings from the spot. The taker buy-sell ratio is above 1, indicating that long positions exceed short. Open interest increased slightly over the last 24 hours, with funding rates following suit.
Data from Coinglass shows no strong indication that traders are gearing up for a move towards $3k. Although there are sell orders at $2,700, there are few present after $2,900. This means that Ethereum will edge closer to $2.9k after flipping $2.7k.
MACD’s 12 EMA Surge
A closer look at the one-day chart indicates the moving average convergence divergence is printing buy signals. The 12 EMA is rising as a positive interception with the 26 EMA likely this week.
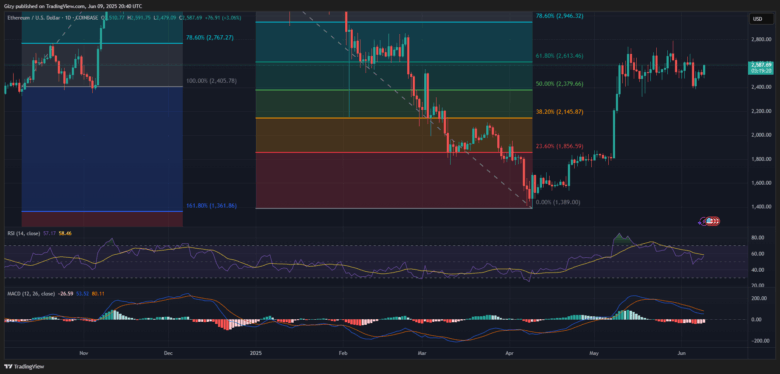
The relative strength index prints a similar trend, hitting 56. Current readings suggest that Ether has room for further upward movement.
Ethereum is grappling with notable resistance at $2,600, which has prevented it from flipping the level. Readings from both highlighted indicators hint at a surge above the mark and a potential retest of the $2,700 barrier.
Find Cryptocurrencies to Watch and Read Crypto News on the Go Follow CryptosToWatch on X (Twitter) Now
