Tag: Price Analysis

  • Crypto Analysis 12/20: BTC, ETH, SOL, XRP, DOGE, ADA, TRX

    Crypto Analysis 12/20: BTC, ETH, SOL, XRP, DOGE, ADA, TRX

    BTC had another massive decline a few hours ago. It plunged lower after the previous day’s decline, hitting a low of $92k.

    The entire crypto market bleeds as several assets register significant losses. The global cryptocurrency market cap $3.13 trillion from $3.36 trillion earlier on Friday. Traders’ fear further declined as the fear and greed index significantly dropped.

    The sector under consideration saw a significant increase in trading volume over the last 24 hours. Price action suggests that a bulk of the volume are from investors taking profit. Exchange-traded funds registered significant losses, with outflows exceeding $732 million during the previous intraday session.

    The crypto market suffers from a flurry of negative fundamentals. One of the biggest was the interest rate cut; it was lower than expected. The feds also forecasted possible inflation in January.

    Tensions are rapidly increasing among nations as the Middle East boils over again. The Houthi rebels launched a barrage of attacks on Israel on Thursday, resulting in massive response. Russia today announced the declaration of war on its people. While many speculate the reason for such an announcement, the US president and vice hastily return to the White House.

    Crypto’s top 10 see significant losses due to the several news. Let’s examine their current state.

    BTC/USD

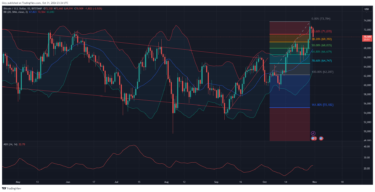
    The BTC/USD pair briefly dropped below a critical level due to the latest dip. Nonetheless, it rebounded and trades at $95,552. It returns above the 23% Fibonacci retracement, a vital support for the asset.

    The bulls are yet to fully recover from the selloff as the relative strength index dips lower. It dropped from 54 to 46 in three days as downhill movement enters day three. The accumulation and distribution chart shows almost equal pressure from the bulls and bears as buyback begins.

    Bollinger bands suggests an imminent surge as BTC fell below the lower SMA. A dip below this metric indicates the asset is experiencing massive selling volume. Reading from the A/D chart support claims of a possible uptick.

    The BTC/USD pair may remain stuck between the $95k and $102k channel for the rest of the week. Further dip may result in a dip to below $90k, with lows set at $85k.

    ETH/USD

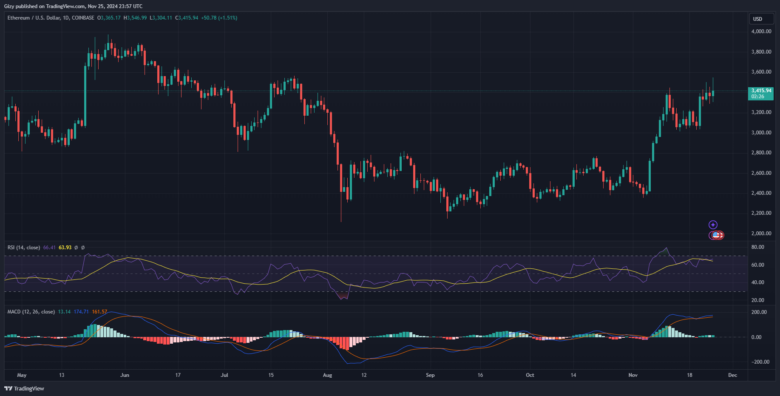
    The ETH/USD pair made a full recovery from its earlier dip. It retraced from a high of $3,500 to $3,095, its lowest value since the first week of November. It currently trades at its opening price following the rebound.

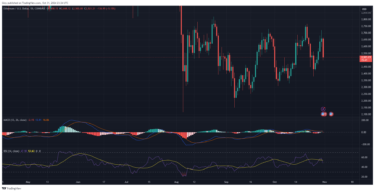
    The accumulation and distribution chart point to an ongoing buyback attempt. The trial yields result as the currency pair erased all losses. RSI trends parallel, indicating equal pressure from both market players. Nonetheless, this is the first time in the last four days it halted its downtrend.

    Bollinger bands predict that a surge may follow the rebound. The ETH/USD pair broke out from the bands, dipping below its lower band. Such price move hints at the asset seeing almost peak selling pressure.

    The pair bounced off the 61% Fibonacci retracement level but trades closer to the 38% Fib at the time of writing. The 50% level remains one of the toughest levels and ETH may rebound off this mark again in the event of another dip. Nonetheless, it may range between $3,2250 and $3,700 before a breakout.

    SOL/USD

    The SOL/USD pair retraced to its lowest valuation since Nov. 6. It dropped to a low of $175 a few hours ago before rebounding. The downtrend enters day three, and the pair sank lower as the relative strength index nears the sub-30s.

    The pair has been on the decline for most of December. Nonetheless, it edged closer to the 78% fib level before rebounding. RSI shows huge of possible declines below it. The accumulation and distribution chart shows ongoing buyback, and prices react accordingly.
    Losing the 78% level may result in the pair slipping below $160. The Bollinger bands suggest an imminent surge as SOL fell below the lower SMA.

    XRP/USD

    The bollinger bands are closing in, indicating that the XRP/USD pair is less volatile than it previously did. Nonetheless, it dropped below the lower band earlier on Friday, briefly losing its $2 status after hitting a low of $1.95. Its rebound shows an ongoing buyback and bulls gearing up for a possible uptrend. This coincides with the assertion that a slip below the bollinger band will result in trajectory change.

    The pair consolidated for most of December. Nonetheless, it edged closer to the 50% fib level before rebounding. RSI shows a huge possibility of declines below it. The accumulation and distribution chart shows ongoing buyback, and prices react accordingly.

  • Crypto Analysis 12/9: BTC, ETH, XRP, SOL

    Crypto Analysis 12/9: BTC, ETH, XRP, SOL

    ETH had one of its biggest surges during the previous week. It broke above $4k for the first time since March.

    ETH and other cryptocurrencies contributed to the slight global cryptocurrency market cap increase. It is at $3.55 trillion at the time of writing but peaked at $3.71 trillion a few days.

    The fear and greed index remained steady as many traders were bullish but cautious. Speculation of the cycle moving from Bitcoin season to altseason gains ground. The assertion comes after the apex coin failed to show as much volatility as before.

    The massive increase this asset class recently experienced fosters the conviction. PEPE gained over 19% over the last 24 hours. Opening trading at $0.000021, it shot due to a massive increase in buying pressure and currently trades at $0.000026.

    Quant resumes its uptrend with over 13% increase in the last 24 hours. It surged above $150 during the previous intraday session and flipped to $160. It briefly touched $170 a few hours ago but retraced and now trades at $166.

    Several cryptocurrencies attained fresh milestones over the last five days. The top ten also saw tremendous shifts.

    BTC/USD

    The apex coin surged to its highest valuation last week. On Thursday, it started trading at $98,781 and gradually gained momentum, breaking the $100k mark for the first time ever. It continued hitting a new all-time high at $103,647.

    The asset experienced massive selloffs after the milestone, resulting in notable price declines. It dropped to retest the $92k support before rebounding. It recovered, closing at $97k.

    The bulls tried resuming the uptrend the next day with considerable success. Bitcoin surged to a high of $102k but retraced to a close at $99k. Another failed attempt at an uptick failed on Saturday. Nonetheless, it closed with gains exceeding 4%.

    BTC has since failed to resume the uptrend or return to its ATH. Nonetheless, it had many positive fundamentals, with several institutions converting some of their reserves into the apex coin. Onchain data shows notable bullish evidence. Fewer whales are selling after the initial selloffs on Thursday.

    Indicators show growing bearish sentiment among retail traders, resulting in ongoing price declines. Bitcoin is currently down by almost 4%. The relative strength index dropped to 58 from 64 the previous day. The accumulation and distribution chart shows growing supply and the bulls’ inability to soak it up.

    The Bollinger bands show that the latest decline happened after the apex coin tested the upper SMA. MACD continued downward following the latest price trend.

    ETH/USD

    Ethereum broke above $4k for the first time in almost three years. The buildup started on Wednesday when it opened trading at $3,617 and shot up as buying pressure increased. It reclaimed the $3,800 barrier and hit a high of $3,900.

    The flipping happened on Friday, starting at $3,789 and surging to $4,000. It continued upward but faced massive resistance at $4,096. Nonetheless, it maintained momentum, closing the day above the critical mark. The gain added up to the 8% increase it registered on the weekly scale

    The apex altcoin’s return to $4k bolstered confidence in the asset. The trend spilled over to other assets in its ecosystem, with cryptocurrencies like PEPE, ENS, and ETC registering notable surges.

    ETH struggled to keep prices above $4,000 but failed a few hours ago. The selloffs ravaging the crypto market saw the altcoin lose the $3,800 support, hitting a low of $3,753. If trading conditions remain the same, it may close with losses exceeding 6%.

    ETH was overbought during the previous intraday session. A few minutes ago, the RSI dropped to 60 as the selling volume increased. The moving average convergence divergence blares warnings amidst the ongoing declines. The 12-day EMA stopped its uptrend and may intercept the 26-day EMA.

    XRP/USD

    XRP had its most bullish session on the first day of the previous week. It opened trading at $2.29 and shot up after a brief decline. It broke above $2.80 but faced a strong rejection of its bid to flip $2.90. The third largest cryptocurrency peaked at $2.87, retracing to a close at $2.72.

    The bulls staged a recovery the next day, pushing prices higher. The asset edged closer to the $3 mark but faced massive resistance at $2.90. Nonetheless, this is the closest it got to its ATH in over five years. It experienced notable selloffs after the milestone, dropping to a low of $2.30.

    The milestone thrilled XRP bulls, saying this is just the beginning. Many had high expectations for the asset, predicting a possible climb to $100.

    Nonetheless, the bullish period is over as the altcoin grapples with massive selling congestion. It dropped from $2.60 to $2.31 and is currently down 11%, showing no signs of halting its decline.

    MACD hints at further declines if trading conditions remain the same. The 12-day EMA is arching downwards and will intercept the 26-day EMA in the coming days. The relative strength index has been at its lowest over the last twenty days.

    SOL/USD

    Solana is printing one of its biggest candles on over two months. However, it’s a red as the asset experience massive declines at the time of writing. It opened trading at $237 and dropped, losing the $220 support. It currently trades at $218, down by over 7%.

    Since surging to a new ATH two weeks ago, the altcoin has grappled with a massive bearish sentiment. It dropped to a low of $215 last week but recovered. It surged to a high of $240 on Tuesday and closed with gains of almost 4%. The one-week chart shows a doji, hinting at no significant change in price.

    Since then, the Solana community has been less active, and there have been fewer speculations about its next price trajectory. Nonetheless, its ecosystem thrives, with traffic volume hitting fresh highs.

    The moving average convergence divergence had a bearish interception two weeks ago. Due to the latest declines, the 12-day EMA hit a new low. The RSI is at its lowest in over twenty days, dropping to a low of 43.


  • Crypto Analysis 11/27: BTC, ETH, SOL, BNB

    Crypto Analysis 11/27: BTC, ETH, SOL, BNB

    BNB and a few cryptocurrencies in the top 100 are on the uptrend. A look at the top 10 shows major assets grappling with small selling pressure. BNB received more attention as trading volume slightly increased.

    The global crypto market cap sharply dropped a few hours ago, hitting a low of $3.28 trillion. Trading dropped by over 17% due to growing bearish sentiment. The fear and greed index is at 84, dropping from 90 the previous day.

    Nonetheless, some altcoins are up by a notable margin. ENS shot up to $39 a few hours ago. It almost doubled in value during the previous intraday session, surging from $22 to $34. It is currently up by over 31%.

    WLD may close the day as the top gainer. It started at $2.55 and surged to a high of $3. Up by 13%, it closes the second consecutive day with significant increases.

    The crypto market is relatively calm regarding fundamentals. Nonetheless, some of the biggest concerns are CZ’s opinion on memecoins. He asserted that they are getting weird and called for more focus on utility tokens.

    Volatility returned to the market, and several cryptocurrencies attained new heights. Here is how some in the top 10 performed.

    BTC/USD

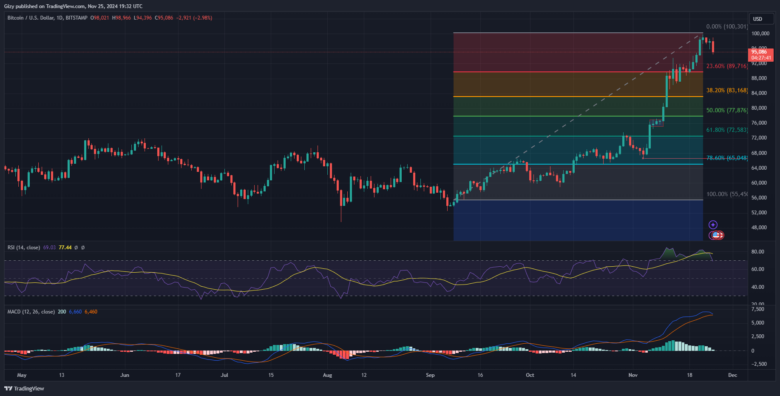
    Bitcoin faced strong rejections at $96k a few hours ago. It started the climb closer to the mark and peaked at $96,658. It lost momentum, slipping to a low of $94,658. The coin failed to register any significant moves as it grappled with growing selling sentiment.

    BTC is undergoing a cooldown following the previous day’s surge. It averted fears of a possible decline below $90k. Kicking off at $92k, it continued upwards, reclaiming the $96k barrier. It peaked at $97,353 and retraced afterward. Nonetheless, it registered over 4% increase.

    Onchain indicators are split amidst the ongoing trend. Traders in the Asian market may be responsible for the ongoing decline. The Korea premium is currently negative, showing lesser buying volume against the selling pressure. Nonetheless, exchange reserves are declining. Deposits from cold wallets into these platforms increased by over 140% over the last 24 hours.

    Indicators on the one-day chart are negative at the time of writing. RSI increased from 61 to 66 during the previous intraday session. It is at 64 as the accumulation and distribution chart suggests failure to soak up growing supply.
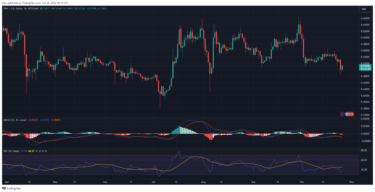
    MACD print sell signals at the time of writing. It had a bearish divergence a few days ago. The 4% increase during the previous intraday session failed to have any impact on 12-day EMA. It continues its decline, hitting one of its lowest levels over the last seven days.

    ETH/USD

    Ethereum had one of its biggest declines during the previous intraday session. It opened trading at $3,323 and surged, breaking its July high at $3,544. The uptick continued but halted $12 shy of $3,700. The bulls eagerly anticipated a possible retest of the $3,800. However, trading actions over the last 24 hours points to less buying volume.

    The buyers showed signs of exhaustion as ETH failed to continue its surge. The current day’s candle shows the asset had a sudden spike in selling volume following its opening. Currently trading at $3,580, the coin is recovering from a slight dip. It is also down by over 2%.

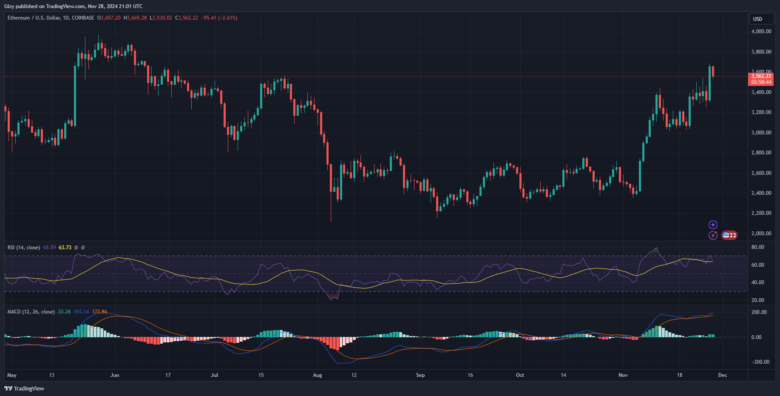
    The moving average convergence divergence prints buy signals amidst the small decline. The 12-day EMA continues its uptrend following the bullish interception a few days ago. However, it’s not at the same pace as the previous as the histogram bars remain the same.

    RSI hit 70 during the previous intraday session as the asset slightly became overbought. It’s currently at 66. The metric reading is the same as the A/D that shows growing distribution. Nonetheless, the bulls hold on to the $3,500 support amidst growing bearish sentiment. ETH must continue above this critical level or risk a dip below $3,400.

    SOL/USD

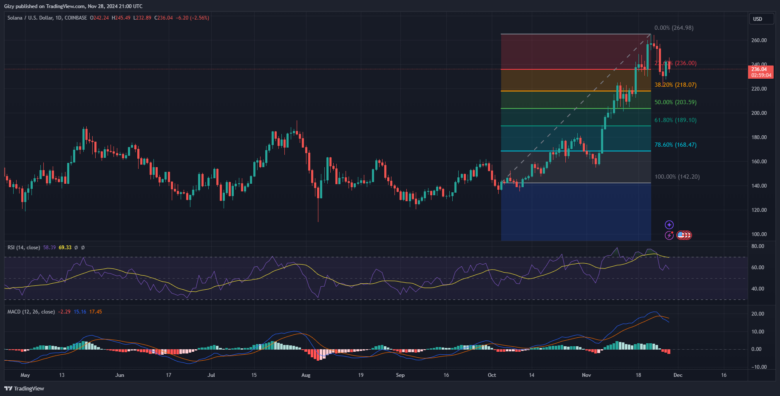
    At the time of writing, Solana is grappling with massive selling pressure. It shows signs of recovery as it trades at $236 after its decline to $232. The coin dropped from a high of $245, signifying an almost 3% drop in value since the day started.

    The asset is going through a cooldown following the previous day’s surge. It recovered from its previous four-day downtrend that saw it drop from $260 to $220. SOL lost a whopping 15% during this period. It gained over 5% following it surge from $230 to $243.

    Indicators like RSI and A/D shows massive bearish actions. The asset’s relative strength index is currently neutral following its drop from 70 a few days ago. The selloffs continues with the metric at 57. Accumulation has significantly dropped over the last 24 hours more traders dump their bags.

    MACD prints sell signals at the time of writing. It had a bearish divergence a few days ago. The 5% increase during the previous intraday session failed to impact the 12-day EMA. It continues its decline, hitting one of its lowest levels over the last seven days.

    Traders fear a retest of the $220 support. Previous price movements suggest it served as strong resistance. It remains to be seen if it will break.

    BNB/USD

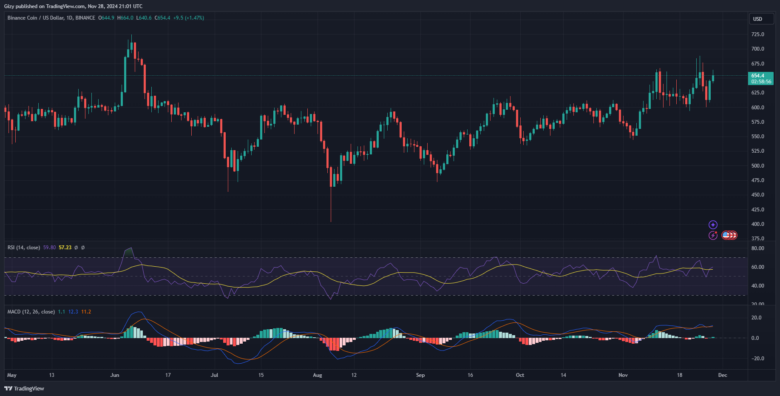
    Binance coin is on the verge of another breakout but faced strong rejections, resulting in a notable decline. It currently trades at $649 after opening the day at $644. It peaked at $664 as it lost momentum. BNB may close the current session with no significant change in value.

    Nonetheless, the reason for the latest change in trajectory may be due to the massive increase BNB saw during the previous intraday session. It started trading at $613, surging after a brief decline to $607. It surged, breaking above $640, and was $3 shy of $650.

    The current-day price action suggests that the bulls are getting exhausted. The sharp decline following the peak suggests that BNB is grappling with massive selling pressure. A/D chart on the 1-day timeframe shows dwindling pressure at soaking up supply.

    The relative strength index shows significant buying pressure during the previous intraday session, surging from 50 to 57. However, it barely moved by one figure over the last 24 hours. Nonetheless, the moving average convergence divergence remains positive amidst growing bearish sentiment. The 12-day EMA continues to climb following the bullish divergence during the previous session.

    Previous price movement suggests that the stay above $640 may be temporary due to less demand concentration. BNB looks to hold $250 to prevent further slip.


  • Top Four Cryptocurrencies to Watch: BTC, DOGE, UNI, SAND

    Top Four Cryptocurrencies to Watch: BTC, DOGE, UNI, SAND

    DOGE broke out as predicted. A previous analysis pointed to a possible change in trajectory, hinting at the asset’s breakout from the $0.44 barrier.

    AAVE is seeing its breakout at the time of writing. It opened the day at $171, retraced to a low of $166 as the selling pressure mounted. It recovered and surged to a high of $190. The altcoin broke out from its seven-day high at $183. Currently trading at the previous day’s high, it is up by over 6%.

    LDO may be the top gainer over the last 24 hours. It started trading at $1.46 and had a brief downtrend to a low of $1.40. It recovered and attempted to break the $1.80 barrier but failed due to significant resistance. The asset peaked at $1.76 but trades lower at the time of writing. It is up by almost 15%.

    The global cryptocurrency market cap is declining amidst the increases across several altcoins. It surged to a high of $3.38 trillion last week but is worth $3.28 at the time of writing.

    Several speculations as to the next price action are gaining momentum. The question of whether the downtrend will last over the next six days remains a question that only time will answer. Nonetheless, let’s look at the key levels to watch

    Top Four Cryptocurrencies

    BTC/USD

    Bitcoin started the day at $98k and tried breaking above the $99k barrier but failed due to strong rejection. It has since been on the decline, dipping below $96k. It recently lost the $94k support and trades at $93,400. The apex coin is down by almost 5% and shows no sign of recovery.

    BTC has been experiencing its biggest downtrend over the last two months. Nonetheless, the latest decline comes after the asset surged to a new ATH the previous week. It had a build-up to the event on Thursday, surging from $94,300 and breaking above $98k. It peaked at $99,121, breaking the barrier for the first time. The largest coin resumed the uptrend the next day, surging to $99,800.

    Indicators are flipping bearish amidst the ongoing decline. The relative strength index broke out from 70 on Nov. 6 and continued trending above it until Nov. 25. The apex coin is no longer overbought as the RSI is neutral at 64.

    The moving average convergence divergence hints at further decline in the next six days. The 12-day EMA is in contact with the 26-day EMA, completing the bearish convergence. Bitcoin may record a divergence with further dips—the Fibonacci retracement level points to a possible drop below the $90k support.

    DOGE/USD

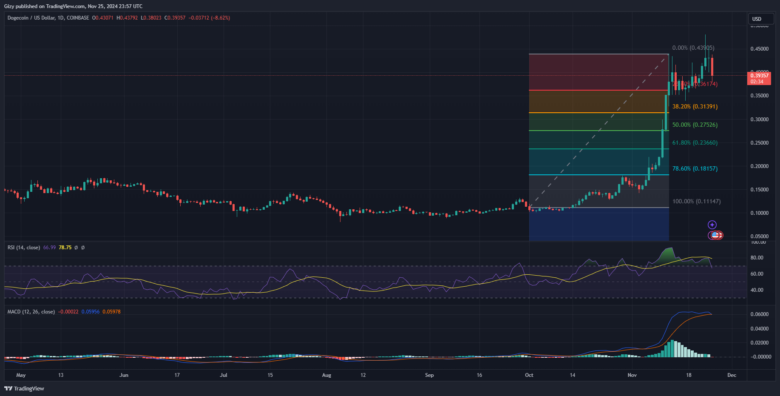
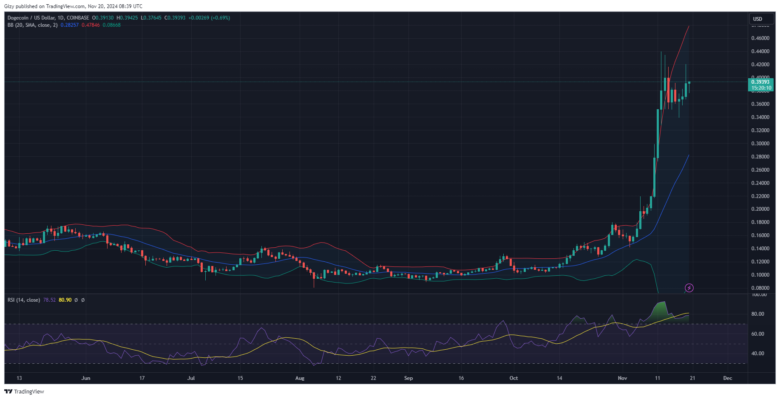
    Dogecoin broke out of a dominant trend, which it maintained for most of the last fourteen days. It failed to break the $0.44 resistance and traded between it and $0.35. The breakout happened on Saturday when it opened trading at $0.41 and recovered after a brief decline. It surged above the highlighted level, peaking at $0.48 before dipping due to massive selloffs.

    The DOGE attempted restarting the uptrend the next day. It dropped to a low of $0.40 but recovered and surged to a low of $0.45. However, the asset is trading at $0.39. It opened trading at $0.43 but dropped to its current valuation as the bears took over.

    Indicators are turning bearish amidst the ongoing decline. The RSI broke out from 70 on Nov. 6 and continued trending above it until Nov. 25. The altcoin is no longer overbought, as the RSI is neutral at 64.

    The moving average convergence divergence hints at further decline in the next six days. The 12-day EMA is in contact with the 26-day EMA, completing the bearish convergence. DOGE may record a divergence with further dips.

    The Fibonacci retracement level points to a possible retest of the $ 0.36 support in the coming days. Since it lost the $0.40 support, the bulls must hold the prices above $0.38 to prevent further declines.

    UNI/USD

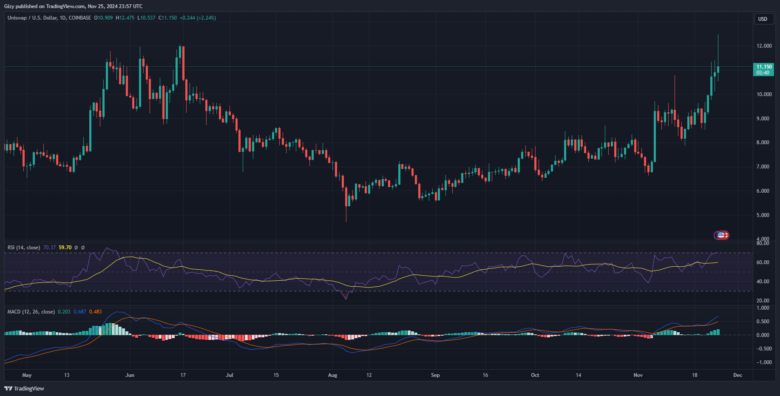
    Uniswap has been on the uptrend since Thursday. Its attempt to test $10 ended with limited success as it faced massive rejections at $9.70. It edged closer to the mark the next day but failed to flip it decisively. It finally broke above the barrier on Saturday when it opened trading at $9.95 and surged to a high of $11.35 before retracements.

    The altcoin resumed its uptrend a few hours ago. It dropped to a low of $10.5 and rebounded. It shot up, hitting a high of $12.5, facing strong rejection at the mark. Currently exchanging at $11.2, UNI struggles to maintain uptrends due to growing bearish pressure.

    Uniswap sees notable buying pressure amidst growing negative dominance. The relative strength index is above 70, which means the asset is overbought. While this reading may mean further declines in the coming days, other assets maintain their momentum despite being overbought. The same happens with the altcoin.

    MACD points to further surges as the 12-day EMA continues its uptrend. It shows no signs of halting the trend as the 26-day EMA joins in.

    Uniswap may reclaim $12.5 and edged closer to the $14 barrier if the bulls sustain the momentum. It risk further declines to $10 if they fail.

    SAND/USD

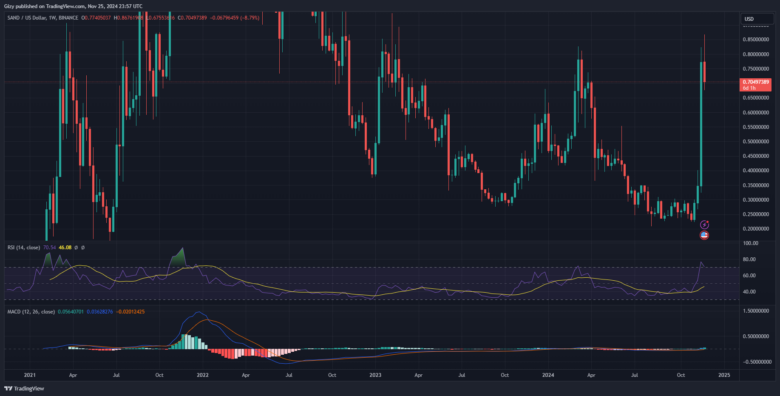
    SAND had one of its most significant surges during the previous intraday session. It opened at $0.43 and shot after a brief decline. It broke above its June high at $0.55, returning to March’s high at $0.82. Despite the slight declines, it closed with gains exceeding 76%. The altcoin also gained over 122% during the previous week.

    Sandbox is currently in a downtrend. It opened the day at $0.77 and surged to a high of $0.86. It faced massive rejection and traded at $0.70 following a brief decline below it. The altcoin has lost over 8% since the day started but shows signs of recovery.

    The relative strength index points to the reason for the ongoing decline. It was overbought and is currently seeing massive declines. However, RSI hints at further declines as it is not neutral amidst the downtrend. The metric is at 78 after it peaked at 87 during the previous intraday session.

  • Crypto Analysis 11/25: ETH, SOL, BNB, XRP

    Crypto Analysis 11/25: ETH, SOL, BNB, XRP

    SOL rose to a new all-time high during the previous intraday session. It maintained its spot in the top 10 after displacing the BN a few days ago.

    The crypto market was largely bullish during this period but has lost momentum at the time of writing. Nonetheless, XLM continues its upward momentum with a bigger surge. It gained over 29% on Nov. 22, flipping its July high. It returned to its highest valuation as of May 2021, surging to a high of $0.55 but retracing to a low of $0.48 at the time of writing.

    Polkadot received a significant boost from the bulls following the previous day’s 11% increase. It started the current session at $6.54, breaking May’s high of $7.80. It continued upwards, flipping $9, but lost momentum as it edged closer to $9.50.

    Fresh investments flocked into the crypto market over the last seven days. Retailers are waking up as the Coinbase app surges up the IOS store. Phantom Wallet registered a similar milestone a few days ago.

    New integrations from other sectors poured into the industry. Nonetheless, how did the assets in the top 10 perform over the last six days?

    ETH/USD

    Ethereum recovered from its decline two weeks ago. It had a bullish start to the previous week but changed trajectory on Tuesday and Wednesday. Many traders feared a drop below $3k. However, it resumed its uptrend on Thursday with one of its most significant surges.

    It opened trading at $3,072 and resumed after a brief decline. The bulls staged a buyback, pushing prices high. It reclaimed the $3,200 level, continuing upwards but retracing following a failed attempt at the $3,400 barrier. Peaking at $3,390, it closed with gains exceeding 9%.

    It attempted to break the $3,500 barrier on Saturday but failed. ETH broke above the mark a few hours ago, hitting a high of $3,546 before corrections.

    Indicators remain positive amidst the ongoing uptick. Last week, the moving average convergence divergence printed a bearish divergence but recovered and reversed the trend. The 12-day EMA is rising, and the 26-day EMA is doing the same.

    The Relative strength index is at 67. The apex altcoin may see further increases before it breaks out above 70 and becomes overbought.

    Onchain data shows that the asset sees notable buying pressure from the US. The Coinbase premium is currently positive. Traders in South Korea are also bullish, as indicated by the green Korea premium. The bullish sentiment spreads into the derivative market, causing a significant surge in funding rates.

    SOL/USD

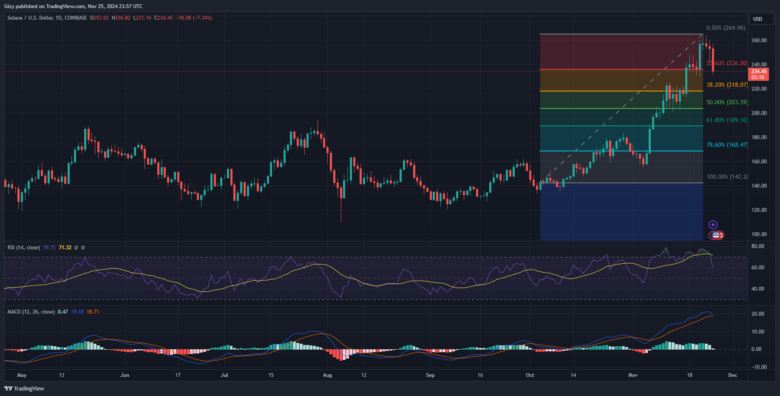
    SOL surged to a new all-time high during the previous week. It happened on Friday when it recovered from a drop to $251. It surged to a high of $264, the new ATH. However, it closed with a doji, facing massive retracement following its peak.

    The altcoin had a buildup to the milestone on Thursday. It opened the day at $235 but dropped to $230 before rebounding. It broke above $250 for the time in years. SOL continued upwards, edging closer to $260, but failed to break it.

    The coin has since been on the decline following its all-time high. The downtrend is currently on the decline. SOL opened the day at $253 and is trading at $240 after it dropped to a low of $233. Currently down by almost 5%, indicators are currently bearish.

    MACD prints sell signals. The 12-day EMA is declining in a negative convergence. If the downtrend continues, it may intercept the 26-day EMA in the coming days. Nonetheless, RSI shows that the asset is not overbought at the time of writing; the metric is neutral at 63.

    Previous price movements hint at the importance of $230 support. The bulls must defend this mark as a slip below it may send SOL as low as $210.

    BNB/USD

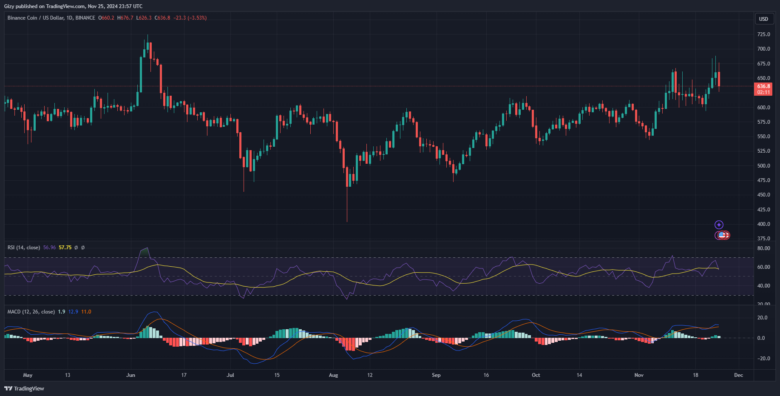
    Binance coin was mainly bullish last week. The main round started on Thursday when it started trading at $605 but dipped to $593. It rebounded and surged to a high of $630. The uptick continued on Saturday, with the asset at $633. It experienced a massive increase in buying volume, shooting prices above $650. It continued upwards, peaking at $683, but retraced due to massive selling congestion.

    It had a similar movement on Sunday, hitting a high at $688. A few hours ago, BNB edged closer to the $680 resistance but faced massive resistance. It dropped to a low of $632 but is currently trading at $646.

    Indicators remain positive amidst the ongoing uptick. Last week, the moving average convergence divergence printed a bearish divergence but recovered and reversed the trend. The 12-day EMA is rising, and the 26-day EMA is doing the same.

    The Relative strength index at 60. The apex altcoin may see further increases before it breaks out above 70 and becomes overbought.

    XRP/USD

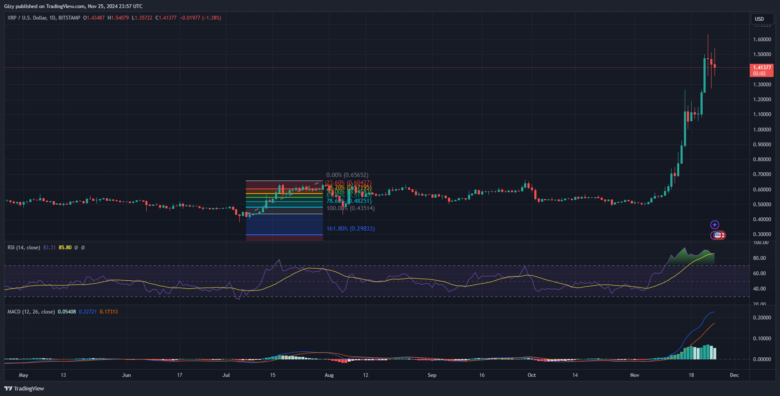
    XRP registered gains exceeding 36% last week. It accumulated most of the gains between Thursday and Friday. It started the fourth day of the week at $1.10, surged above $1.20, and peaked at $1.30. It closed with gains exceeding  12%.

    It had its biggest surge the next day, opening at $1.24. It surged to a high of $1.50 for the first time in over a year. Despite small declines, it closed with gains of almost 20%. The bulls tried to continue the trend the next day with limited success. The altcoin hit a high of $1.16.

    It registered notable declines during the previous intraday session, dipping to a low of $1.27 after opening trading at $1.46. A few hours ago, it recovered from a low of $1.35. The bulls’ buyback is the reason for the asset’s 2% increase.

    The moving average convergence divergence maintains its bullish stance. The 12-day EMA and 26-day EMA are on the uptrend. The relative strength index shows the asset experiencing massive buying pressure. It is at 86 at the time of writing, and XRP is overbought.

    The momentum indicator points to an increasing bearish presence. The metric dropped 0.77 to 0.66. It remains to be seen how prices may react in the coming days. Nonetheless, previous price movements have pointed to a notable demand concentration of $1.20.

  • DOGE, SHIB, and PEPE are Gearing For Major Surge. How High?

    DOGE, SHIB, and PEPE are Gearing For Major Surge. How High?

    DOGE and SHIB have recently struggled to maintain trading above a critical level. The crypto market seems to lose momentum following Bitcoin’s climb to $90k.

    The memecoin ecosystem remains strong amidst the growing uncertainty. Solana DEX volume hits a new all-time high. Traders speculated that the native coin may attain a new ATH if volume remains constant.

    DEXs handled over $41 billion in transactions between Nov. 4 and 10, doubling the $18 billion it registered last week. The latest figures drive the monthly volume to a staggering $70.9 billion. Raydium handled over 72% of the total trading, while Orca and Lfinity facilitated $7.6 billion and $2.5 billion, respectively.

    The main reason for the milestone is memecoins. New tokens like PNUT and GOAT saw fresh investment pour into the space, and promises of a massive return continue to push the memecoin rush. For example, a trader who invested $17 in the squirrel token made 12,000x in profit.

    The growing number of such tokens on exchanges is another reason for the massive attention. Binance recently listed $Pnut, resulting in an over 300% increase in less than 24 hours. BONK surged to a new all-time during the previous intraday session.

    It started trading at $0.000048 but slightly declined at the start of the day. It rebounded, climbing above its previous ATH at around $0.000055. It peaked at $0.000057. The latest milestone comes after Upbit listed the asset on its platform.

    There is more to come from the memecoin sector. One key factor to watch out for is their price correlation with the apex coin. Once Bitcoin, there will follow, with more volatility. Let’s see how these assets will perform in the coming days.

    DOGE/USD

    Dogecoin is on the verge of another breakout. Recent price action shows the asset is gearing up for a major move. However, it has failed to break the $0.44 barrier after several attempts. The first happened on Nov. 12, when it started trading at $0.35 but retraced to a low of $0.30 before rebounding. It shot up to the highlighted mark a few hours ago but failed to break it.

    DOGE closed at $0.38 following the massive rejection at the peak. The price movement repeated the next day, and the asset gained over 5% after its corrections.

    Thursday was one of the most bearish days for the asset. It lost over 9% during this period. Over the next few days, it remained locked between $0.40 and $0.34. It broke the pattern during the previous intraday session. It started the day at $0.37 and surged to a high of $0.42 but retraced afterward.

    One reason for the breakout was a change in Bitcoin’s price trajectory. It attained a new all-time high during the previous intraday session, peaking at $94k. DOGE’s price correlation with the top asset is 0.99, one of the highest in the market.

    Although there are few onchain metrics, the asset has a thriving community. Its “fanbase” rose by over 1% over the last seven days. However, it grapples with notable selling pressure. Total exchange netflow is currently negative, exceeding -$15M.

    Its price correlation will be crucial in the coming days as Bitcoin proponents anticipate more price increases. Dogecoin will break above $0.44 and edge closer to $0.70.

    SHIB/USD

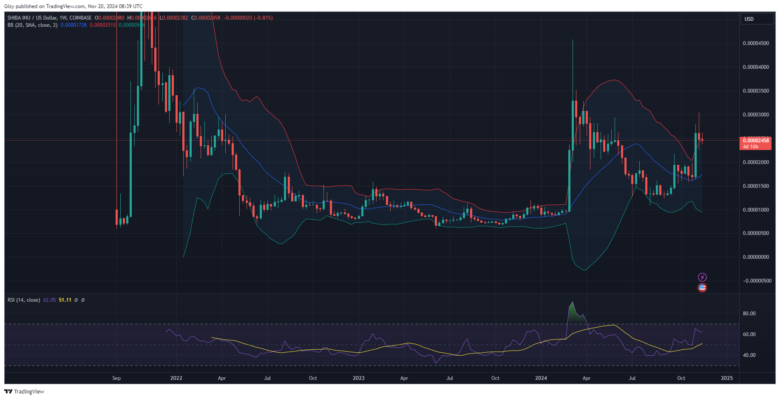
    Shiba Inu gained a whopping 27% on Nov. 10. It started trading at $0.000020 and surged to a high of $0.000028. It experienced slight declines that saw it close at $0.000026. It continued the uptrend the next day with notable surges. It edged closer to $0.000030 but failed due to massive rejections.

    Nov. 12 was one of the most volatile for the asset, as it dropped to a low of $0.000024 but rebounded and climbed above the highlighted barrier. However, it registered losses exceeding 5% in the end. The memecoin slipped further the next day.

    The asset started a trend of trading within a channel. It bounced between $0.000022 and $0.000026. Following several attempts over the last seven days, it failed to break out of this pattern. Its consistent pressure on the support spreads massive fear of the level buckling.

    Nonetheless, indicators are split on the next price action. The moving average convergence divergence shows an ongoing bearish divergence. With the divergence underway, the asset may see further declines. However, price actions suggest possible accumulation above $0.000023, which may result in recovery.

    The relative strength index supports the idea of an impending price uptick. At the time of writing, the metric is at 58, showing room for price surges. The Bollinger Band supports this claim as the upper band is farther from current prices.

    Recent price action shows BTC edging closer to $100k. The bulls are gradually recovering from their previous exhaustion. The memecoin will see a trickle of funds as the apex coin edges closer to the highlighted mark. Its correlation, which stands at 0.92, may play a huge role in the coming days.

    PEPE/USD

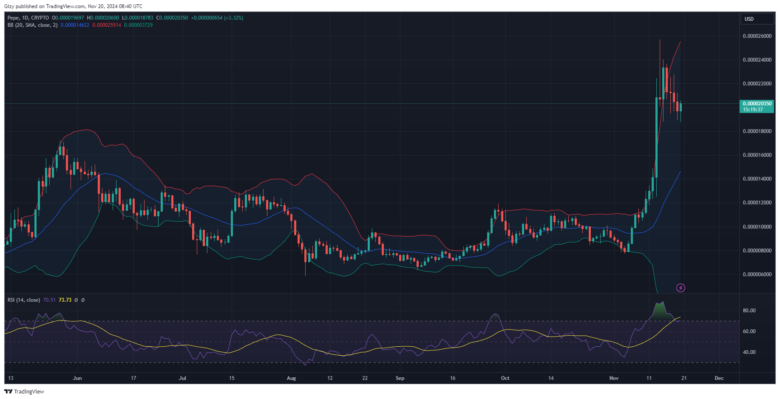
    PEPE has been on the decline over the last five days. The downhill movement started following its massive surge on Nov. 15. It started the day at $0.000020 and surged to $0.000023 following an enormous decline to a low of $0.000018.

    A massive decline started the next day when prices dropped from $0.000023 to $0.000020, losing almost all the accumulated gains. The downhill movement continued over the next four days, with losses of over 12%.

    MACD suggests further declines in the coming days. The 12-day EMA is dipping and may intercept the 26-day EMA. The ongoing price decline follows the readings from this indicator. However, other metrics point to an impending change in price trajectory.

    The relative strength index is at 65, showing room for price surges. It may retrace further to guarantee a solid recovery. The Bollinger Band supports this claim as the upper band is farther from current prices.

    Onchain data from IntoTheBlock are most bullish amidst the ongoing price declines. Three of the four metrics are currently bullish. Large transactions have increased by over 12% over the last 24 hours, and bullish concentration increased on the asset during this period.

    The asset has a 0.94 price correlation with Bitcoin, which means that the memecoin will surge as the top coin does. This is especially important as the apex cryptocurrency is gearing up for major leaps at critical levels.

    PEPE is gearing up for a significant price move. During the next run, it will surge above $0.000030.

  • Is Bitcoin Hitting $200k Inevitable this Cycle?

    Is Bitcoin Hitting $200k Inevitable this Cycle?

    Bitcoin had one of its biggest rallies during the previous intraday session. The US election was the primary catalyst in the surge. The crypto-favorite edged and won the race.

    The apex coin opened the day trading at $69,396 but surged after a brief decline. It climbed higher, flipping $72k and $74k later. It rose to a new all-time high before noon UTC, hitting a high of $75,397.

    The crypto market saw massive inflows during this period. Trading volume surged by over 20%, with massive inflows into Bitcoin. The largest cryptocurrency went through a short cooldown, hovering around $74k according to the one-hour chart.

    United States traders asleep during the election counts woke up to the news of Donald Trump’s victory and pushed prices higher. BTC recorded a new ATH, climbing above $76k for the first time ever and peaking at $76,481.

    Bitcoin is going through another cool-down and trades at $75k. Slightly down since the day started, it remains to be seen if the bulls will resume the uptrend.

    Nonetheless, there is good news for the apex coin apart from the new ATH.

    Bitcoin Capped a New Low

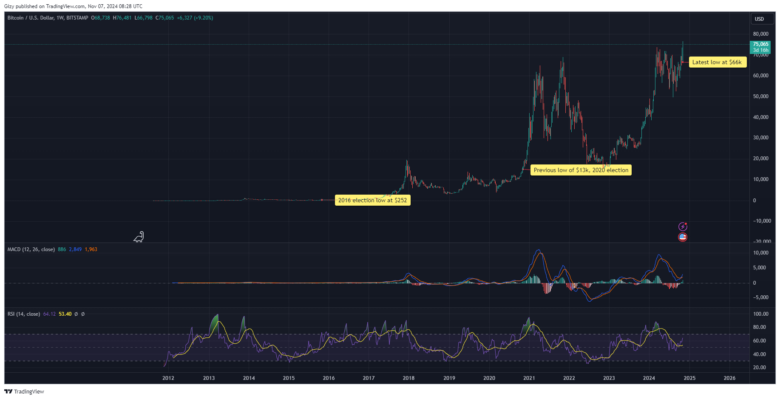
    Historically, Bitcoin sets a new low during every election period. Four elections have passed since the asset’s inception, and it has not returned to its previous levels. For example, it registered a low of $252 in 2016. Despite the bears’ market, it surged by over 1000% and has revisited this mark.

    2020 presented the same trend. The apex coin recorded a low of $13k during the elections, surging by over 350%. The Ukraine-Russia war rolled in, the tension in the Middle East reached new highs, and the bears capitalized. Although it retraced to $16k, the $13k remained intact.

    Bitcoin hit a low of $66k this week and shot up following the polls. If the previous trend holds, it may never return to this level. Aside from capping a new low, the largest cryptocurrency will hit new highs; speculations on how high vary. Nonetheless, on-chain data prints bullish signals.

    Coinbase Premium is Positive

    US traders are flooding the market post-election. With the polls going the way many in the crypto market want, it spread a bullish sentiment. Onchain shows the Coinbase premium is currently green, indicating notable demand concentration from the region.

    The bullish sentiment spreads to other regions, including the Asian market. It sees massive inflows as the Korea premium indicates. The US and Hong ETF experienced the same trend, with the United States witnessing an inflow exceeding $600 million the previous day. However, the inflows from this instrument slow down as the fund premium is negative.

    Other critical indicators, like the Stochastic and Relative Strength Index, suggest room for more surges. Both metrics are neutral, indicating that the apex coin experiences normal buying pressure. This is important as miners are currently selling.

    Nonetheless, the derivative market sees massive activity. Funding rates are significantly up as more traders flood the sector with new funds, some to extend their liquidation mark, while others to open new positions. This is especially true as open interest is 6% higher than the previous day.

    The bears are the biggest losers in the market over the last 24 hours. Although liquidations are down by over 44%, the losses continue. Traders lost over $300 million, with short positions making up over $200 million from over 24 million traders. Nonetheless, the bears are edging as there is a significant growing selling sentiment.

    The growing selling trend is due to massive unrealized profit. Onchain data shows large holders moving their assets. They moved 24% more assets than during the previous intraday session. Due to this trend, the exchange netflow is positive, indicating possible impending sell-offs. Amidst investors taking profit, exchange reserves are declining.

    Bitcoin May See Short-term Declines

    The one-day chart explains the reason for the ongoing decline. The relative strength index surged from 51 on Monday to 71 at the time of writing. The massive increase in buying pressure forced a sudden rise. Nonetheless, the apex coin is overbought and due for corrections, so it is unable to continue the enormous surge.

    The Bollinger bands show another reason for the decline. BTC broke above the upper band during the previous session. It is exchanging above this crucial metric and has yet to retrace below it. Trading above this metric indicates an impending decline as it signifies the peak of a short-term uptrend.

    The decline may last for a week or two as this is the same sentiment on the one-week chart.

    BTC Will Resume its Surge

    The one-week and one-day charts suggest that the apex coin will see massive increases following the short-term downtrend. The moving average convergence divergence displayed a bullish interception during the previous intraday session. MACD’s 12-day EMA continues its uptrend, with the 26-day EMA following behind.

    The same trend is present in the seven-day time frame. Nonetheless, the RSI on the larger timeframe shows room for more uptrends. The average directional index halted its descent as the downtrend lost strength.

    MACD’s latest interception on the weekly scale may spell massive increases for the apex coin. It gained a staggering 170% after the previous crossings. It may surge higher during this period, hitting six figures. With 160% in mind, BTC may hit $175k. Previous price movements also suggest that the rise will happen within five months. It remains to be seen if history will repeat itself.

    Bitcoin’s latest bullish divergence on the one-day chart will see it continue charting prices into new price marks. One report speculates a possible rise to $100k before Trump’s inauguration, meaning the asset will register more price increases this year.

  • Bitcoin and Ethereum Sees Masssive Decline. Will it Affect November?

    Bitcoin and Ethereum Sees Masssive Decline. Will it Affect November?

    Bitcoin is down by over 3% at the time of this writing. It is unable to continue the uptrend, and investors have become increasingly bearish.

    Onchain data shows massive wallet movement from wallets over the last 24 hours. The slight increase in exchange reserves tells about the ongoing sentiment. These trading platforms also recorded a notable rise in coins deposited during this period, indicating a growing selling pressure.

    A look at the unrealized profit and loss shows a vast number of wallets in profit. As the market anticipates more selloffs from these wallets, fears of further declines increase. Others are trading off their bags as the aSOPR shows massive profit-taking.

    The asset also sees massive outflows from critical regions. One such is the United States. It was one of the leading regions in the previous short burst but is bearish at the time of writing. The Coinbase premium is negative; traders dump their assets. This is the same sentiment in the Asian market as they take profit, resulting in a negative Korean premium.

    Miners joined the frenzy with a notable hike in trading volume. The selling pressure resulted in the liquidation of over 56 million long positions, which amounted to over $60 million. Selling sentiment remains dominant in the derivative markets as more sell orders are fulfilled.

    Nonetheless, bullish traders expect a rebound anytime soon as they strengthen their positions to avoid liquidations. Others opened new trades, and the open interest surged by over 92% in the last 24 hours. Funding rates increased due to increased activity in the market.

    Bitcoin May Drop to $66k

    Bitcoin prints bearish signals on the 0ne-day chart. Indicators like the moving average convergence divergence are negative at the time of writing. The 12-day EMA is on the decline following its previous surge. Previous declines resulted in an interception with the 26-day EMA, and it may play out the same way this time.

    The Bollinger bands explain the reason for the ongoing declines. BTC peaked above the upper SMA on Tuesday and ended the day above it. When an asset attains this feat, price declines are bound to follow, and the unfolding downtrends are a result. Currently trading at $70k, it is closer to the middle band and may rebound soon.

    The relative strength index is declining as selling pressure mounts. The accumulation/distribution mirrors this movement as accumulation decreases. ADX is on the decline as the uptrend hits brick and loses momentum.

    Bitcoin recently tested the 38% Fibonacci retracement level at $69,400 but rebounded. Previous price movement shows the apex almost certainly tested the middle Bollinger band after breaking above the upper. If that plays out this time, it may drop to the 50% fib level at 68k. Nonetheless, it may slightly slip below it, putting the 61% level at $66,600 in view.

    A surge during the first half of November is almost inevitable, as the one-week chart is mostly bullish. MACD on this timeframe showed a positive divergence a few weeks ago. The latest event is significant as the previous bearish interception resulted in losses exceeding 24%.

    Three weeks ago, the apex coin gained over 9%. It broke out from a downward channel that started in March. Such a breakout will spell further price increases in the coming days, and November may be more bullish than the present.

    Considering the 24% increase during the previous interception, a new all-time in November is almost inevitable.

    Ethereum Flips Bearish

    According to onchain data, there has been a significant amount of wallet movement over the past 24 hours. The slight rise in exchange reserves provides insight into the current mood. Coin deposits on these trading sites also increased noticeably around this time, suggesting that selling pressure was intensifying.

    There are also significant withdrawals from impessentialcations from the asset. The United States is one example. Although it was among the top locations during the last brief surge, it is currently bearish. Traders dump their assets because of the negative Coinbase premium. The Asian market shares this opinion as they profit, which causes the Korea premium to decline.

    At the time of writing, exchange-traded funds are experiencing massive outflows, exceeding $5 million, which has resulted in the fund premium becoming negative. Nonetheless, over 41 million long positions totaling more than $30 million were liquidated due to selling pressure. As more sell orders are fulfilled, selling sentiment continues to dominate the derivative markets.

    Ethereum is currently trading down by almost 6%. It started the day at $2,658 but saw massive corrections following a failed attempt at surging. It lost the $2,600 barrier but rebounded at $2,500.

    ETH Will Recover

    The current price mimicked Friday’s. ETH fell further, falling below $2,500 once more but reaching a new low. It gained support at $2,379 after momentarily losing $2,400. The bulls attempted buybacks but were unable to raise prices beyond the opening price, leading to a nearly 4% loss at the close.

    The RSI dropped to 41 on Friday and surged to 46 the next day. Nevertheless, despite the continuous buyback attempts, the average directional index continued falling. According to Bollinger Bands, the altcoin was making significant strides as it got closer to rising over the middle band.

    Nonetheless, after that massive dip, price action showed that the apex altcoin recovered and gained over 10% over the next five days.

    One key highlight happened during the previous intraday session. ETH printed a green candle amid the increasing selloff in the cryptocurrency market. It began the day at $2,638 and dropped slightly to $2,598 before rising again and surpassing the $2,700 mark.

    Indicators are currently negative and show that the downtrend may continue during the first three days of November before significant increases.

  • Crypto Analysis 10/30: BTC, ETH, BNB, SOL

    Crypto Analysis 10/30: BTC, ETH, BNB, SOL

    ETH continues its advances amidst the ongoing stagnant price trend across several cryptocurrencies. The altcoin will look to close with significant gains, will it?

    Nonetheless, altcoins joined ETH in its bullish bid, and MKR is a contender for top gainers. It opened trading at $1,156 but surged after a small decline. The massive spike in buying pressure sent prices higher, and the asset broke above $1,250, peaking at $1,269. Although it sees slight corrections, it is up by over 8%.

    Another on the list is LINK. Despite its utility, some traders made fun of the coin, seeing very little volatility compared to memecoins. Price actions over the last three days show that the bulls are waking up. The coin surged from $11.8 to a high of $12.3 but retraced due to small rejections. Currently up by over 3%, this will mark its third consecutive day of consistent increases.

    The global cryptocurrency market cap is down by over a few percent, having slipped to a low of $2.42 trillion, and trading volume dropped by over 22% in the last 24 hours. Let’s see how some assets performed this week.

    BTC/USD

    Bitcoin maintains its $72k support despite several slips below it over the last 24 hours. The bulls rallied the coin after it dropped to a low of $71,313. Nonetheless, it prints a red candle, meaning it had small losses during this period.

    The latest price actions come after the apex coin edged closer to breaking its all-time high. BTC started the previous intraday session at $69,900 and surged to a high of $73,600, barely $200 away from a fresh ATH. Indicators reacted to those trading actions and hints at the reason for the ongoing price struggles.

    The relative strength index broke above 70 from 65 a few days ago. Trending above 70 meant that Bitcoin was overbought and due for corrections. The ensuing declines are an apparent reason for the drop. Although at $72k, the metric barely reacted, dropping to 69 at the time of writing.

    The Bollinger bands mirror the same sentiment as the previously highlighted metric. During the previous intraday session, BTC surged above the upper band and closed trading above it. The slight decline saw it drop between the middle and upper bands. However, a small hike at this level will result in another breakout.

    Price movement suggests that the bulls are prepping the $72k as critical support in their bid at a new ATH. Nonetheless, the apex coin’s most robust positive barrier is $68k. Failure to defend $70k will guarantee such a slip.

    ETH/USD

    ETH is printing a green candle amidst the growing crypto market selloff. It opened the day at $2,638 but slightly dipped to a low of $2,598 before rebounding and breaking above the $2,700 barrier. Currently trading at $2,656, the altcoin may close the day with no significant price changes.

    Nonetheless, the accumulation and distribution charts point to the reason for the ongoing struggles. The market is declining as selling volume exceeds buying volume, resulting in the bulls’ inability to maintain the surge to the high. The RSI mirrors this trend as it slows its ascent due to the growing selling pressure.

    The moving average convergence divergence prints positive signals amidst the fears of rising selling volume. The 12-day EMA intercepted the 26-day EMA, completing its bullish convergence. The divergence is underway which may spell further increases for the asset.

    ETH will look to continue the surge, and the Bollinger bands show a small room for further uptrend. The upper band sits at $2,744, and a breakout may signal the end of the uphill movement. It has since climbed closer to breaking above the market since it almost retested the lower SMA last week. The previous day’s 3% increase saw the asset edge closer to this bid.

    BNB/USD

    Binance coin is printing a red candle at the time of writing as trading conditions favor the bears, who staged minor selling congestion. It lost $600 in support and dropped to a low of $594 but now trades at $597, indicating an almost 2% drop.

    Indicators are responding to the ongoing selloffs. MACD shows an indecisive interception. The 12-day EMA intercepted the 26-day EMA during the previous intraday session, and a divergence was soon to follow during the current session. However, the histogram associated with the metric displays a barely visible bar, as the ongoing trend may cause a reversal.

    The relative strength index shows the asset succumbing to the growing bearish sentiment as it declines. Currently at 55, the A/D mirrors its movement, dropping as supply increases and the buyers are unable to fully absorb it.

    The Bollinger bands show that BNB briefly surged above the upper band during the previous intraday session. The slight decline saw it drop between the middle and upper band. However, a small hike at this level will result in another breakout.

    The altcoin is exchanging close to its $590 support, and the bulls must defend the mark, as a slip may send it below $580.

    SOL/USD

    Almost all indicators associated with Solana are negative at the time of writing. The reading comes as it dropped from a high of $181 to $173. Although it rebounded, it is down by almost 3% over the last 24 hours.

    The moving average convergence divergence prints a sell signal at the time of writing. The 12-day EMA arches downward as it starts what may become a bearish convergence. If the downtrend continues, it may intercept the 26-day EMA in the coming days. This mirrors the movement of the relative strength index, which dropped from 66 to 61.

    The Bollinger band shows that the altcoin still has room for small surges. However, it retraced following its close interaction with the upper band the previous day, which also explains the reason for the ongoing declines.

    The accumulation and distribution chart shows that the bulls may be exhausted following the previous four-day uptrend.

  • Here is How XRP May Trade After This Critical Breakout

    Here is How XRP May Trade After This Critical Breakout

    XRP has registered massive declines since the start of the week. A closer look at the one-day chart shows it started with notable declines on Monday, following a failed attempt to continue the bullish trend it had on Sunday.

    Although the decline was insignificant, it set the precedent for the rest of the session, as the downtrend continued the next day. It lost the $0.54 support and dropped to a low of $0.52. Following a slight recovery, it lost over 2%. XRP sank lower on Wednesday, breaking below the Bollinger bands but rebounding at $0.51. It lost almost 2% amidst the buybacks.

    Nonetheless, it had one of its most significant single-day declines during the previous intraday session. It opened trading at $0.53 but retraced as the asset saw a substantial rise in selling pressure. The altcoin lost the $0.50 support, hitting a low of $0.48 before rebounding. However, the hike was short-lived, as it ended with losses of almost 6%. ‘

    Several factors contributed to the massive decline. One such is a shift in investors following recent actions by the Ripple CEO. A few weeks ago, he donated over $1 million to Kamala Harris’ campaign, now sparking controversy amongst top players in the crypto space. Many blame him for supporting the candidate against the crypto-favorite Donald Trump.

    Tensions in the Middle East also contributed to the massive declines. The impact of the recent escalation rang through the crypto market as its total valuation dropped by over 3%. It was also responsible for XRP’s massive decline during the previous intraday session.

    However, the dip has set the altcoin up for a possible change in price trajectory.

    Breaking Below the Bollinger Band

    The seventh-largest cryptocurrency recently slipped out of the Bollinger bands. The breakout happened during the previous intraday session, as it lost the $0.50 support and hit a low of $0.48. This is not the first time the asset has dropped below the lower band this week; the first took place on Wednesday.

    The latest event may mean the end of the downtrend. On several occasions, an asset dropping below the lower SMA signifies an impending uptrend, which may play out with XRP.

    Other metrics, like the average directional index and relative strength, support this claim. The ADX is rising as traders are gradually building momentum. A closer look shows that the ongoing trend is occurring amidst the coin’s bearish performance this week.

    RSI was at 33 on Friday but is at 38 now, indicating ongoing buyback attempts by the buyers. Data from the Cryptocurrenciestowatch price tracker shows that the asset slightly increased in trading volume over the last 24 hours.

    However, the moving average convergence divergence still prints sell signals. It is yet to recover from its previous bearish divergence as the 12-day EMA continues downwards and shows no hints of halting its downhill movement.

    When Will XRP Recover?

    The recovery is underway, as the top asset is on its second consecutive green. Although not massive, the small gains see it gradually resume trading inside the Bollinger band. It will look to continue the trend after gaining over 2% during the previous intraday session.

    Although starting off slow, further increases in trading volume may send the price above the first pivot support at $0.52. The Fibonacci retracement level supports this claim as XRP previously bounced off the 78% retracement level and continues upwards until it flips the 61%.

    Previous price movement shows that the key to retesting $0.56 is regaining control above the S1. The altcoin traded between the mark and the $0.54 barrier before breaking out.

    Other crypto assets may also resume their uptrend following Friday’s decline. However, unlike two weeks ago, there will be no significant push this month.