
Bitcoin marks its second day of no notable price change. It has slipped from $110,292 and is currently trading at $108,884 at the time of writing.
Its current price shows a slight recovery from its low. However, the asset retraced to the same level from which it rebounded on Tuesday.
Indicators on the 2-hour chart suggest that the apex coin may return to its opening price as it did during the previous intraday session. MACD displays a bearish divergence as the average directional index dips lower.
However, a fresh wave of fundamentals may alter this prediction. Key economic indicators dropped a few hours ago. The consumer price index came in at 0.1%, lower than April and lower than expected. The CPI for May 2025 is slightly higher than that of the previous year but lower than expected.
The month-on-month basis shows decreasing odds of inflation as the US economy improves. Traders expected this news to cause a massive rally, but current price action reveals the opposite.
Nonetheless, data from Santiment indicates a significant shift in retail sentiment. The platform noted that the coin is seeing a massive increase in positive comments compared to negative comments across social media.
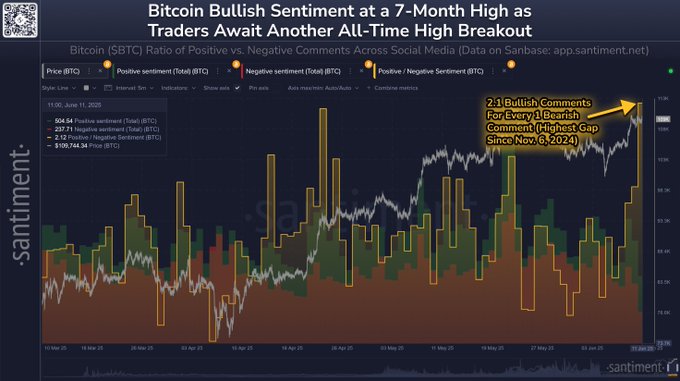
The chart above reveals several correlations between this event and price. In most instances, it precedes a massive price surge. The pattern may repeat itself, sending BTC to a new all-time high.
The Bitcoin Network attained a new milestone on Tuesday. It achieved 900,000 blocks mined and 6,000 days, the longest unbroken cryptographic transaction chain in history. This means that “each new page of data secures to all that came before, driving the cost of any rewrite forever higher.”
Bitcoin Retail Remains Neutral
Retailers are yet to start a buying frenzy amid the positive rhetoric across social media. Data from CryptoQuant indicates that spot retail activity is currently neutral. Other metrics related to the spot market, such as the average order size and volume bubble, remain normal, indicating no impending surges.
Bitcoin is reduced buying pressure from the US as the Coinbase Premium index dips. It is experiencing a notable increase in selling pressure in South Korea, as indicated by the Korea Premium.
However, retailers are picking up on the derivatives market. The Futures retail activity reveals massive participation from the small bag holders. Futures average order size shows that most of the orders are from this faction.
Nonetheless, exchanges are seeing notable outflow, which outweighs the inflows. As a result, exchange reserves are declining.
On the other hand, the open interest and funding rates have dropped slightly over the last 24 hours. The taker buy-sell ratio slipped below 1 as the bears became dominant.
ADX Hints at Further Decline
The one-day chart shows some sell signals. The average directional index is on the decline as the bearish dominance worsens. It indicates further price declines in the days to come. The relative strength index supports this claim as it dips in response to the growing selling pressure.
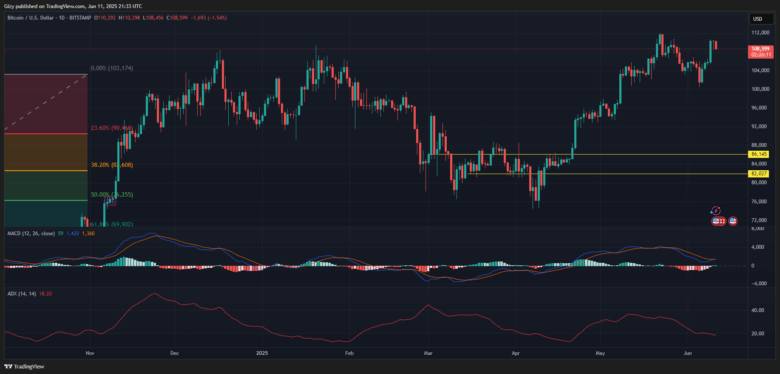
Previous price movements suggest that Bitcoin may drop as low as $ 106,000 if the bulls fail to stage a rebound. Nonetheless, it may rebound and retest $112k as it has held onto $108k for the last two days.
Find Cryptocurrencies to Watch and Read Crypto News on the Go Follow CryptosToWatch on X (Twitter) Now
