LINK, at the time of this press release, is experiencing another massive decline. As of the time of writing, it is experiencing significant losses that are nearly identical to those seen on Monday.
The latest data released shows that the coin experienced a significant 96% increase in trading volume over the past 24 hours. Nonetheless, the recent prices show that the majority of the volume is from sellers.
The global cryptocurrency market is valued at $3.74 trillion, which is nearly 3% lower than its opening value. Nonetheless, just like LINK, the sector has experienced a significant increase in trading volume.
At the time of writing, the cryptocurrency market is experiencing high retracements. Many top altcoins are struggling with high selling pressure, while market activity indicates a significant surge in volume.
Despite minor bouncebacks, the broader sentiment remains unstable as traders respond to both technical factors and macroeconomic developments.
PYTH is one of the coins struggling under notable selling pressure. On Thursday, it garnered more than 100%, and on Friday, it tried to maintain the uptrend. As a result, it hit a peak of $0.25 but bounced back, dropping to a low of $0.20. Additionally, the asset is selling over 4% lower than it started the day.
As for the basics, this is the reason the market is bleeding. The United States President, Donald Trump, recently announced the new tariffs. Traders were not pleased with this latest development, as this resulted in panic across different sectors.
At the time of writing, the cryptocurrency market is experiencing a minor rebound. Let’s examine how some of the leading 20 coins will respond in the days to come.
LINK/USD
On Friday, LINK started at $25.10 but bounced back to $25.40 and is currently selling at $25.40. Over the past 11 hours, the decrease has been nearly 7%. Nonetheless, it cleared the past day’s profits and edged closer to incurring a similar number of losses as it did on Monday.
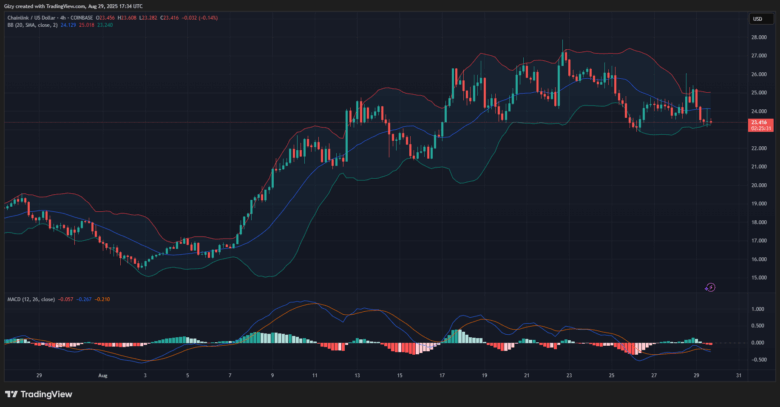
The charts on the four-hour timeframe indicate that the asset has not yet printed any green since the day began. However, the recent candle gives a faint ray of hope that the increase may likely come to an end soon. Although red, it has a wick sticking out, indicating some buying pressure.
The Bollinger Bands indicate that Chainlink, after it tested the lower band, bounced back. This is actually not the first time the coin has bounced back around this number. In the past events, the asset surged to much greater levels. If it happens again, LINK may increase closer to $25.
Nonetheless, this does not eliminate the possibility that it may decline further. Following its bearish divergence, the MACD is printing sell signals. The past price movement indicates a significant drop to $21.50 if the decline remains constant.
HYPE/USD
Hyperliquid is going into three consecutive days of decline. On Thursday, the coin lost more than 3% and has recently been edging closer to a repeat of its previous decline.
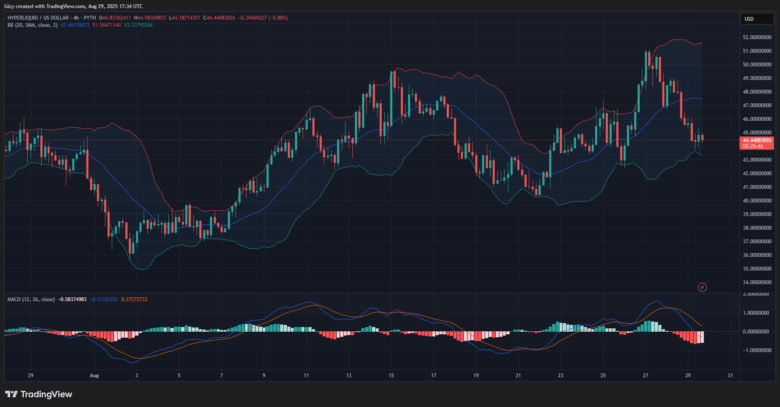
The asset has gone down by over 2% on the 1-day scale but shows signs of recovery.
The 4-hour chart timeframe indicates that the altcoin bounced back a few minutes ago. As of the current session, the Bollinger band suggests that the recovery may continue, as the coin has found support at the lower band.
An event similar to this occurred on Monday, and HYPE saw significant increases afterward. If this trend persists, the coin is likely to increase and edge closer to the middle band at $47.5. It is worth noting that the $47 resistance currently serves as the launchpad to test $50.
Additionally, the past movement supports the prediction of a further uptrend, as the bounce bank took place around the $44 and $43 trading levels. Rebounds at this level were strong; the same may happen this time.
SUI/USD
SUI has cleared the profits it gained on Thursday, as it dropped by nearly 6% on Friday. According to the 4-hour chart, the data indicate that since its inception on Friday, the trend has remained in a downtrend.
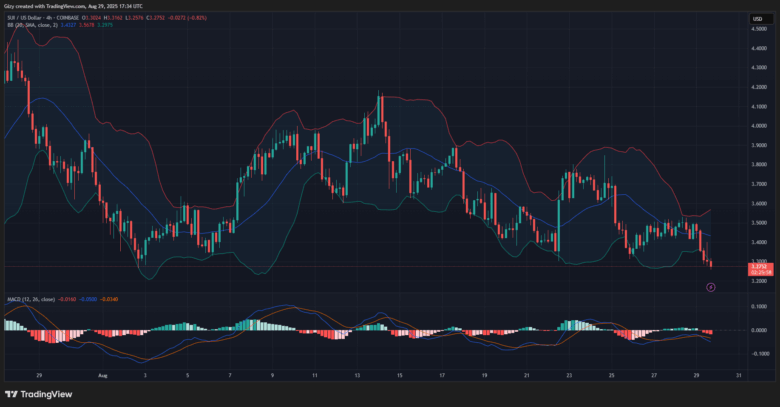
The asset fell below the Bollinger band in the session starting at 8:00 UTC and has since maintained trading below, despite attempts to recover.
However, the past candle shows a glimpse of light as SUI hit a peak of $3.40. Nonetheless, the asset has bounced off the same support level thrice, indicating that it is currently selling at a demand zone. This may likely spur future increases.
XLM/USD
Stellar began the day at $0.382 but has since declined and is currently selling at $0.354. The 4-hour chart indicates that the asset has not seen any notable surge, as every attempt to buy back finished with a slight decline.
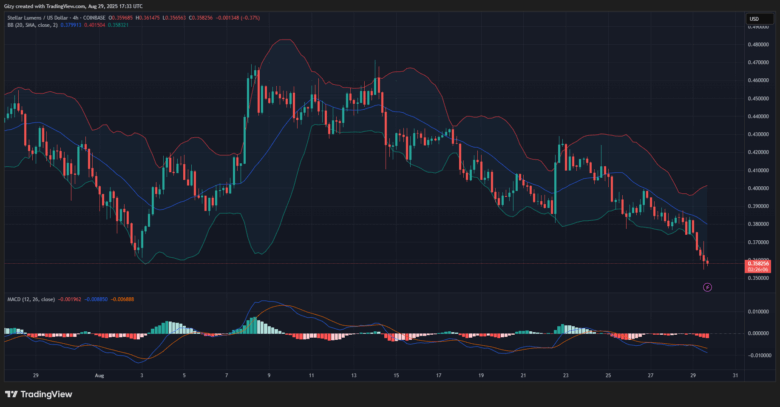
Just like the LINK token, as of the time of writing, the coin rebounded and is currently experiencing a little increase. The passing candle shows that it found support at $0.355. The last time it tested this mark was on August 2, and it experienced notable surges afterwards. Massive increases afterwards.
XLM may surge higher, getting back to the $0.380 mark in the coming days. Nonetheless, future declines will send prices as low as $0.34
BCH/USD
Bitcoin Cash has recorded a 3% loss since the beginning of the day. It started at $557 and hit a high of $560, but it is now trading at $537. It printed a doji on the 4-hour chart timeframe at the press release. Hitting a peak at $539 after starting at $534, then retracing to a low of $533.
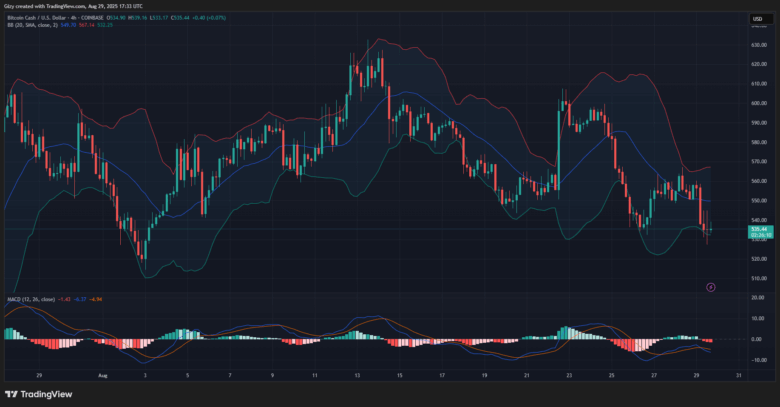
BCH is experiencing a minor surge at the time of writing. The past candle is one of the longest on the chart, showing that the coin has rebounded. With buybacks in view, the coin may continue to rise upwards.
Nevertheless, past price movements show that it will see rejection at $545. However, it is important to note that the coin is recording a higher low, and it bounced off Bollinger’s lower band. This may trigger future uptrends for the asset to $560.
Bitcoin Cash is modestly increasing at the time of writing, suggesting that dip buyers may be re-entering the market. The long candle before the rebound showed demand close to the lower boundary of the Bollinger Bands.
AVAX/USD
Today, AVAX saw a decline in trading volume and has recently experienced a 5% loss. The 4-hour chart shows that the price dipped to a low of $23.30, then bounced back and attempted to surge higher, but only a minor significant change was observed.
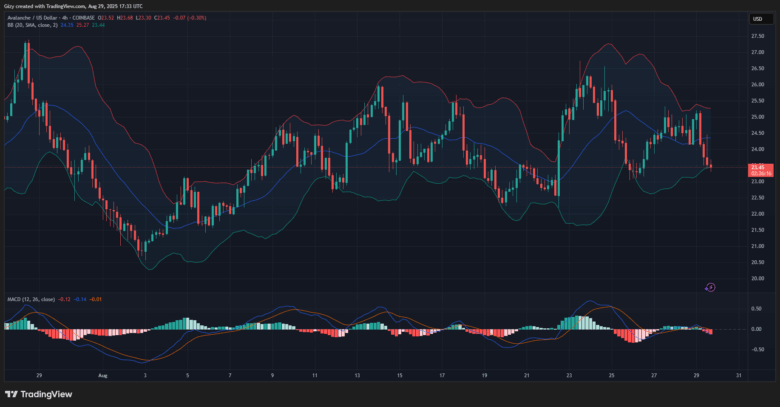
The chart explains that Avalanche bounced back shortly after dipping lower a few minutes ago. Nonetheless, it is essential to note that the bounce occurred around a demand zone; however, past price movements suggest that the uptick may be temporary.
Avalanche may continue its downtrend, dropping to a stronger level around $23.
HBAR/USD
HBAR began the day at $0.239. It has recently faced a significant downtrend in trading activity, having lost 5% since the start of the day. The 4-hour chart shows that it did not record any significant surge.
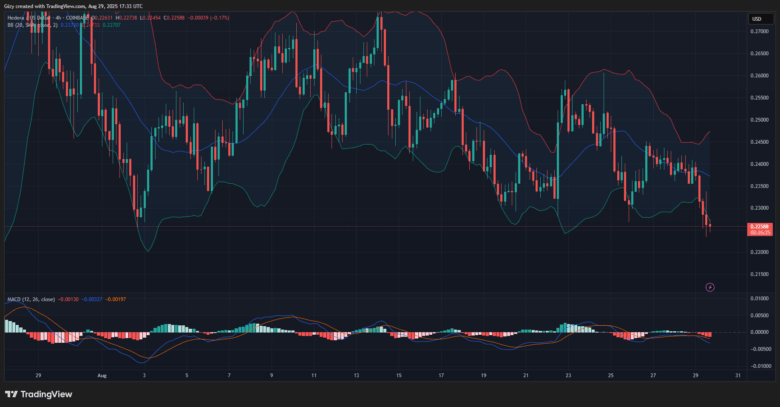
However, Hedera is fast approaching its previous low as its minor uptick fades out. It is essential to note that the coin reached its lowest value in August and is now at a critical juncture. Failure to hold this key level will send it back to $0.21.
Nonetheless, a further bounce back to this level would see a notable increase above $0.235.
Find Cryptocurrencies to Watch and Read Crypto News on the Go Follow CryptosToWatch on X (Twitter) Now

