
SOL was off to a good start on Monday. The coin saw a notable increase during this period. Data from CoinMarketCap suggests that the increases were due to high trading volume.
SOL was one of the top gainers over the last seven days. However, data showed that it experienced massive losses on Wednesday and Thursday. The losses were not isolated, as other cryptocurrencies registered a similar output.
The global cryptocurrency market cap has decreased slightly over the last 24 hours. The slight increase is due to a sudden rise and selling pressure. Nonetheless, recent data from TradingView shows that the market is seeing peak buying activity.
The relative strength index has returned above 70, indicating that several cryptocurrencies are currently overbought. It may indicate an impending trend reversal that may result in massive declines over the next six days.
Nonetheless, several altcoins were on the rise on Monday. One such is Pancakeswap. It opened trading at $3.08 and surged to a high of $3.31. Although it experiences a slight retracement, it remains up by over 5%.
Optimism is heading for another massive gain. It opened at $0.74 and surged following news of its listing on Upbit. The token peaked at $0.872 and is up by 14%.
Monday is kicking off with mixed reactions from traders. Let’s examine how some coins in the top 10 will play out.
BTC/USD
BTC saw slight increases over the last two days and edged closer to testing the $120k resistance. A closer look at the 1-day shows that it consolidated for most of the previous week.
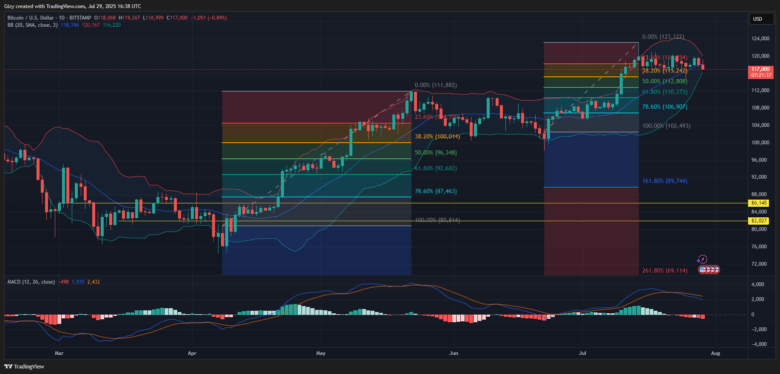
The asset is showing no signs of an impending breakout. It’s slightly down following its failed attempt at the highlighted barrier. The coin may be heading for a bearish start as data from CryptoQuant shows notable selloff from Coinbase and the Korea premium index.
Indicators on the one-day chart point to an impending massive dip. It is worth noting that the asset had a bearish divergence last week, and the MACD’s 12 EMA continues downward.
The Fibonacci retracement level points to a decline to the 38% fib mark. Previous price movements support this prediction as BTC dropped to a low of $114,518. Further slip will send it as low as $112k.
ETH/USD
Ethereum surged to a high of $3,941 a few hours ago but experienced a massive rejection of its bid at $4,000. The asset trades at its opening price as a result of the ensuing selloff.
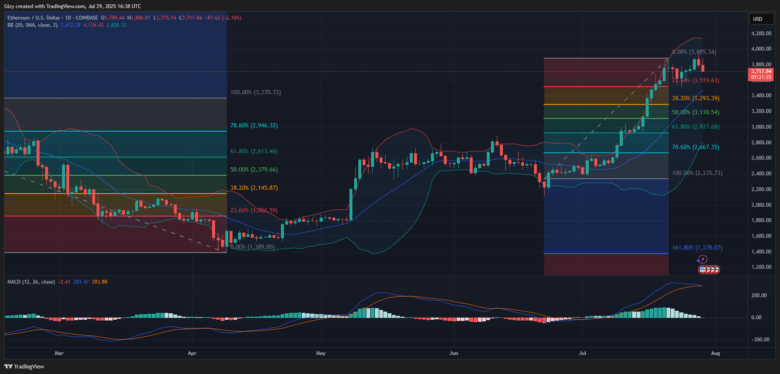
It continues the previous day’s uptick that saw it gain over 3%. However, indicators are blaring warnings about following price actions. One such is the moving average convergence divergence. A closer look at the indicator reveals that the 12 EMA is closing the gap with the 26 EMA. The latest movements may indicate an ongoing bearish convergence.
It is also worth noting that the relative strength index is above 70. Currently at 81, the asset remains overbought. With both indicators pointing to a massive downtrend, the Fibonacci retracement level suggests a drop to $3500.
However, the clamor for a return to $4,000 remains high, which may suggest that the assets may break above this key level before retracing.
XRP/USD
XRP had a slight increase at the start of the previous intraday session but lost momentum and closed with losses exceeding 3%.
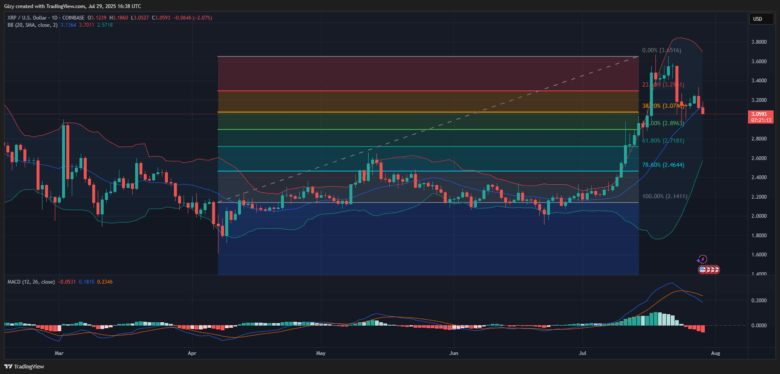
The asset is off to a good start on Tuesday. It rebounded after a slight decline and is slightly up at the time of writing. A closer look at the chart indicates that the asset bounced off the 38% fib level. The metric hints at an attempt at the 23% fib level if the bulls sustain the uptick.
However, the MACD is yet to react to the ongoing price decline. The 12 EMA continues a downtrend, with the 26 EMA trailing behind it. Nonetheless, RSI is slightly up in response to the latest increases in buying pressure.
BNB/USD
Binance coin registered a new all-time high on Monday. It opened trading at $844 and surged to a high of $861. However, it lost momentum and retraced, losing over 2%.
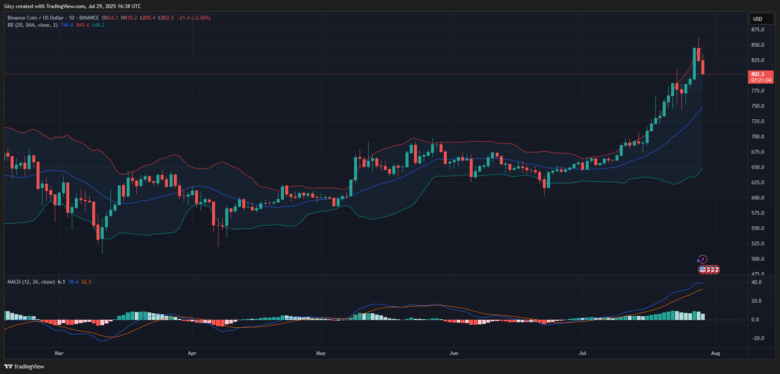
The coin prints a doji as it slightly retraced but rebounded and trades at $829. Indicators continue to blare warnings, with RSI being above 70. The metric suggests that the asset is overbought and due for corrections.
BNB retraced on Monday after breaking above its Bollinger band. Previous price movement suggests a 5% plummet, following this trend. This will result in a drop to $800 from its current price.
Data from CoinMarketCap indicates a drop in trading volume. It may also reveal a growing exhaustion among the bulls.
SOL/USD
SOL surged to a high of $195 on Monday but faced massive rejection, causing a dip to $182. The coin ended the intraday session with losses of almost 3%.
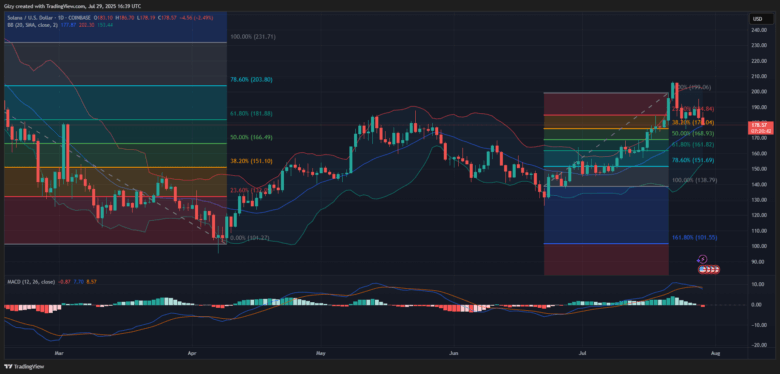
The current price indicates a growing attempt at resuscitating the uptrend. However, the coin slipped lower a few hours ago, then rebounded and is now trading slightly above its opening price.
SOL is close to Bollinger’s lower band, indicating a high likelihood of an uptick. The relative strength index is at 57, showing room for further increases. The asset will look to break above the 23% fib level and retest the $195 barrier.
DOGE/USD
Like SOL, DOGE had a massive correction on Monday. It retraced from a high of $0.24 to $0.22 and closed with losses exceeding 6%.
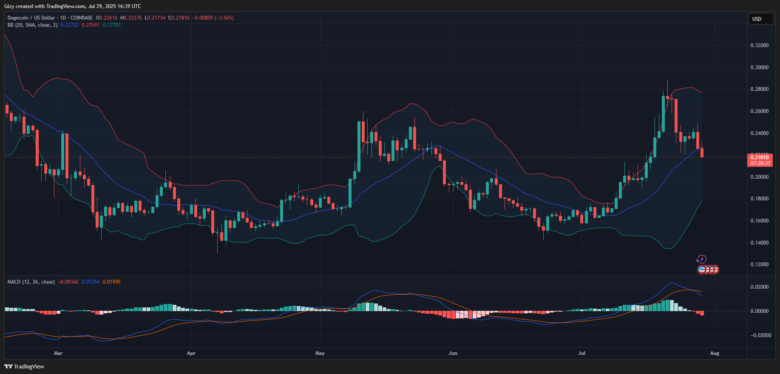
The coin prints a doji at the time of writing, as indicators are pointing to a huge chance of recovery. It is worth noting that the assets slipped below Bollinger’s SMA but rebounded and trades above the metric.
The relative strength index trends at 54, a slight improvement from the previous day’s reading. Further data from CoinMarketCap shows a 4% increase in trading volume, suggesting the inflow of fresh liquidity.
ADA/USD
ADA was not exempt from the losses most cryptocurrencies had on Monday. Like SOL, it rose to its highest price in the last four days but retraced to a low of $0.78 and closed with losses of almost 5%.
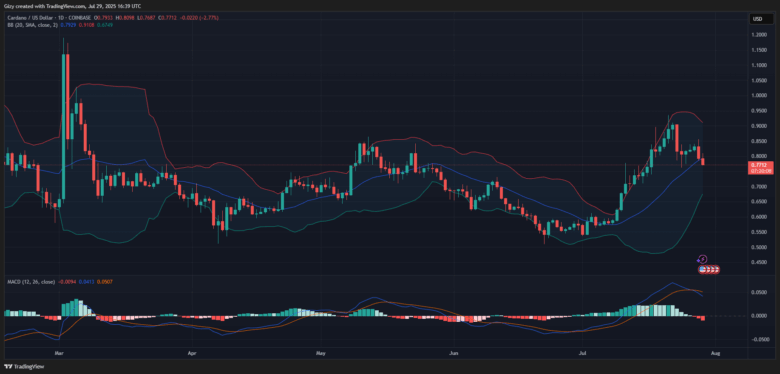
Data from CoinMarketCap shows a slight increase in trading volume. The current price indicates a small rise in buying pressure, and RSI increased by 1 point in response to this trend.
Previous price movement suggests that if the bull sustains the current uptick, the asset will retest $0.85.
Find Cryptocurrencies to Watch and Read Crypto News on the Go Follow CryptosToWatch on X (Twitter) Now
