SOL is heading closer to breaking above another critical mark at the time of writing. The altcoin has experienced massive liquidity inflows, as evidenced by data from DeFiLlama, which shows a significant spike in TVL.
The coin’s latest increase sparks a statement that the altseason is here. SOL is the best performer in the top 10, while Bitcoin struggles with reduced interest from investors.
The global cryptocurrency market cap is at $3.84 trillion. The altcoins market cap is moving fast as several assets contribute to the gains. One such is PENGU. It gained over 15% in the last 24 hours, adding to its tally of more than 650% in the last 90 days.
Kaspa follows closely behind with more than 12%. It also enjoyed a significant spike in trading volume during this period.
Fundamentals are positive, with news of new companies adopting cryptocurrency. However, none of these announcements is enough to cause a massive shift in the market.
Several major assets are seeing massive exchange inflows. They are grappling with notable selling pressure and have yet to make any significant leap since the day started.
Nonetheless, trading volume is significantly higher at the time of writing compared to the previous day. Current price action across several crypto assets suggests a notable amount of selling. How will it affect some coins in the top 20?
BTC/USD
BTC surged to a high of $119,682 on Monday, but retraced due to notable rejections. The apex coin continues its trend of failing to decisively flip the $120k resistance. The current day will mark its sixth day of closing below the mark.
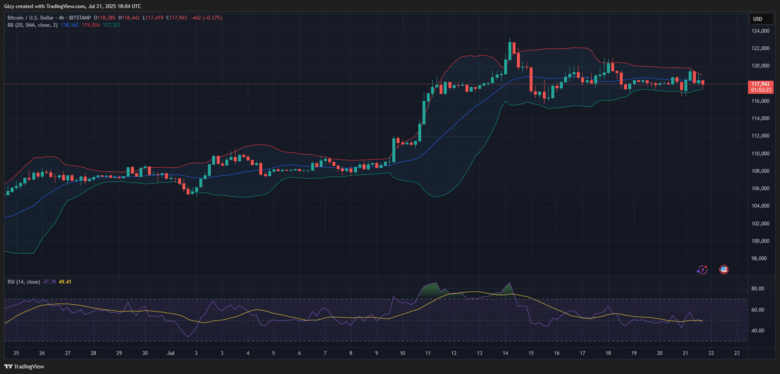
Nonetheless, the 1-day chart indicates that the consolidation may continue. However, indicators on the 4-hour chart point to an impending breakout. The bollinger bands are constricting at the time of writing. It means that the sideways trend may end in the coming hours.
The relative strength index indicates that the asset has experienced almost equal volume over the last 8 hours. While this offers little to no insight into the direction of the breakout, bollinger bands on the 1-day chart suggest an impending decline to the middle band. It may result in a drop to $114k.
ETH/USD
ETH is struggling to keep prices above its opening price. However, recent price movement indicates that it is struggling to maintain its uptick as it prints a doji on the 1-day chart. The altcoin retraced after testing the bollinger bands on this scale.
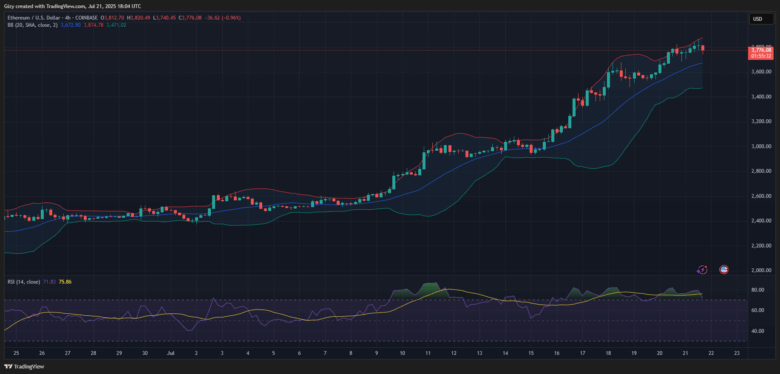
Failure to resume buying pressure will result in the coin retracing lower. The relative strength index is at 87, supporting predictions of further declines.
Nonetheless, the 4-hour chart points to its next price level. It is worth noting that Ether is also overbought on this scale and has faced notable retracements after testing the upper band. The asset will drop to the middle band, as seen on several occasions.
ETH will drop to a low of $3,675 in the coming hours. However, the bulls must defend this mark as the altcoin risks further declines and downtrends. Slipping below the mark will cause it to drop close to the lower band, around $3,470.
XRP/USD
XRP continues the previous day’s uptrend, gaining over 4% on Monday. The asset trades slightly lower than its high and may see further declines. It opened the session at $3.45 and surged to a high of $3.65 after a slight decline.
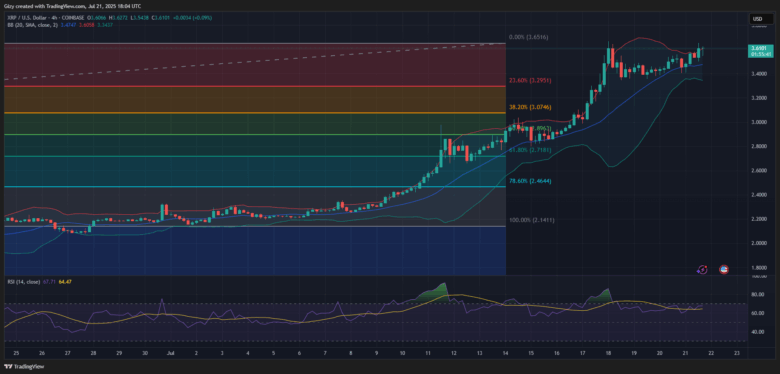
The 4-hour chart reveals the reason for the correction, noting that the altcoin may dip lower. The declines started after it broke out of its bollinger bands. It currently trades above the metric at the time of writing, indicating that it is not out of danger.
XRP may retrace to the bollinger bands around $3.47. However, the bulls may stage a buyback at $3.50.
BNB/USD
Binance Coin registers yet another milestone. It opened Monday at $757 and retraced to a low of $746 but rebounded and surged. It broke above its previous high around $765, surging to a new high. The altcoin broke above $780, reaching a peak of $782.
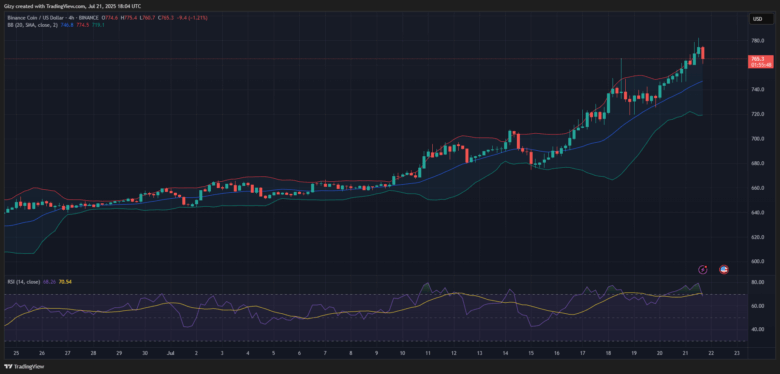
The asset trades at $766 at the time of writing. However, indicators on the 4-hour chart suggest further retracement. It prints the first red candle after two consecutive greens. Nonetheless, it rebounded at a support it held over the last 20 hours.
The bulls may use this level as a launchpad for further increases, as they have done before. However, BNB retraced after testing its bollinger band. Its next price destination may be around the middle band.
SOL/USD
The 1-day chart indicates that SOL is experiencing one of its most significant upticks. It opened the session at $181 and surged after a slight decline. It is above its previous high of around $184 and continues upward, flipping $190. The asset faced notable rejections at $199, halting its bid at $200.
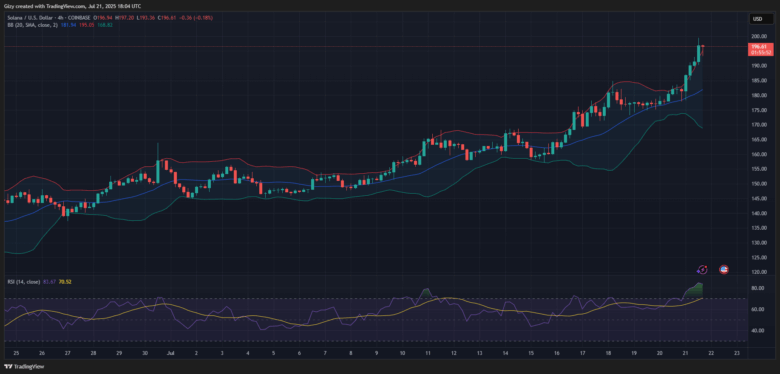
A look at the bollinger bands on the 4-hour chart indicates that SOL printed its last two candles above the upper band. The coin retraced abelow the metric the previous time this happened. A repeat may be underway as the RSI indicates a slight increase in selling pressure.
DOGE/USD
Like SOL, Dogecoin registered a new high. It rebounded from its dip to $0.264 and surged to a high of $0.287. The bulls are struggling to continue the momentum but are not holding it for long.
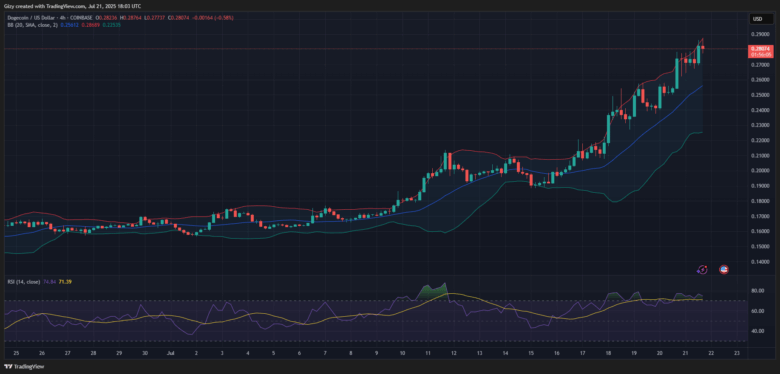
The 4-hour chart shows that the asset is overbought. RSI is at 77, indicating that it is due for corrections. The metric rose slightly following the recent attempt to continue the uptrend.
However, it is worth noting that the memecoin retraced after testing the bollinger bands. It prints a doji at the time of writing, indicating further corrections. Previous price movements point to notable demand concentration around $0.264.
ADA/USD
Cardano is experiencing a similar surge to SOL, as it has surged to its highest value in months. It opened trading at $0.85 and dropped to a low of $0.8 4 before surging. It broke its previous high of around $0.89 and peaked at $0.93.
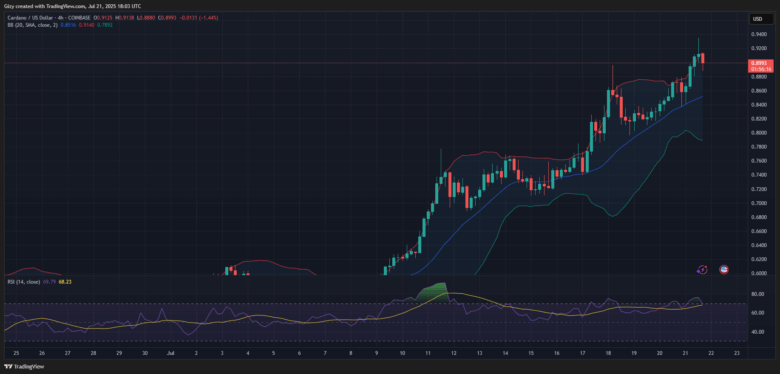
The 4-hour chart suggests further retracement as it prints its first red candle after four consecutive green candles. RSI is at 70, indicating that it is due for corrections. Previous price movements point to notable demand concentration around $0.88. The level may be its next price target.
Find Cryptocurrencies to Watch and Read Crypto News on the Go Follow CryptosToWatch on X (Twitter) Now
