BNB has been in decline since it reached a new all-time high on Friday. It surged from $840 to $900, ending the session with gains exceeding 7%.
However, the next three days were marked by a massive decline, as it lost over 7% and erased Friday’s gains. Trading conditions at the time of writing indicate uncertainty, as the trading volume remains unchanged over the last 24 hours.
The entire crypto market is seeing a similar trend to BNB. There has been no significant change in value since the day started, and volume remains low. This could be due to the lack of liquidity flowing into the market, which may indicate a drop in interest.
Investors are showing huge uncertainty following the retracements of the previous day. The Fear and Greed Index dropped to 43 on Tuesday, its lowest level in the past 30 days. The calls for alt season have significantly diminished as the Altcoin Season Index drops to 44.
Traders may blame the sluggish recovery on the lack of huge fundamentals that could spark massive rallies. Nonetheless, some of the top gainers in the top 100 include CRO, which has gained over 22%, and BGB, which is up by a little more than 2%.
While many crypto assets see slight increases, others are almost stagnant. Let’s see how some coins in the Top 10 are performing.
BTC/USD
BTC opened Monday at $113,491 but retraced to a low of $109,283. Although it saw a slight recovery, it ended the session with losses of almost 3%.
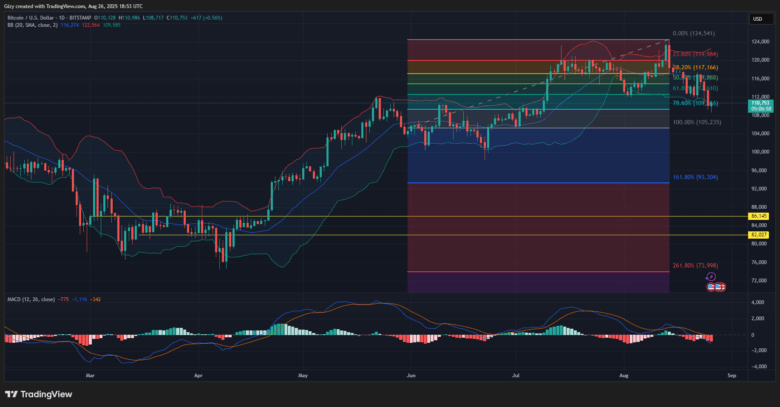
The bulls were unable to continue the buyback as the asset experienced another significant pullback on Tuesday. It dropped to a low of 108,717 but rebounded. However, it currently trades at its opening prices as it loses momentum yet again.
The apex coin is experiencing a more than 7% decline in trading volume at the time of writing, suggesting a decline in interest in it. The latest drop also coincides with the inability to surge. Nonetheless, indicators are currently printing sell signals.
A closer look at the 1-day chart reveals that the asset is trading at bollinger’s lower band. It dropped below the mark on Monday and repeated the same trend a few hours ago. Previous price movement indicates that BTC continues its trend of trading between the middle and lower bands.
However, the moving average convergence divergence had a bearish crossover a few days ago. The metric is on a downward trend as selling pressure increases. Its latest readings suggest no signs of an impending change.
ETH/USD
Ethereum is seeing notable buying pressure at the time of writing. It trades a few percent higher than its opening price. However, the coin tested the $4,300 mark again on Tuesday, dropping to a low of $4,311.
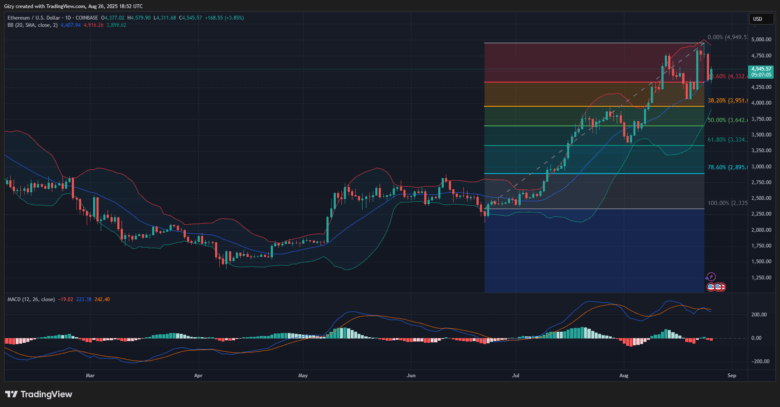
The latest increase represents a notable improvement from the previous day’s downtrend, which resulted in an 8% loss for the asset. The altcoin dropped to a level not seen in the last three and shocked many as the decline followed its all-time high.
However, indicators are yet to react to the ongoing hike. MACD continues its descent following the bearish divergence it exhibited the previous day. Nonetheless, the asset retraced below bollinger’s middle band earlier. It trades above the mark at the time of writing.
The fibonacci retracement level suggests that prices should remain above the 23% mark, as there is notable demand concentration at this level. The metric warns of massive corrections if ETH fails to meet the mark.
XRP/USD
XRP is experiencing a similar trend to BNB. The coin experienced its third consecutive day of a consistent downtrend on Monday. It retraced from $3.02 to $2.82 and closed with losses exceeding 5%.
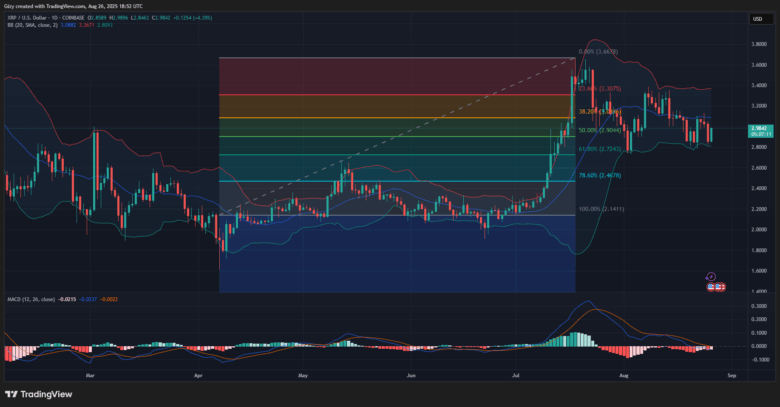
However, it trades at $2.92 at the time of writing, suggesting that the bulls are currently staging a successful buyback. The altcoin has gained 2% since the start of the day, and the fact that it trades at its high indicates that it is sustaining the momentum.
Nonetheless, the latest change in value barely affected indicators. MACD continues its downtrend after its divergence a few days ago. It is worth noting that the 12 EMA has been trending at its lowest level over the last two months.
Since August 18, the altcoin has bounced between bollinger’s lower and middle bands. The current price suggests that it may reclaim the SMA if the bulls sustain the momentum, continuing the trend. Moreover, it is worth noting that the coin retested the lower band on Monday.
BNB/USD
BNB is on the verge of erasing more than half the losses it incurred during the previous day. It trades at $854 after recovering from another massive drop earlier. The altcoin retraced to a low of $830 but rebounded, printing a green candle.
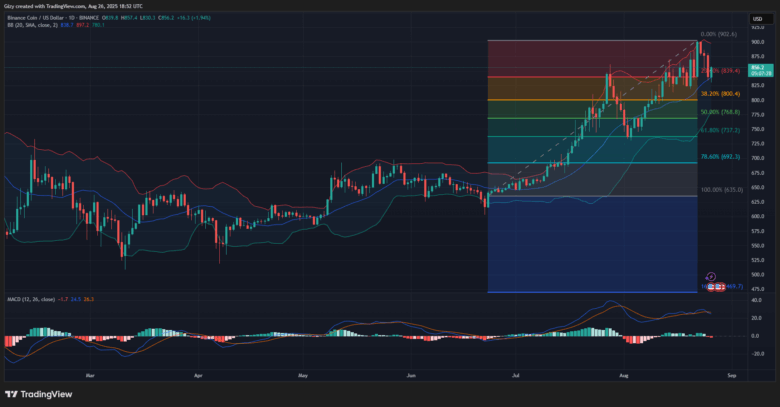
The altcoin was up by almost 2% on Tuesday. It is looking to reclaim lost levels, having retraced from $879 to $833 on Monday. Nonetheless, a closer look at trading action over the last three days reveals that the coin erased its gains from Friday during this period.
Currently, indicators are yet to react to the latest change in trajectory, suggesting that the bears still maintain sizable control over the market. MACD is in a downtrend following its bearish crossover the previous day.
Nonetheless, BNB reclaimed the 23% fib level after losing it earlier. The fibonacci retracement levels suggest that the altcoin is trading above a level with notable demand concentration, and the previous price movement supports this assertion.
SOL/USD
Similar to BNB, SOL is experiencing notable increases at the time of writing. It surged to a high of $194 for the first time in the last 24 hours after it lost the mark on Monday. The coin is up by over 4% on Tuesday as recovery continues.
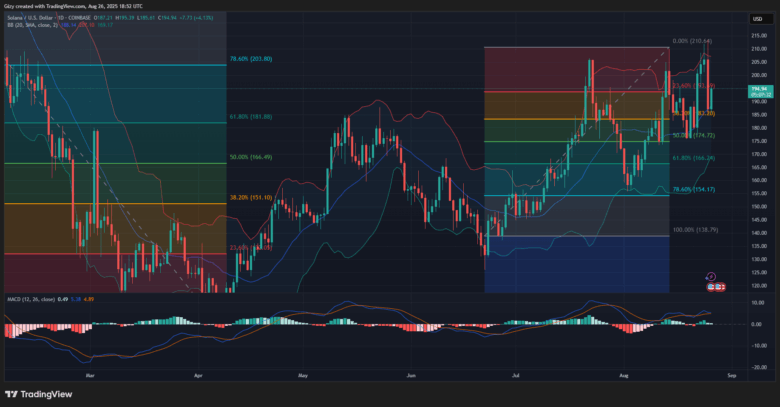
The previous day was one that many will not easily forget as SOL registered notable losses. It opened the session at $205 but surged to a high of $213. However, it experienced a trend reversal, causing prices to plummet to a low of $185.
Nonetheless, current readings from indicators suggest that the recent hike may mark the end of the downtrend. MACD’s 12 EMA was heading for a bearish convergence on Monday but halted its advances and is now trending sideways. Its latest change may indicate that the bulls are staging more buybacks.
Additionally, the bollinger bands show that the asset rebounded after it briefly broke below the middle band.
Find Cryptocurrencies to Watch and Read Crypto News on the Go Follow CryptosToWatch on X (Twitter) Now

