
SOL continues its upward trend over the past six days, edging toward breaking new levels. The altcoin garnered significant attention, as evidenced by its substantial trading volume.
Readings from the volume chart showed the asset had one of its biggest runs on Friday. Buying and selling activity peaked at its highest level in the last seven days.
SOL is rising again. However, the uptick is not peculiar to it. The global cryptocurrency market is experiencing a notable surge in volume over the last 24 hours. The improvement is reflected in the market cap, which increased by over 2%.
While fundamentals played a huge role in how prices performed over the last six days, the weekend surge lacks the same backing. Several altcoins are on the rise, breaking new levels.
The biggest mover in the last 24 hours is Conflux. It is mostly silent for most of the week. However, momentum picked up on Sunday. It surged from $0.10 to $0.22 but faces a notable correction at the time of writing. Nonetheless, it has increased by over 90%.
Tezos is seeing another massive surge. It continues upward after its enormous 48% increase on Saturday. It peaked at $1.22 a few hours ago but is now trading significantly lower.
The last six days were marked by significant volatility for several top-10 assets. Let’s examine their performance.
BTC/USD
The 1-week chart shows Bitcoin printing a red candle. It will be its first after three weeks of consistent uptrend.
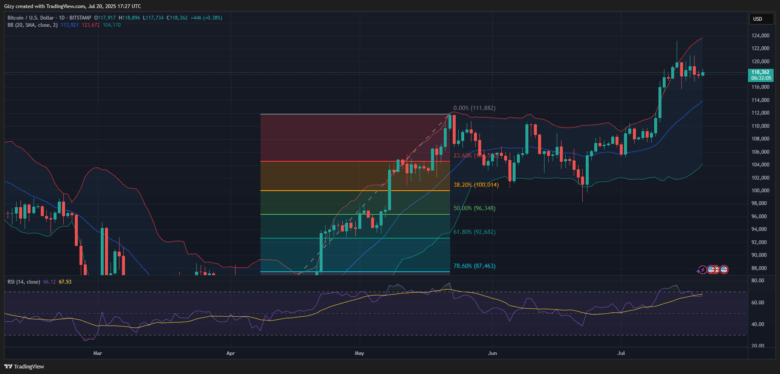
Nonetheless, trading action on Sunday may alter the current trajectory. Although not significantly up, the apex coin is edging closer to reclaiming $119k after losing it on Friday.
BTC failed to surge following its actions on Monday. It opened the session at $119,140 and surged to a high of $123,236. It retraced as selling pressure mounted and closed around $118k.
Price action on the first day of the week set the tune for how prices played out. The largest coin failed to close any intraday session above $120k afterwards.
The bollinger bands indicate that the asset broke out last Sunday and continued the trend the next day. Traditionally, the breakout signals an impending end to an uptrend. Subsequent price action proved the trend true as the apex coin returned below the upper band the next day and has since failed to retest it.
It is also worth noting that BTC was overbought on the first day of the week. It experienced notable selling congestion, which brought the metric below 70.
ETH/USD
Ethereum is on the verge of registering its most bullish week after more than two months. It continued its uptrend, which started during the last week of June. The seven-day session will mark the fourth consecutive green.
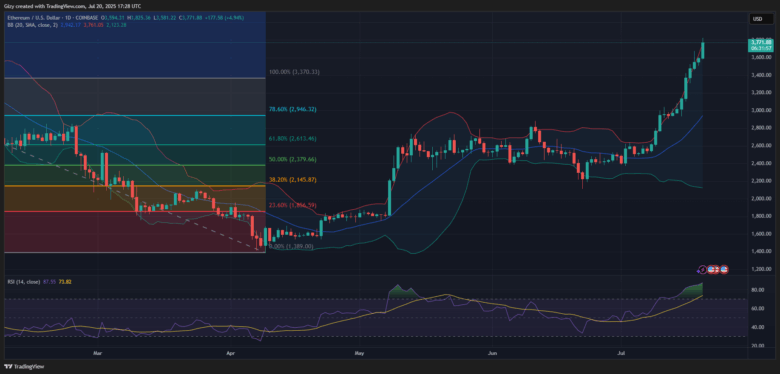
Up by over 27% on a weekly scale, the asset is looking to add more to its tally. It started at $3,594 on Sunday and surged, breaking above $3,800. The asset is up by more than 5% since the start of the day and shows no signs of halting its uptrend.
ETH is currently printing its second-largest green candle of the week, following Wednesday’s price action. The apex altcoin gained a whopping 7%, breaking above $3,400 for the first time in over five months.
However, RSI is at 87. Its current reading shows that the asset is overbought and has been for most of the last six days. It is worth noting that there is a massive increase in buying pressure, at a rate not seen in years.
XRP/USD
XRP resumes its uptrend after a significant decline on Friday. Nonetheless, the altcoin registered a new all-time high during the session. It peaked at $3.66 but retraced and closed with losses of almost 2%.
Nonetheless, it had another massive hike on Thursday. It opened trading at $3 and surged after a slight decline. It recorded its first milestone, peaking at $3.55.
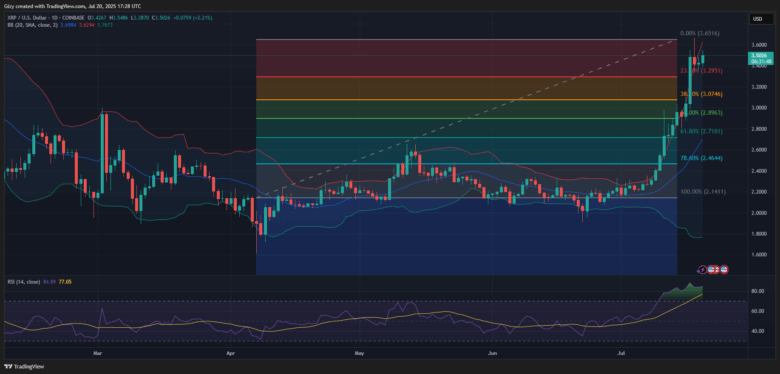
Sunday’s hike kicked off after a slight decline. It trades at $3.52, edging closer to Thursday’s high. XRP is up by almost 3% as it heads for one of its most bullish closes on the weekly scale. It is up by over 24%, marking its fourth consecutive green day.
Nonetheless, RSI was at 83 on Monday and is currently at 85. The buying pressure remained constant during this period, but the asset remains overbought. The bollinger bands reveal that the altcoin broke above it on Thursday but is currently trading below the upper band.
BNB/USD
Binance coin is on the verge of registering its best-performing day of the week. It is up by 2.80% at the time of writing. It surged from $733 to $7856 but trades slightly lower at the time of writing.
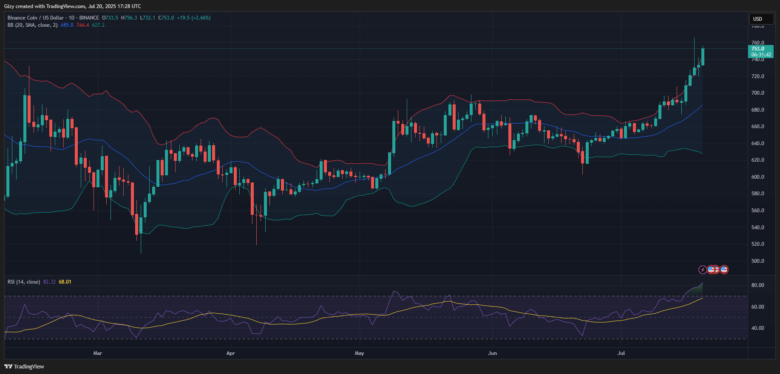
The coin is close to achieving another bullish close following the recent corrections it has undergone. On Friday, it peaked at $765 by failed to sustain the momentum, resulting in a massive correction. Nonetheless, Wednesday was better in terms of results as the asset gained over 2%.
The 1-day chart shows that the BNB had a similar performance to SOL, crushing one resistance after another. However, indicators like RSI and the bollinger bands are at their peak. The relative strength index is at 82, indicating that the asset is overbought.
The BB shows the altcoin trading above it. It broke above the metric a few hours ago.
SOL/USD
SOL is experiencing slight corrections after testing bollinger’s upper band. The 1-day chart shows a slight decline after hitting the mark. Nonetheless, the last day of the week is shaping up to become one of its most bullish.
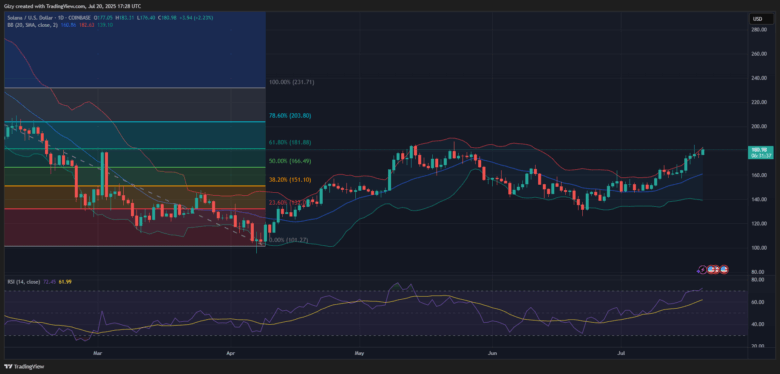
However, the altcoin registered its biggest increase on Wednesday. It opened at $164 and surged to a high of $176 after a slight decline. It gained almost 6% but struggled to continue its uptrend over the next few days.
SOL broke out of its bollinger bands on several occasions, with the latest being on Friday. Nonetheless, it retraced after testing the mark. The same trend is playing out at the time of writing. It is worth noting that the relative strength index is at 72, having broken above 70 a few hours ago.
The 1-week chart indicates that SOL is up by over 12%. A close at the current will see it mark its second week of consistent increases,
Find Cryptocurrencies to Watch and Read Crypto News on the Go Follow CryptosToWatch on X (Twitter) Now
