In the early hours of Friday, Solana showed a positive sign. It indicated a slight recovery from the two-day decline it had experienced previously, thereby reclaiming a key support level.
With this positive sign of SOL continually moving upwards in the past four hours, the coin is expected to continue in that manner. And it may eventually uptick on Saturday, bringing its edges closer to reclaiming other lost levels.
At the time of writing, a recent trend is emerging. While BTC is relatively stagnant, altcoins are seeing massive price movements.
The cryptocurrency market worldwide is experiencing a slight dip, and as a result, trading activities over the past 24 hours have decreased by almost 12%. Nevertheless, investors remain highly optimistic despite the fear and greed index still being at 49, which is considered neutral.
With the majority of positive signs coming in since Friday, which focused on numerous improvements across diverse blockchains, the fundamentals are positive.
For instance, Ethereum experienced a surge in gas fees, which excited many people as it meant the altcoin was gaining more attention.
On the other hand, Pudgy Penguins emerged as the top gainers. It experienced a massive 218% increase in its trading activities, with its price surging by 17%. The fuel for this enormous increase is the news that CBOE filed a 19b-4 to list Canary Capital’s PENGU ETF.
Although, across most cryptocurrencies, Friday came to an end with no notable price shift. Saturday is being looked forward to to see if it will bring a change. Let’s look through possible levels.
BTC/USD
Bitcoin, after another futile attempt to rise beyond the $ 108,000 resistance, ended Friday with a doji. For the majority of the session, it remained below the mark, and this trend is likely to continue on Saturday.
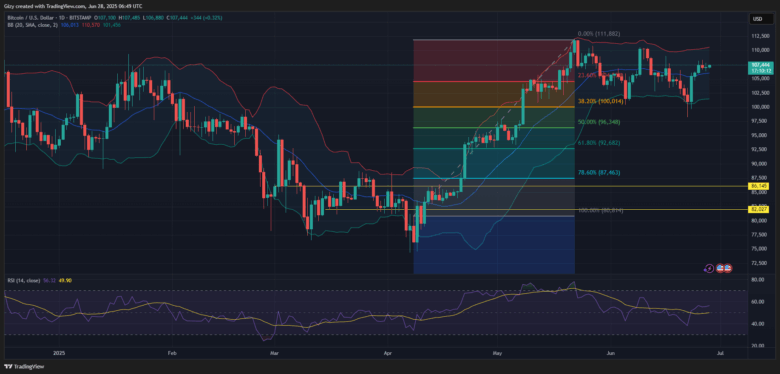
The low response in the trading volume of the coin may be one of the factors hindering its surge. However, it is currently trading beyond $107k, a crucial support level that has been outstanding for the past 48 hours, and this may continue its streak.
The 2-hour chart, as at the time of writing, shows that BTC displays minimal volatility. Nevertheless, the Bollinger Bands are tightening, indicating a potential breakout as they constrict. It is important to note that the restriction began during the intraday session on Friday, but it got worse in the early hours of Saturday
As long as the $107k support remains unmoved, BTC is likely to see more upward movements and thereby break beyond $108k again. However, the demand concentration holds this key level.
ETH/USD
ETH appears less likely to experience a notable surge on Saturday. It remains in consolidation to the bullish basics on Friday, thereby printing a doji. ETH has experienced and continues to exhibit low volatility, marking the fourth consecutive day of such a trend.
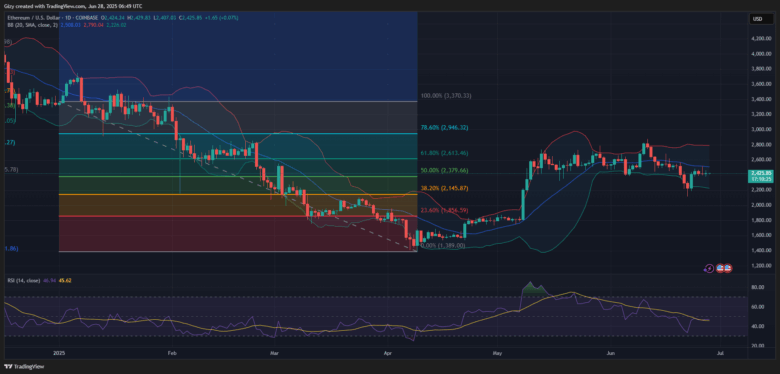
Since the beginning of the day, ETF has been relatively stable. It has struggled to record notable increases in its trading volume, and these efforts have been futile. But, in response to the recent trend, the relative strength index remains stable.
On the one-day chart, the bands of the Bollinger are stretching apart, indicating a lack of a looming massive shift.
However, on the two-day chart, the story is different for the band. There is a constraint as the coin records low volatility on this scale. Although the shorter timeframe is printing such a signal, a slight price change may occur, which will have a minimal impact on prices. Investors may expect a price surge to $2,500; nevertheless, there is a risk of it retracing to $2,380.
XRP/USD
XRP is on the verge of experiencing its second consecutive day of consistent uptick. On Friday, it retraced to $2.06 and rose to a high of $2.15, ending the session with a profit of nearly 2%.
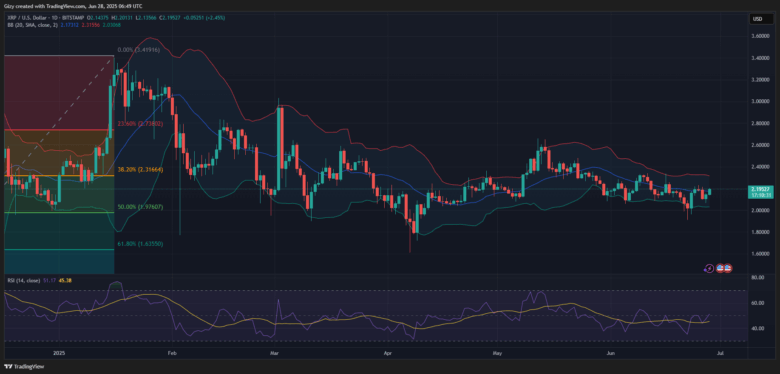
Just like Solana, XRP on Saturday reopened its uphill movement, reaching nearly $2.20. The relative strength index, on the other hand, is climbing, showing a massive buying volume. This will likely fuel its growth beyond the highlighted mark.
XRP is likely to continue increasing, retesting its one-week high of $2.23. Although many efforts have been made to raise the level, this time may be different. XRP has gathered significant buying pressure below the middle SMA of the Bollinger band before retesting the mark. However, it must first flip $2.20.
BNB/USD
BNB coin printed a green candle the previous day. Nevertheless, it showed no notable price surge as the coin finished the session nearly at the same price it began. Its trend of low volatility continues on Saturday. It is currently printing a red candle, which is slightly decreasing. Binance coin has remained above $640 over the past 72 hours; the recent session may not be any different.
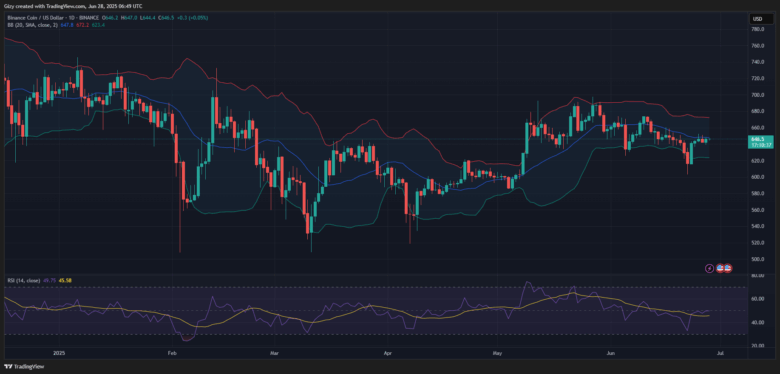
Nevertheless, it is worth noting that the two-hour chart is showing a looming breakout. As a result of less volatility, a restricting Bollinger band implies an increase to its one-week high and, on the other hand, a risk of it slipping below $640.
SOL/USD
SOL is experiencing its second consecutive day of increases. It ended the previous intraday session with gains exceeding 2% after surging to a high of $145 and closing at $142.
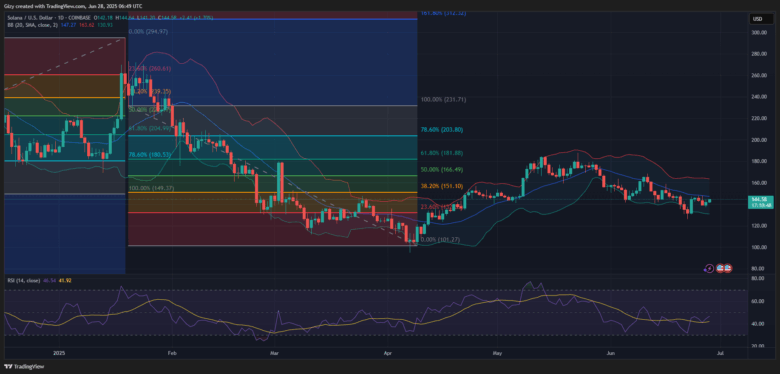
Solana is approaching Friday’s high and may surpass it. The trading activities for this week indicate that the highlighted area will break, and the coin will remain upward, retesting the SMA of the Bollinger band at $148. The rise of the relative strength index indicates that the coin is experiencing a significant increase in buying volume
However, the two-hour chart paints a grimmer picture. Solana is currently trading near Bollinger’s upper band. On the frame, SOL seldom breaks, but selloffs often meet the increase out of the mark. The trend may happen again on Saturday.
DOGE/USD
Like the Solana coin, the largest memecoin is seeing a little uptick. This marks the first green it gets after the last 48 hours of constant declines.
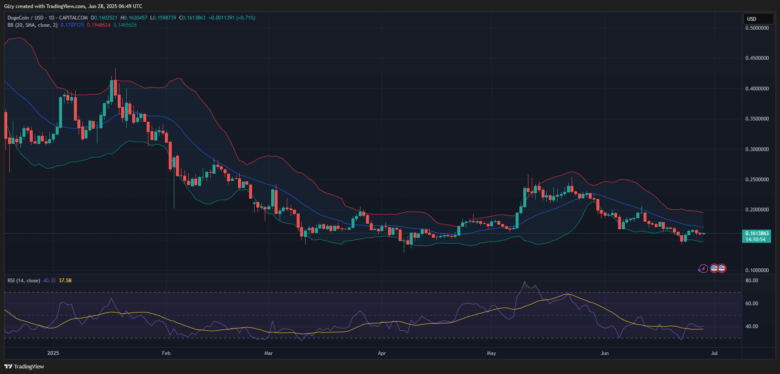
While aiming for a future upward price surge, Dogecoin is currently selling for more than $0.161. As the purchase pressure slightly increases, the relative strength index is also rising. Bollinger bands, on the other hand, suggest a potential increase in the middle band to $0.17.
The two-hour chart also displays a similar signal, indicating a potential surge to $0.162 in the future. Nonetheless, the coin is experiencing less volatility, as it printed a longer candle before. However, at the time of writing, it printed a smaller one, indicating a struggle to continue the bullish uptrend.
ADA/USD
After three days of consecutive price decline, Cardano is showing signs of rebounding, having dropped from $0.58 to $0.54. As of the time of writing, it has printed its first green candle. Nonetheless, the candle indicates that the uptick may only be temporary, as the coin is currently selling slightly lower than its high.
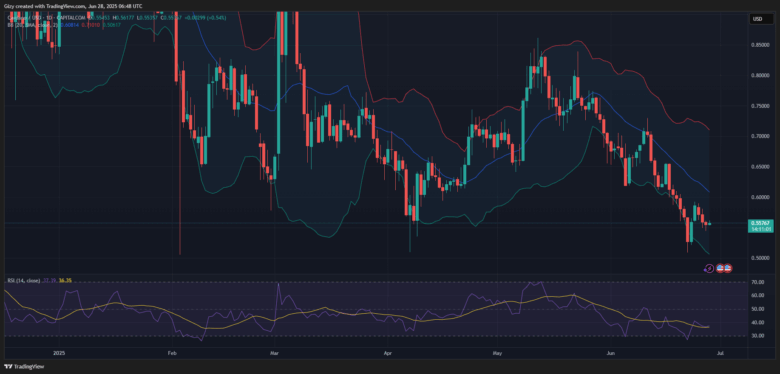
The past price shifts show the possibility of the coin retesting $0.58. There is also a pointer to the chances of it falling to $0.54. Nevertheless, the rising relative strength index will increase the possibility of an upside breakout.
Find Cryptocurrencies to Watch and Read Crypto News on the Go Follow CryptosToWatch on X (Twitter) Now
