
In the last two days, BNB has not recorded any significant or notable surge. After experiencing a substantial increase on the first day of the week, the one-day chart shows that it has lost momentum and is under increased selling pressure.
This BNB case aligns with the same trend currently ongoing across the top 10 Crypto assets. As a result, and at the time of writing, many of them on daily charts are printing dojis, which indicates that they are not receiving the required attention from investors.
The global crypto market cap is experiencing a significant decline in trading activities. Over the past 24 hours, the market has remained stagnant, declining by 32%. However, as trading activities improve, the fear and greed index has surged by 1 point, irrespective of price stagnation.
On the other hand, as tensions in the Middle East decrease, investors show increased optimism. Nevertheless, the current price movements indicate that many investors may be exhausted from the intense rallies that occurred on Monday and Tuesday.
Some cryptocurrencies that experienced significant surges earlier this week are currently experiencing trend reversals. For example, in the first two days of the week, SEI saw an increase of almost 50%, surging to $0.31 on Tuesday. But, just a few hours ago, as at the time of writing, it has drastically dropped to $0.24.
The assets affected by the trend are the top 10 cryptocurrency assets. Let’s check them out.
BTC/USD
The popular coin, BTC, on the one-day chart, is printing a doji as it strives to remain in its uptrend. It is worth noting that the milestone was reached on Wednesday, as it broke the $ 108,000 mark for the first time in over seven days.
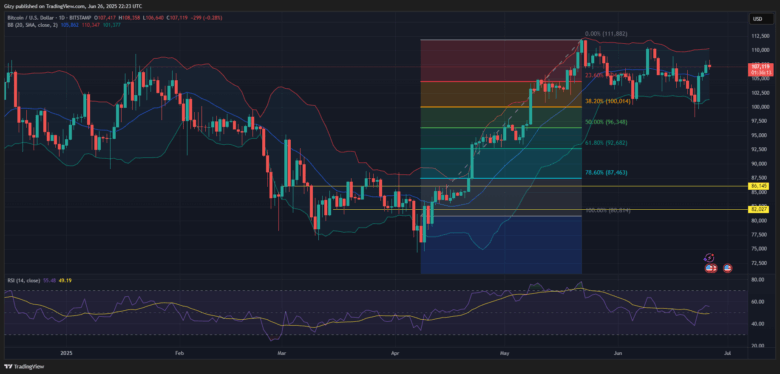
Nevertheless, Bitcoin experienced some selling pressure after reaching its previous high, resulting in a slight setback. It is currently trading at an opening price as the bulls attempt to recover and cause further increases.
The daily chart indicates that BTC is currently trading at one of its strongest support levels. Past price actions show that in May, BTC rebounded off the noted mark multiple times.
To avoid a drop to $104k, the bulls must carefully strife to defend $107k. Failure to do this will open up the door for a decline.
However, some investors show that the bulls are technically still in charge as Bitcoin sells beyond its middle band.
The relative strength index, as of the time of writing, shares the same features, currently trending at 57. The numbers continue to surge amid the current price, printing more notable signals on the four-hour chart indicating that BTC is seeing massive buying pressure.
ETH/USD
Ethereum attempted to claim the Bollinger’s middle band at $2,519. Nonetheless, it experienced significant selling pressure, which triggered the asset to retrace. As a result, it is currently trading at $2,456 after surging over $2,500.
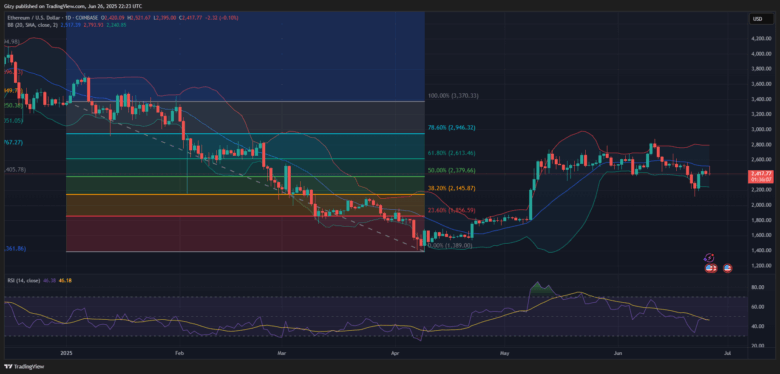
However, irrespective of the setback, onchain data stays positive amid the recent adjustment in trajectory. Ethereum continues to experience an increased exchange outflow, resulting in a slight drop in reserves. The derivatives market, on the other hand, is experiencing increased trading activity, indicating that traders remain active.
According to records, price movements indicate that the biggest altcoin trades within a very close range to the current price level, with notable demand concentration. ETH has displayed robust demand, with approximately $2,450, as it rebounded off this level more than once last month.
Ever since the loss of $2,500, investors must try as within their power to defend the highlighted mark. If they fail to do so, ETH could decline to $2,380, aligning with the 50% Fibonacci retracement level.
Nevertheless, short-term indicators on the 2-hour chart offer some hope, indicating an increase in the Relative Strength Index.
XRP/USD
Just like BNB, XRP is also facing struggles in attempting to experience a significant surge. This week, it has seen a considerable surge, reaching $2.23 on Wednesday before declining, and ultimately ending with some minor losses.

Still reeling from the previous day’s downtrend, ETH declined further on Thursday, retracing from $2.21 to as low as $2.09. This indicates that it has decreased by over 3%, and the coin may end the day with significant losses.
The relative strength index is currently in a downtrend in response to the latest price decline.
Additionally, a few hours ago, XRP lost its Bollinger’s SMA and is now on the verge of the lower band. It’s important to note that XRP lost by $2.10. However, $2.15, which is the mark, demands significant concentration.
The daily chart from a few hours ago shows that the asset is currently testing Bollinger’s lower band. Nonetheless, there’s no recovery yet as the relative strength index on the scale remains unchanged in both buying and selling volume. The $2.10 mark is critical and, therefore, must be defended carefully, as a drop can lead to future drops.
BNB/USD
BNB just registered its first red candle of the week. The daily chart indicates that over the past two days, the coin experienced slight volatility, reaching a high of $652 on Wednesday.
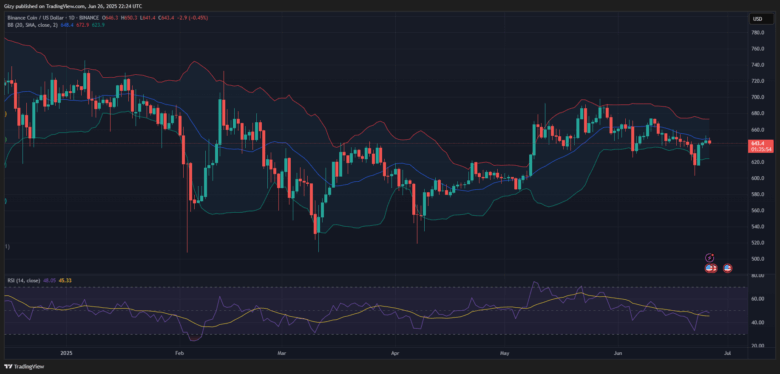
Currently, at the time of writing, Binance follows a similar trend; the red in the daily charts shows an increased selling pressure. Nevertheless, it is trading above a critical level despite its downturn. BNB’ss support of $640 remains crucial and significant as the coin rebounded off the mark on several occasions. It could drop down to $625.
BNB is currently trading below Bollinger’s middle band, which may be seen as bearish by many traders. The relative strength index is experiencing a downturn as the selling pressure increases.
These readings are shown in the 4-hour chart as the relative strength index decreases; Binance stands a chance of losing its Bollinger band.
SOL/USD
Solana is another coin experiencing a heavy decline. It is on the second day of its downtrend. This was spurred on Wednesday by the failed attempt to make a minor correction at the $150 resistance level. The downturn is worsening as it continues to decline. It has currently retraced back to $140.
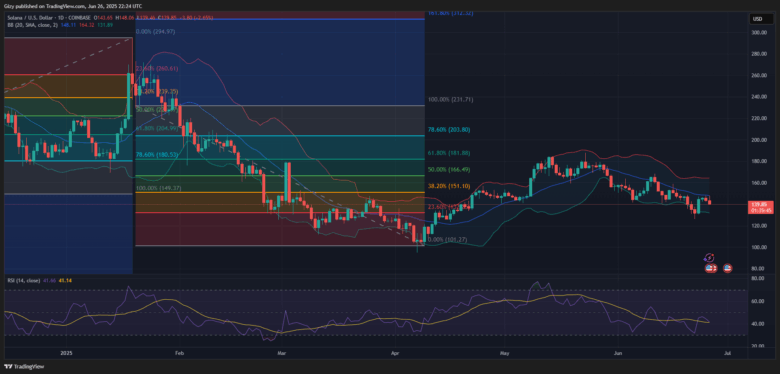
BNB is struggling to gain momentum amid the decline. The daily relative strength index has plummeted to 41, down from its previous reading of 46, indicating a decrease.
At the time of writing, other factors, such as the Accumulation/Distribution Line and the Average Directional Index (ADX), are also negative.
Over the last 24 hours, the 4-hour chart presents a grimmer picture, marked by red candles. If the selling pressure remains unchanged, more downturns can be expected.
Find Cryptocurrencies to Watch and Read Crypto News on the Go Follow CryptosToWatch on X (Twitter) Now
