
XRP plunged lower on Sunday, dipping to its lowest last week. It joined most cryptocurrencies in recording notable declines.
Nonetheless, XRP has seen little volatility over the last seven days, as data from CoinMarketCap shows a notable decline in trading. The platform reveals that other crypto assets had the same trend over the weekend.
The global cryptocurrency market cap dropped below $3.40 trillion on Sunday. However, it recovered and is valued at $3.46 trillion. Investors anticipated massive declines following Bitcoin’s ATH. The fear and greed index dropped from 76 to 67. The metric is improving as bullish sentiment returns to the sector.
Fundamentals were notably positive during the previous week. This trend caused ETFs to surge in inflow, resulting in an over $2.70 billion inflow. The derivative market was active as liquidations and open interest soared.
However, some altcoins struggled to surge due to low volatility. Others failed to sustain trading above key levels, retracing to a fourteen-day low. One such is Walrus. It opened the session at $0.66 and retraced, dipping to a low of $0.51.
SUI was one of the top losers last week, retracing from $4.20 to $3.43. The coin lost almost 9%, marking its second consecutive red in the previous two weeks.
Nonetheless, other big assets saw notable volatility. Let’s see how they performed.
BTC/USD
The one-week chart shows that the apex coin registered gains exceeding 2%. It ended the previous week at $109,114, a slight change from its peak and a massive improvement from its low.
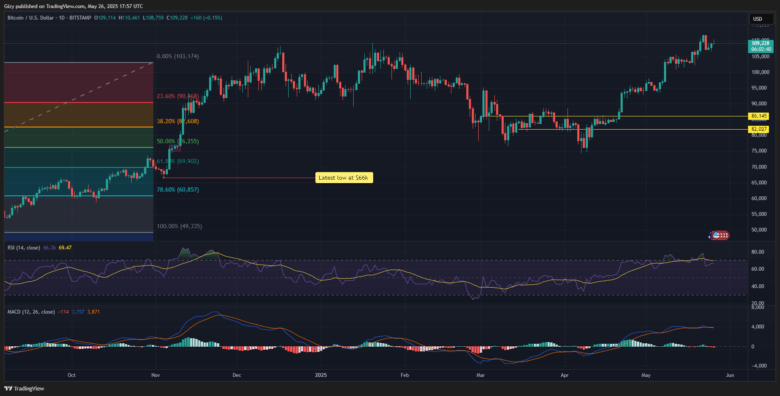
Bitcoin kicked off the previous session at $106,520 and retraced to $102k after a slight uptrend. It rebounded, sparking several upticks, resulting in a new ATH on Thursday. The largest coin peaked at $112k but saw a massive decline the next day.
It lost almost 4%, dipping from $111,700 to $106,829. Over the next two days, it tried recovering lost levels but failed. Nonetheless, factors like low trading volume and notable bearish sentiment across the crypto market presented resistance to this bid.
Indicators flipped bearish in response to the massive decline. RSI dropped below 70 after days of indicating that the apex coin was overbought. The metric is climbing as BTC sees notable buying pressure.
The Bollinger band showed that Bitcoin broke out on Thursday. Following Friday’s declines, it trades closer to the upper band at the time of writing. It is worth noting that it has surged upward since testing the $102k support on Monday. The next price level with significant demand concentration is $105k.
ETH/USD
Ethereum ended the previous week with gains exceeding 2%. The one-week chart shows that the altcoin had notable volatility during this period.
Its slow start to the session ended on Thursday when it opened trading at $2,552 and surged to a high of $2,692. It gained over 4% but saw a trend reversal the next day. It peaked at $2,734 but retraced, dipping to a low of $2,500.
It slipped lower on Sunday, rebounding at $2,463. The one-day chart shows the $2,450 support held out over the last seven days. Nonetheless, it faced massive resistance at $2,700, resulting in its inability to hold the level.
The relative strength index plummeted in response to Friday’s sudden increase in selling volume. It retraced from 72 to 62 and shows no significant change in this trend over the last three days.
The moving average convergence divergence prints a similar signal. It showed a bearish crossing last week and has since continued downwards.
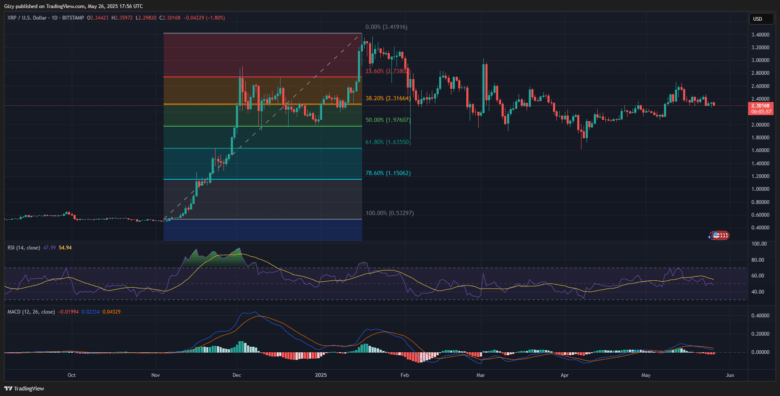
XRP/USD
XRP retraced to its lowest in the last two weeks. On Sunday, it dropped from $2.24 to $2.26. The decline marked a significant shift in the trading sentiment. The one-day chart shows that the altcoin was notably bullish over the last seven days.
However, it had its biggest decline on Friday, retracing from $2.47 to $2.28. The 5% dip follows a two-day surge that saw it gain over 3%. XRP consistent test of the $2.30 support indicates growing pressure and dwindling demand concentration, as it slipped below the mark more than twice in the last fourteen days.
RSI agrees with the previous statement, declining from 56 to 47 as selling pressure increased. The metric is not surging, as the trend remains constant. The accumulation and distribution chart shows that the bulls struggled to soak up the excess supply.
MACD displayed a bearish divergence two weeks ago. Trading action over the last seven days saw it retrace lower.
BNB/USD
Binance coin had notable increases last week. Wednesday and Thursday were the most bullish when it overturned the start of the session.
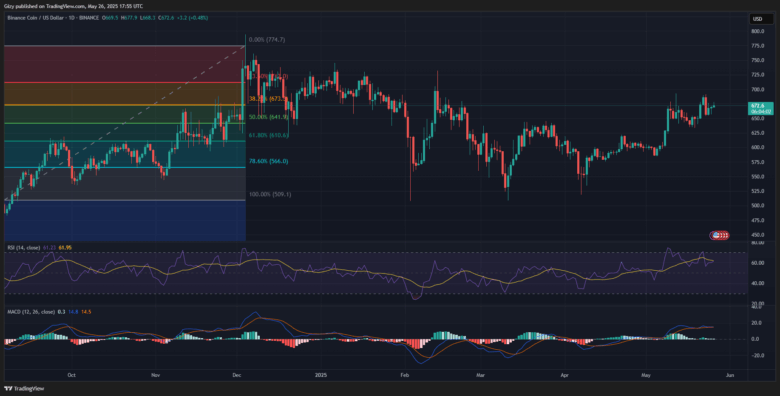
It started the third day at $650 and surged to a high of $678. The almost 4% increase continued the next day as the altcoin attempted the $700 resistance. However, it experienced massive rejections at $690, resulting in a slight decline.
The downtrend continued on Thursday, dipping to $653. The one-day chart shows that the BNB struggled to reclaim lost levels over the next two days with limited success.
Nonetheless, indicators like the RSI and MACD flipped bearish. The relative strength index retraced from 70 to 56. The moving average convergence divergence started a negative convergence. Its 12-day EMA trend close to the 26-day EMA.
SOL/USD
Solana started similarly to the previous week, like XRP. It retraced to its lowest in the last two weeks, dipping to a low of $159. The next day, it overturned the sluggish start to the session as it attempted recovery.
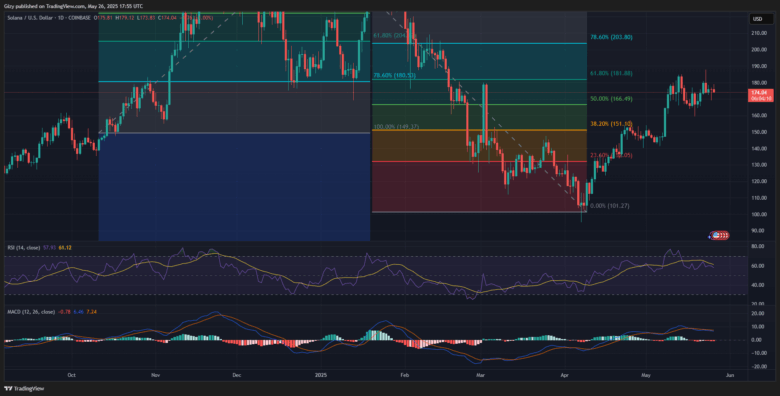
Nonetheless, it had its biggest surge on Friday, rising from $179 to $187. However, massive selling pressure sent it to a low of $173.
RSI declined from 65 to 56 in response to the trend. The metric is not surging, as the trend remains constant. The accumulation and distribution chart shows the bulls struggled to soak up the excess supply.
MACD displayed a bearish divergence two weeks ago. Trading action over the last seven days saw it retrace lower.
Find Cryptocurrencies to Watch and Read Crypto News on the Go Follow CryptosToWatch on X (Twitter) Now
