
SOL is on the verge of breaking a key level following a gradual increase in buying pressure. The altcoin is exempt from the general crypto market trend, which saw most major assets experience little to no volatility.
SOL may end the week with a green candle on the one-week chart, marking its second consecutive. The coin’s performance did not go unnoticed as investors expressed optimism about its next price action. Some predicted a return to $160, while others aimed higher.
Nonetheless, the crypto market is experiencing a sluggish week. Several crypto assets experienced almost no volatility over the last three days, trending like stablecoins. The global cryptocurrency market cap is seeing a slow increase amid the slow movement.
Data from CoinMarketCap shows a notable decline in trading volume over the period. The sector saw a slight increase in buying volume and reduced selling pressure.
The week started with investors anticipating fireworks, either upward or downward. Donald Trump’s freeze on the tariff against several nations thrilled many, who responded with more liquidity to the crypto market. However, the ongoing trade war with China and the US’s failure to negotiate on terms with other countries has led investors to exercise caution.
Most cryptocurrencies in the top 10 remained afloat during this period. Let’s see how they performed.
BTC/USD
The one-day chart shows Bitcoin maintaining a range-bound movement over the last five days. It traded between the $86k resistance and $83k support and briefly broke above the negative barrier on one occasion.
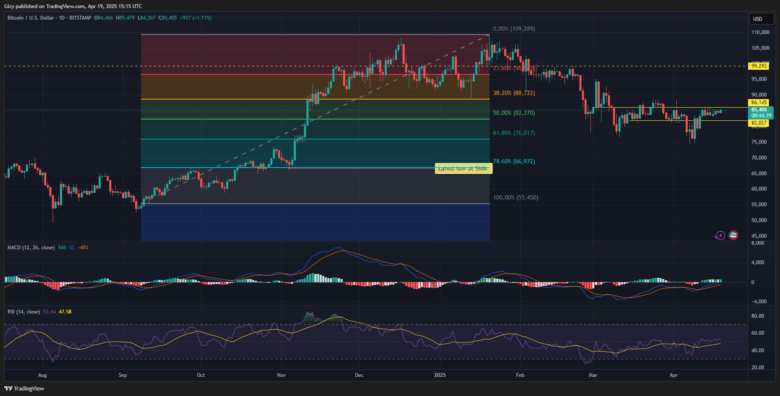
The flip happened on Tuesday when the largest coin opened trading at $84,583 and surged to a high of $86,450. After breaking the mark, it met massive selling pressure, resulting in a retracement below its opening price.
BTC has since struggled to break above the mark again. Nonetheless, it prints a green candle at the time of writing. Slightly up, the asset is seeing a notable increase in buying volume. Data from CryptoQuant shows that exchange reserves declined at the time of writing. These platforms are seeing a significant increase in outflows, 100% more than the previous day.
The one-day chart shows the moving average convergence divergence printing bullish signals. It continues its rise following its positive interception last week. However, the histogram associated with the metric printed the same bars in the last three days, indicating that the asset saw little upside movement during this period.
Nonetheless, the relative strength index is slightly up as buying pressure increases.
ETH/USD
Ethereum was on the verge of breaking its seven-day high on Monday but failed. It surged to a high of $1,691 but retraced and closed at its opening price. It attempted the mark the next day but failed as selling pressure increased.
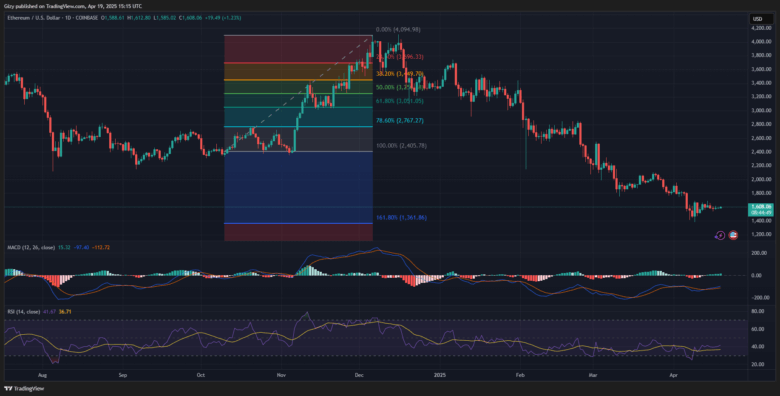
The one-day chart shows that the asset struggled with little volatility after Tuesday’s price action. Due to low trading volume, it failed to register any significant increase. Nonetheless, indicators like MACD and RSI remain slightly positive.
The relative strength index is on the rise as buying pressure picks up. However, it remained largely stable over the last three days.
The moving average convergence divergence shows that the bulls are seizing the initiative. Although the price change is not significant, they prevented further price declines. The histograms displayed a rising pattern over the last five days.
The Bollinger band tells a less optimistic story. ETH is trading below the middle and lower bands and shows no signs of breaking out this week. Nonetheless, the band is contracting.
XRP/USD
XRP was on a descending trend over the last four days. It had a sluggish start to the week but picked up on Tuesday, surging to a high of $2.18. However, it lost momentum after it failed to break the $2.20 resistance.
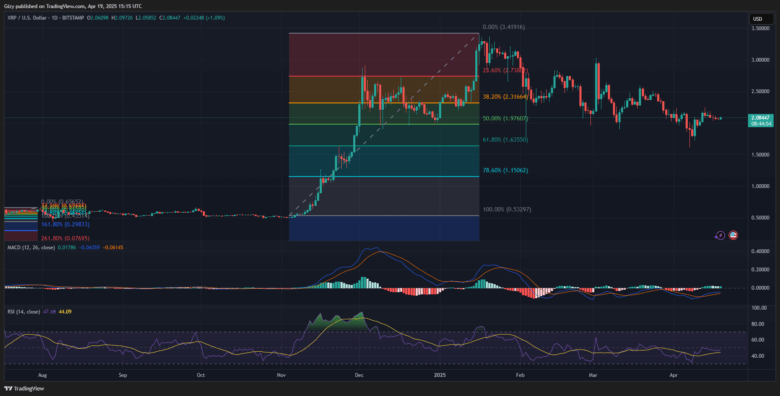
The asset saw slight declines over the next three days but maintained trading above $2. The Bollinger band shows that the altcoin continued trading above the middle band amid its downtrend. Nonetheless, MACD was close to flipping bearish as the 12-day EMA halted its uptrend. The histogram printed smaller bars as the gap between the metric and the 26-day EMA reduced.
Like SOL, XRP is experiencing a slight increase in buying pressure. In response, the relative strength index resumes its uptrend after its five-day dip. The altcoin edged close to reclaiming $2.10.
Currently trading above Bollinger’s middle band may indicate that the bulls may continue the upward push. The indicator is shrinking, suggesting an impending breakout.
BNB/USD
Binance coin hit a high of $594 on Monday and lost momentum, retracing to its opening price. It attempted to break the $600 mark on Tuesday but failed, ending the day with a slight loss. BNB slipped lower the next day, hitting a low of $575 before rebounding.
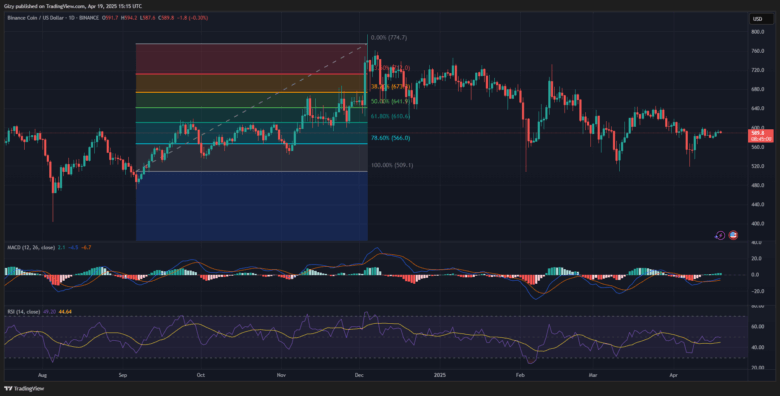
The altcoin experienced its biggest increase on Thursday, surging from $581 to $593. However, the change was insignificant as it struggled to continue the uptick the next day.
As of the time of writing, BNB is grappling with notable selling pressure. The RSI halted its uptrend in response to the latest trend. Nonetheless, the moving average convergence divergence maintains its upward trajectory.
The altcoin is above its 78% fib level. The previous day’s price action saw it edge closer to the 61% fib level.
SOL/USD
SOL edges close to breaking the $140 resistance. It is trading at $139 at the time of writing after several significant increases. Nonetheless, it is worth noting that it broke above its fourteen-day high and eyes its thirty-day high at $150.
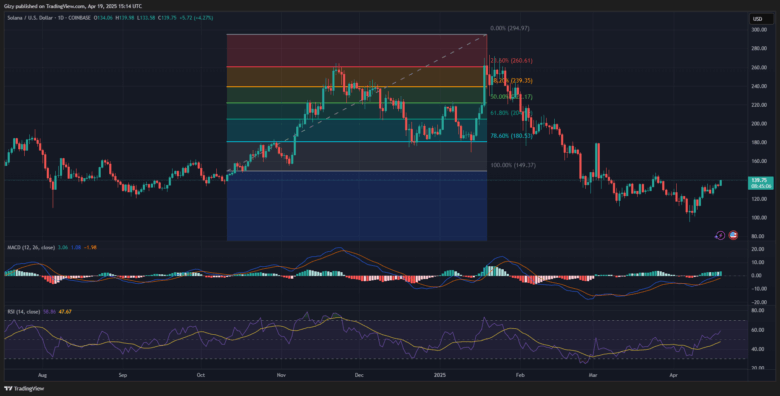
After seeing a slow start to the week, the altcoin had one of its biggest surges on Wednesday. It opened trading at $126 and broke $130 after a slight decline. It peaked at $133 and closed with more than 4% gains.
SOL is up by a similar margin. MACD continues its uptrend as trading conditions improve. The same reading is present in the relative strength index. The metric is at 58, a notable rise from the previous low this week.
However, readings from the Bollinger band show the asset edging closer to testing the upper SMA.
Find Cryptocurrencies to Watch and Read Crypto News on the Go Follow CryptosToWatch on X (Twitter) Now
