Bitcoin had one of its biggest rallies during the previous intraday session. The US election was the primary catalyst in the surge. The crypto-favorite edged and won the race.
The apex coin opened the day trading at $69,396 but surged after a brief decline. It climbed higher, flipping $72k and $74k later. It rose to a new all-time high before noon UTC, hitting a high of $75,397.
The crypto market saw massive inflows during this period. Trading volume surged by over 20%, with massive inflows into Bitcoin. The largest cryptocurrency went through a short cooldown, hovering around $74k according to the one-hour chart.
United States traders asleep during the election counts woke up to the news of Donald Trump’s victory and pushed prices higher. BTC recorded a new ATH, climbing above $76k for the first time ever and peaking at $76,481.
Bitcoin is going through another cool-down and trades at $75k. Slightly down since the day started, it remains to be seen if the bulls will resume the uptrend.
Nonetheless, there is good news for the apex coin apart from the new ATH.
Bitcoin Capped a New Low
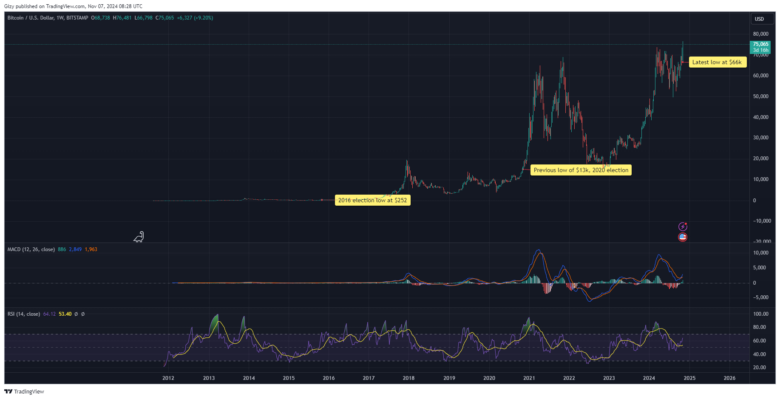
Historically, Bitcoin sets a new low during every election period. Four elections have passed since the asset’s inception, and it has not returned to its previous levels. For example, it registered a low of $252 in 2016. Despite the bears’ market, it surged by over 1000% and has revisited this mark.

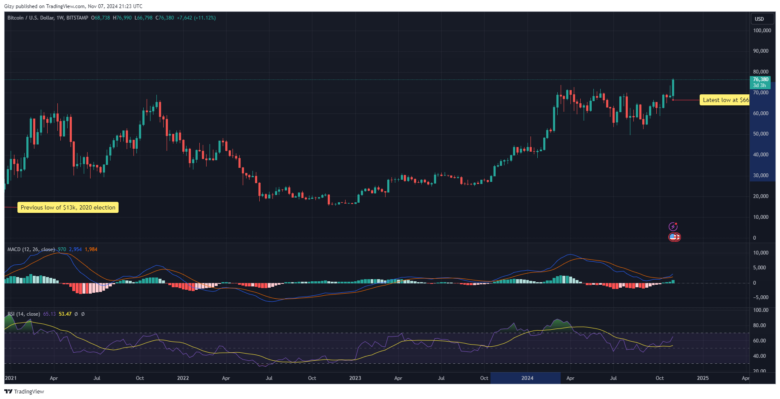
2020 presented the same trend. The apex coin recorded a low of $13k during the elections, surging by over 350%. The Ukraine-Russia war rolled in, the tension in the Middle East reached new highs, and the bears capitalized. Although it retraced to $16k, the $13k remained intact.
Bitcoin hit a low of $66k this week and shot up following the polls. If the previous trend holds, it may never return to this level. Aside from capping a new low, the largest cryptocurrency will hit new highs; speculations on how high vary. Nonetheless, on-chain data prints bullish signals.
Coinbase Premium is Positive
US traders are flooding the market post-election. With the polls going the way many in the crypto market want, it spread a bullish sentiment. Onchain shows the Coinbase premium is currently green, indicating notable demand concentration from the region.
The bullish sentiment spreads to other regions, including the Asian market. It sees massive inflows as the Korea premium indicates. The US and Hong ETF experienced the same trend, with the United States witnessing an inflow exceeding $600 million the previous day. However, the inflows from this instrument slow down as the fund premium is negative.
Other critical indicators, like the Stochastic and Relative Strength Index, suggest room for more surges. Both metrics are neutral, indicating that the apex coin experiences normal buying pressure. This is important as miners are currently selling.
Nonetheless, the derivative market sees massive activity. Funding rates are significantly up as more traders flood the sector with new funds, some to extend their liquidation mark, while others to open new positions. This is especially true as open interest is 6% higher than the previous day.
The bears are the biggest losers in the market over the last 24 hours. Although liquidations are down by over 44%, the losses continue. Traders lost over $300 million, with short positions making up over $200 million from over 24 million traders. Nonetheless, the bears are edging as there is a significant growing selling sentiment.
The growing selling trend is due to massive unrealized profit. Onchain data shows large holders moving their assets. They moved 24% more assets than during the previous intraday session. Due to this trend, the exchange netflow is positive, indicating possible impending sell-offs. Amidst investors taking profit, exchange reserves are declining.
Bitcoin May See Short-term Declines
The one-day chart explains the reason for the ongoing decline. The relative strength index surged from 51 on Monday to 71 at the time of writing. The massive increase in buying pressure forced a sudden rise. Nonetheless, the apex coin is overbought and due for corrections, so it is unable to continue the enormous surge.
The Bollinger bands show another reason for the decline. BTC broke above the upper band during the previous session. It is exchanging above this crucial metric and has yet to retrace below it. Trading above this metric indicates an impending decline as it signifies the peak of a short-term uptrend.
The decline may last for a week or two as this is the same sentiment on the one-week chart.
BTC Will Resume its Surge
The one-week and one-day charts suggest that the apex coin will see massive increases following the short-term downtrend. The moving average convergence divergence displayed a bullish interception during the previous intraday session. MACD’s 12-day EMA continues its uptrend, with the 26-day EMA following behind.

The same trend is present in the seven-day time frame. Nonetheless, the RSI on the larger timeframe shows room for more uptrends. The average directional index halted its descent as the downtrend lost strength.
MACD’s latest interception on the weekly scale may spell massive increases for the apex coin. It gained a staggering 170% after the previous crossings. It may surge higher during this period, hitting six figures. With 160% in mind, BTC may hit $175k. Previous price movements also suggest that the rise will happen within five months. It remains to be seen if history will repeat itself.
Bitcoin’s latest bullish divergence on the one-day chart will see it continue charting prices into new price marks. One report speculates a possible rise to $100k before Trump’s inauguration, meaning the asset will register more price increases this year.
Find Cryptocurrencies to Watch and Read Crypto News on the Go Follow CryptosToWatch on X (Twitter) Now

