
Ethereum dipped to a low of $1,750 a few hours ago. The change was insignificant as the asset hovered between the highlighted support and $1,850.
The asset remained in a range-bound movement over the last fourteen days as investors failed to rally. Nonetheless, the apex altcoin trades close above $1,800 following its decline, indicating recovery. Its latest price may be due to growing optimism across the crypto market.
The US Federal Reserve will conclude its meeting on Wednesday and announce its results. Investors are optimistic that Jerome Powell will declare rate cuts. Such a phenomenon positively impacted the crypto industry, and this time may be no different.
Onchain data sheds more light on traders’ sentiment at the time of writing. Data from CryptoQuant shows that exchange reserves are declining. A significant change in inflow and outflow is also present. However, the outflows exceed the inflows as investors move assets off-chain. It is worth noting that the asset is seeing an increase in open interest, growing by 3% in the last 24 hours.
While these bullish metrics reflect an ongoing trend, the asset remains bearish on other scales. The taker buy-sell ratio is below 1, indicating that the negative sentiment continues. The bulls are the top losers over the last 24 hours, as long positions worth over 22k ETH were REKT compared to short positions.
Ethereum Stablecoin Market Cap Dips
Other indicators suggest that the apex altcoin may see further decline. Analysts drew a parallel between a chain’s stablecoin market capitalization and the coin’s price. An increase in stablecoin indicates notable liquidity that may trigger an upward run. However, the opposite may signal further price decline.
Ethereum stablecoin market cap is declining. The gradual drop in such asset explains the low volatility over the last fourteen days. There is no sign of an impending change, which may contribute to further price retracement.
Nonetheless, DEXs volume is notably lower than the previous week’s high. The trend indicates fewer user interactions with Dapps and other features in the ecosystem.
An Ongoing Bearish Convergence Divergence
The moving average convergence divergence prints several sell signals. A few weeks ago, the asset’s 12-day EMA halted its uptrend as it lost momentum. It slightly declined but has remained mostly stable over the last fourteen days. However, the histogram shows smaller bars as the 26-day EMA closes the gap with the 12-day EMA. The ongoing bearish convergence may signal further price declines.
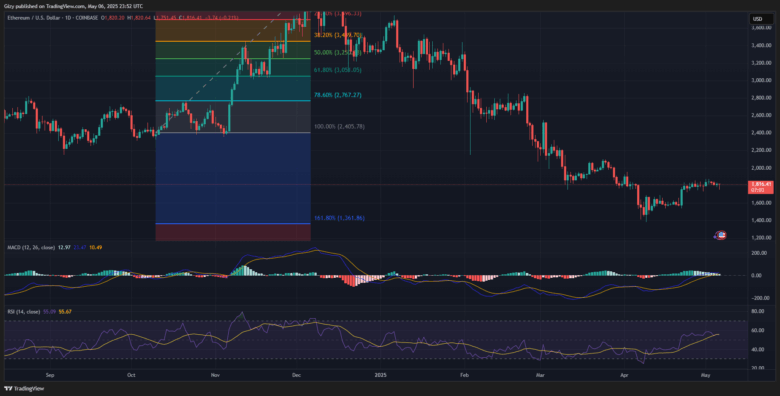
Nonetheless, following the slight increase in selling volume two days ago, RSI has remained almost stable. It shows no significant increase in buying or selling pressure. It is worth noting that ETH is positive based on the bollinger bands.
Ethereum failed to reclaim the 23% fib level at $1,856. Its current price suggests it may continue hovering around the $1,750 support. However, readings from several metrics, on-chain and in the charts, hint at a significant decline.
Based on price movement, ETH risks slipping below $1,600 after losing the highlighted support. Conversely, positive fundamentals like the interest rate cut may stall this decline. The largest altcoin may surge close to $1,900 this week.
Find Cryptocurrencies to Watch and Read Crypto News on the Go Follow CryptosToWatch on X (Twitter) Now
