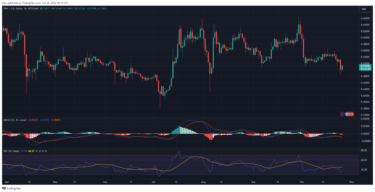
XRP has registered massive declines since the start of the week. A closer look at the one-day chart shows it started with notable declines on Monday, following a failed attempt to continue the bullish trend it had on Sunday.
Although the decline was insignificant, it set the precedent for the rest of the session, as the downtrend continued the next day. It lost the $0.54 support and dropped to a low of $0.52. Following a slight recovery, it lost over 2%. XRP sank lower on Wednesday, breaking below the Bollinger bands but rebounding at $0.51. It lost almost 2% amidst the buybacks.
Nonetheless, it had one of its most significant single-day declines during the previous intraday session. It opened trading at $0.53 but retraced as the asset saw a substantial rise in selling pressure. The altcoin lost the $0.50 support, hitting a low of $0.48 before rebounding. However, the hike was short-lived, as it ended with losses of almost 6%. ‘
Several factors contributed to the massive decline. One such is a shift in investors following recent actions by the Ripple CEO. A few weeks ago, he donated over $1 million to Kamala Harris’ campaign, now sparking controversy amongst top players in the crypto space. Many blame him for supporting the candidate against the crypto-favorite Donald Trump.
Tensions in the Middle East also contributed to the massive declines. The impact of the recent escalation rang through the crypto market as its total valuation dropped by over 3%. It was also responsible for XRP’s massive decline during the previous intraday session.
However, the dip has set the altcoin up for a possible change in price trajectory.
Breaking Below the Bollinger Band
The seventh-largest cryptocurrency recently slipped out of the Bollinger bands. The breakout happened during the previous intraday session, as it lost the $0.50 support and hit a low of $0.48. This is not the first time the asset has dropped below the lower band this week; the first took place on Wednesday.
The latest event may mean the end of the downtrend. On several occasions, an asset dropping below the lower SMA signifies an impending uptrend, which may play out with XRP.
Other metrics, like the average directional index and relative strength, support this claim. The ADX is rising as traders are gradually building momentum. A closer look shows that the ongoing trend is occurring amidst the coin’s bearish performance this week.
RSI was at 33 on Friday but is at 38 now, indicating ongoing buyback attempts by the buyers. Data from the Cryptocurrenciestowatch price tracker shows that the asset slightly increased in trading volume over the last 24 hours.
However, the moving average convergence divergence still prints sell signals. It is yet to recover from its previous bearish divergence as the 12-day EMA continues downwards and shows no hints of halting its downhill movement.
When Will XRP Recover?
The recovery is underway, as the top asset is on its second consecutive green. Although not massive, the small gains see it gradually resume trading inside the Bollinger band. It will look to continue the trend after gaining over 2% during the previous intraday session.

Although starting off slow, further increases in trading volume may send the price above the first pivot support at $0.52. The Fibonacci retracement level supports this claim as XRP previously bounced off the 78% retracement level and continues upwards until it flips the 61%.
Previous price movement shows that the key to retesting $0.56 is regaining control above the S1. The altcoin traded between the mark and the $0.54 barrier before breaking out.
Other crypto assets may also resume their uptrend following Friday’s decline. However, unlike two weeks ago, there will be no significant push this month.
Find Cryptocurrencies to Watch and Read Crypto News on the Go Follow CryptosToWatch on X (Twitter) Now

