
Ethereum has gained significant upward momentum, trading at $4,487 at the time of this writing. The coin began the day at $4,374, and its nearly 3% increase showcases renewed investor confidence. Market data indicate a steady rebound after the asset faced notable losses on Friday. According to CoinMarketCap, Ethereum is experiencing a resurgence in trading volume, suggesting that volatility has returned to the market.
August turned into a crucial month for Ethereum as the token approached substantial gains. One of the biggest drivers of this trend was the sharp rise in demand for ETF funds. Reports from August 9 indicated that Ethereum ETFs garnered $461 million in inflows, with BlackRock leading the way at $250 million and Fidelity contributing $130 million.
SoSoValue reports that Ethereum’s spot ETFs even surpassed Bitcoin’s in performance. Throughout the month, Ethereum ETFs stayed on track to finish with their second-largest inflow since inception. To compare, July closed with $5.43 billion in net positive flows, marking the largest month on record. August is expected to wrap up with inflows of $3.87 billion, which, although trailing July, remains strong.
Moreover, Inflows topped $2.85 billion in the week ending August 15, indicating strong institutional accumulation. Beyond ETFs, spot demand also surged as whales shifted their investments from Bitcoin to Ethereum. CryptoQuant data further indicates shrinking exchange reserves, signaling a tighter supply.
Ethereum Achieves a New All-Time High
On August 24, Ethereum reached a huge milestone when it hit an all-time high of $4,955. Although corrections followed swiftly, this achievement was marked as one of the most exciting moments in altcoin’s history.
Just two days prior, Ethereum had captured attention when it registered its largest price movement in months, jumping from $4,224 to $4,886 in a single day. This movement represented an increase of more than 14% before a minor pullback occurred.
The rally didn’t happen alone. Solid fundamentals contributed to it. Especially as the U.S. released discouraging macroeconomic data earlier in the month. Concerns about inflation initially pushed risk markets downward, pulling Ethereum along with them. Between August 18 and 19, the coin fell by more than 9%, declining from $4,475 to $4,227.
Later, Federal Reserve officials shifted their stance. The Fed chair confirmed that key economic conditions might necessitate an interest rate cut in September, which reversed the sentiment and set Ethereum up for its late-August highs.
Despite the overall optimism, many traders experienced significant losses during the volatile market swings. Data from Coinglass shows that liquidations totaled $900 million on August 25, with Ethereum traders bearing the brunt. Out of that total, traders lost over $818 million as ETH retracted from its record peak.
However, open interest now stands slightly higher than the previous day, suggesting that traders remain active. Analysts now turn their focus to see how September will unfold amid interest rate considerations.
Technical Indicators Point Toward Retracement
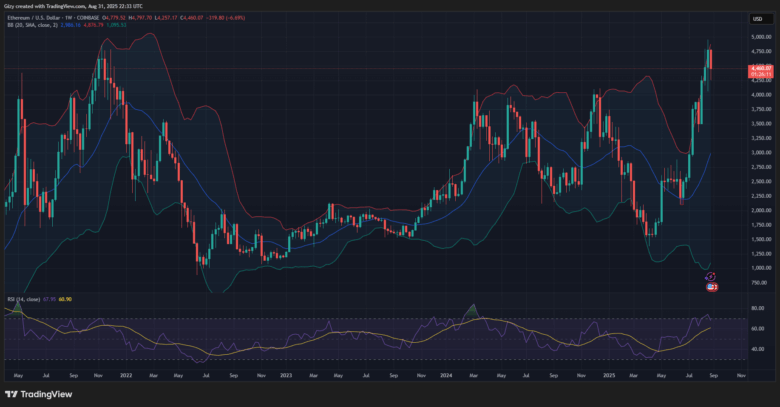
Ethereum’s price tested the upper Bollinger Band before retracing, indicating that the market had reached a temporary exhaustion point. The chart shows that a bearish signal emerged during the week.
Notably, ETH has traded close to the upper band for eight consecutive weeks. According to the rule governing this indicator, an asset that hovers near the band for an extended period often corrects soon after.
Alongside the Bollinger Bands, momentum readings show early signs of weakness. The relative strength index (RSI) climbed as high as 74 last week, pushing into overbought territory. As selling pressure increased, the RSI dropped to 67, which suggests a more neutral position. Analysts expect the figure to drift lower, with 50 as the next likely target. If that decline unfolds, Ethereum prices will likely follow, signaling a strong likelihood of deeper pullbacks.
Historical Patterns Support View.
After testing the Bollinger Band’s upper range, Ethereum typically retraces around 40% before stabilizing. For instance, one previous correction erased 42% of value before a rebound, while another drop following the December 16 breakout exceeded 60%. Based on the current price, a similar 40% retracement would push ETH below $2,900.
Certainly, the setup shows that Ethereum could face at least a 10% decline through September, even with strong demand from ETFs and whales.
The anticipation surrounding a possible September rate cut grows stronger each week. Investors consider it one of the key events in the coming month. However, historical performance suggests that the cut may not have a significant impact on Ethereum.
Looking at Ethereum’s monthly returns, September typically ranks as one of the weakest months. On average, the coin experiences a 10% loss, with the median result sitting around -13%. Since its 2015 launch, Ethereum has closed six Septembers with losses, including a staggering 45% drop in 2015. In contrast, it has only recorded four winning Septembers, with the highest increase at 13% in 2016. These trends suggest that Ethereum often struggles during September. Although the coin has experienced bullish trends over the past two years, its historical pattern leans bearish.
August Gains Could Really Fade
Recent price movements support this bearish sentiment. Following a strong rally, Ethereum is already showing signs of a slowdown. The 1-week chart indicates a nearly 6% decline after the coin rebounded from $4,250. Current conditions reveal that Ethereum could dip below the $4,000 mark if the weakness persists.
Nonetheless, steady demand from ETFs and whale accumulation continues to offer some protection against more severe losses. If September deviates from its historical pattern, Ethereum may once again defy all expectations.
Ethereum’s performance in August solidified its status as the most-watched altcoin in the market. Record ETF inflows, rising spot demand, and a new all-time high emphasized its strength.
Yet, the significant liquidations and September’s poor historical records weigh heavily on its near-term outlook.
With a possible rate cut approaching and tightening market conditions, Ethereum enters a critical month. Whether it maintains its value above $4,000 or declines further will depend on how investors interpret macroeconomic cues and on-chain trends.
Find Cryptocurrencies to Watch and Read Crypto News on the Go Follow CryptosToWatch on X (Twitter) Now
