
Ethereum failed to impress following the notable positive sentiment across the crypto market. Most assets reacted to this bullish shift from the previous day, with the global cryptocurrency market cap hitting a new high.
However, ETH ended Tuesday with a doji as the bulls did not sustain the momentum after it peaked at $2,588. It is worth noting that the asset retraced a low of $2,444 before the surge. It trades a little below its open price.
Several factors contributed to its current trend. The one-day chart shows two other dojis representing trading action in the last two days. Both reveal a massive decline before a slight upward push. On Sunday, the coin dipped to a low of $2,323 before recovering. A similar event took place the next day.
Following the volatile movement last week, the bulls are exhausted. This is evident in the reduced upward movement. Nonetheless, the largest altcoin is grappling with an adverse reaction to a news story.
An Ethereum co-founder made a massive ETH transfer. Jeffrey Wilcke transferred 105,737 units of the asset to Kraken. The move quickly gained attention, as many feared he might sell soon. However, he moved the coins to 12 different addresses afterwards.
Data from CryptoQuant suggests that the largest altcoin is seeing massive selling. Exchange inflows are increasing, outweighing the outflows. As a result, exchange reserves are growing, increasing by about 5% in the last 24 hours.
ETH remains bearish as open interest has plummeted significantly, lower than the previous day. The taker buy-sell ratio is below one, suggesting that the asset is notably bearish.
Indicators are Flipping Bearish
Ethereum broke the third pivot resistance last week, peaking at $2,739. However, it failed to continue the surge and retraced afterward. The one-day chart shows it trading close to the mark, but it veered close to testing the second pivot resistance at $2,284 on Sunday.
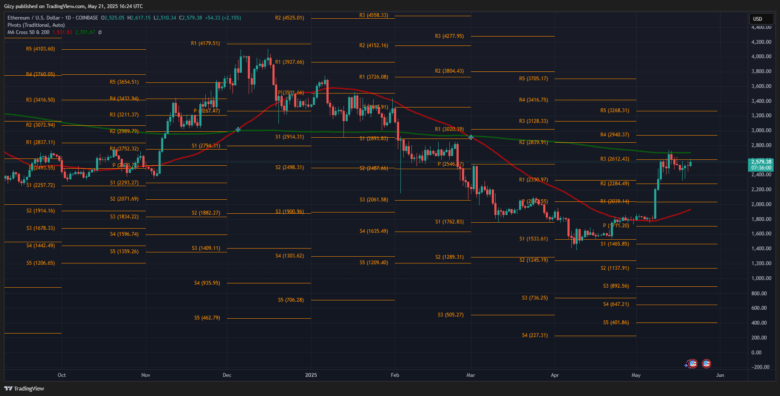
The largest altcoin briefly moved upward a few hours ago but failed to sustain the momentum. It broke above the PPS R3 but trades below it at the time of writing. The 50-day moving average continues its uptrend amid the sideways price movement.
Ethereum Risk Further Downtrend
Other metrics like ADX and MACD print sell signals. The average directional index started its downhill movement last week as the bullish drive dwindled. Its downward trend indicates that the coin is sinking further into bearish dominance.
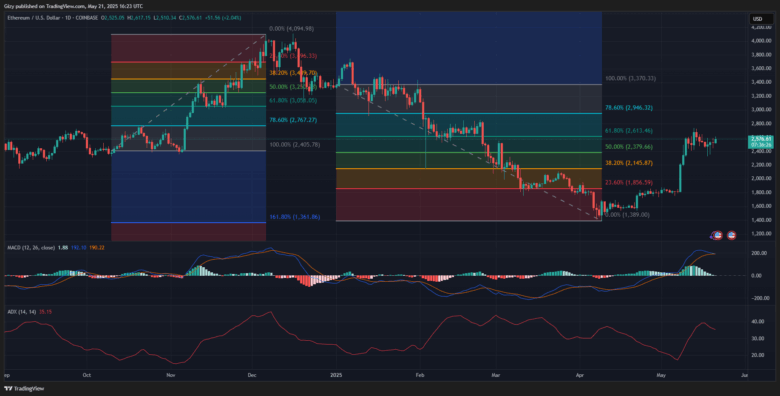
The moving average convergence divergence is on the verge of completing a negative crossing. The 12-day EMA is in contact with the 26-day EMA, hinting at a possible bearish divergence.
The last two highlighted indicators point to further downtrends in the coming days. Price movements over the last week support this claim as the asset saw more downward pull. Ethereum may dip lower, testing the $2,284 pivot resistance.
Failure to defend the R2 may cause the largest altcoin to slip low, veering closer to the first pivot resistance at $2k. Conversely, the asset may respond to the growing bullish sentiment across the market. It will decisively reclaim the $2,600 mark. The price level may be a launchpad for an attempt at the $2,800 resistance.
Find Cryptocurrencies to Watch and Read Crypto News on the Go Follow CryptosToWatch on X (Twitter) Now
