
SUI has seen notable increases in buying volume over the last seven days, resulting in significant price improvement.
SUI experienced significant selling pressure, which caused it to retrace its previous week’s low. The one-day chart shows that the coin met buybacks after the declines. The chart also points to a massive change in sentiment over the highlighted period.
This is the same trend across the crypto market. The sector saw no significant change in general sentiment, as the fear and greed index shows no notable change in reading. It remains neutral at 40.
The global cryptocurrency market remains below $3.20 trillion. The most recent declines saw valuation dip to $3.12 trillion as trading volume plummeted.
Maker is one of the top gainers amid the ongoing market trend. It opened the week at $989 and surged to a high of $1,638 before declining. It trades at $1,482 at the time of writing and may end the seven-day session with gains exceeding 50%.
FTM made waves a few days ago following its rebrand. Now Sonic, it saw a surge in its total locked value as it reached $500 million a few days after the name change. Nonetheless, it saw a 50% increase in price over the last seven days.
The crypto market still faces significant selling pressure. Let’s examine the performance of some assets in the top 20.
ADA/USD
ADA trades at the Bollinger middle band a few days after rebounding above the lower band. The one-day chart indicates that the coin has failed to continue above the middle band since testing it.
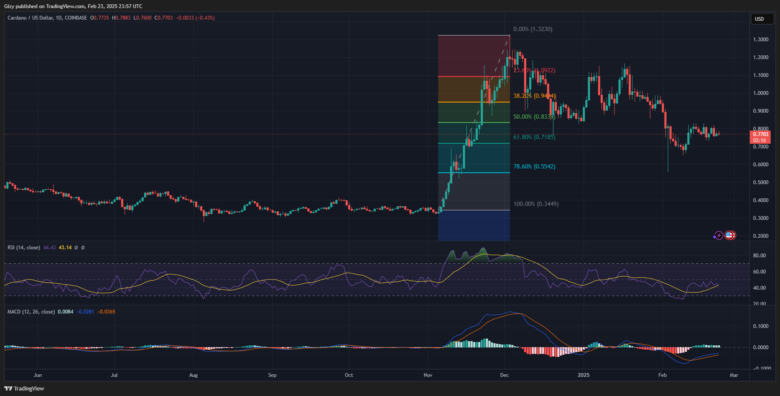
It remained in a rangebound movement over the last fourteen days and failed to break out due to weak buying pressure. Nonetheless, the altcoin tried breaking above its two-week high on Monday, peaking at $0.82.
It had one of its most significant declines on Tuesday, retracing from $0.81 to a low of $0.73 before a slight recovery. The uptick continued over the next two days, with Cardano erasing the losses and returning to its opening price.
Printing a red candle on the one-day chart shows that the same trend unfolds on the one-week scale. However, it is a doji.
TRX/USD
At the time of writing, indicators on the one-day chart are printing buy signals. One such indicator is the moving average convergence divergence. The 12-day and 26-day EMAs continue upward. However, the histogram shows a slight decline in spikes in selling pressure.
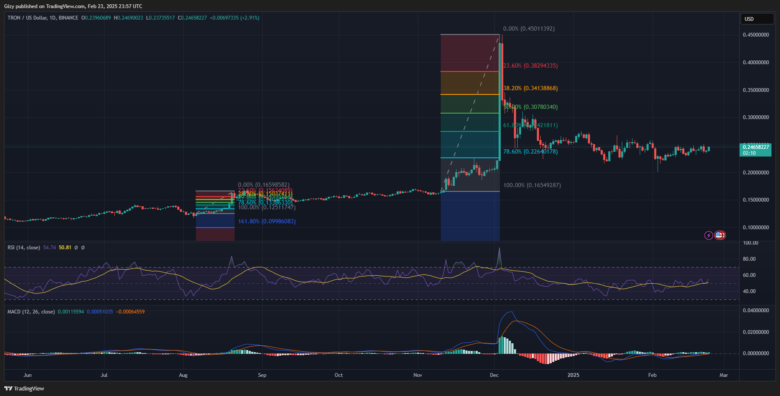
The reading is also visible on the relative strength index. The metric surged to a high of 53 on Thursday but dropped to 49 the next day. Nonetheless, it trades close to a level with significant demand concentration, the 78% fib level.
It remains in its rangebound movement over the last fourteen days. TRX failed to break above the $0.25 resistance but maintained trading above the $0.23 support.
The one-week chart points a decline in volatility as the reason for its failure to breakout. It prints its smallest candle on this scale for the first time in almost three months. Nonetheless, the candle comes after the asset retested the previous week’s high.
LINK/USD
The one-week chart shows that LINK is grappling with significant selling pressure. The bears staged selling congestion at the $20 resistance. It edged closer to the mark on Monday but experienced significant rejections at $19.7.
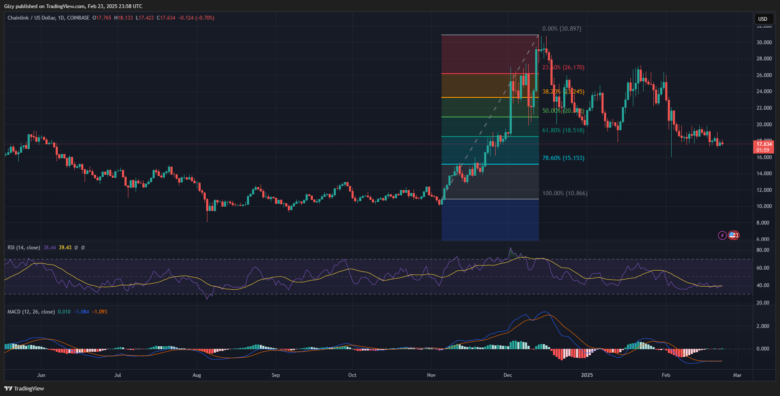
The coin had its most significant decline on Tuesday, dipping from $19 to $17.2. Although it saw a slight rebound, it ended the day with losses exceeding 6%.
Nonetheless, the coin is struggling at $17.5. It is down by over 6% on the one-week scale and continues its downtrend after a slight recovery the previous week.
The struggle for dominance between the bulls and bears continues as MACD has yet to display a clear signal. The 12-day EMA and 26-day EMA trended close to each other for most of the week. Nonetheless, the histogram is green, indicating that the bulls are edging.
SUI/USD
SUI maintains its uptrend on the one-day chart. The coin started its ascent on Wednesday and continued the trend the next day. Since surging, it held on to the $3.20 support and has not retraced below it over the last three days.
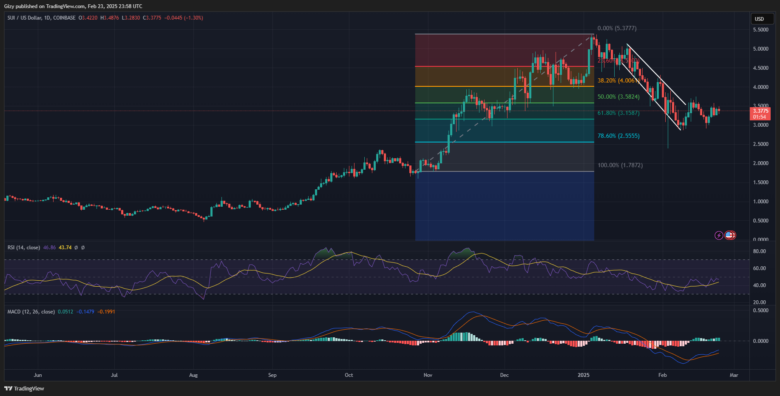
Nonetheless, the latest price increase started after the coin’s dip below the $3 mark on Tuesday. It dipped to a low of $2.91 before rebounding.
SUI prints a doji on the one-week scale but is up by over 2%. Indicators on the one-day chart remain bullish. The moving average convergence divergence continues an uptrend. The 12-day EMA surges higher, and the 26-day EMA follows behind.
AVAX/USD
At the time of writing, MACD prints bullish signals. Since its positive interception a few days ago, the 12-day EMA has continued upward and maintained the trend amid several declines.
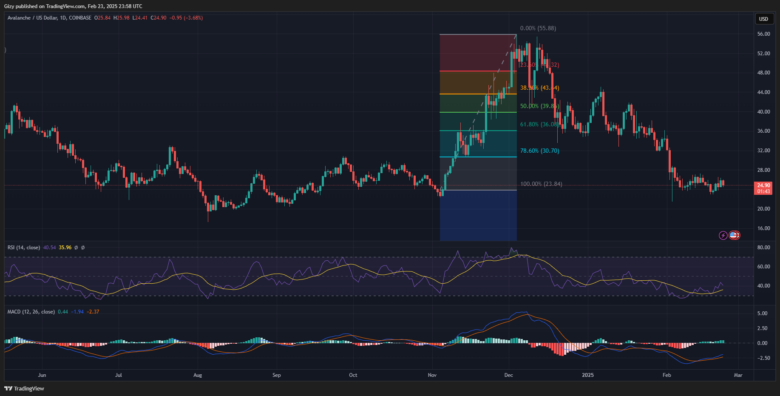
The relative strength index is rising in response to a steady increase in buying pressure. It started the week at 35 but is at 40. The latest reading comes as the cryptocurrency registers a notable decline, retracing from $25.8 to a low of $24.4.
It is down by over 3% over the last 24 hours. Nonetheless, the one-week chart shows the asset printing a doji. It displayed a similar candle last week after two weeks of massive dips. It holds on to the $23 support amid the selling pressure.
XLM/USD
Stellar Lumen remains rangebound like SUI. It failed to retest its fourteen-day high in the last seven days. Nonetheless, it surged to its highest on Thursday after a surge the previous day.
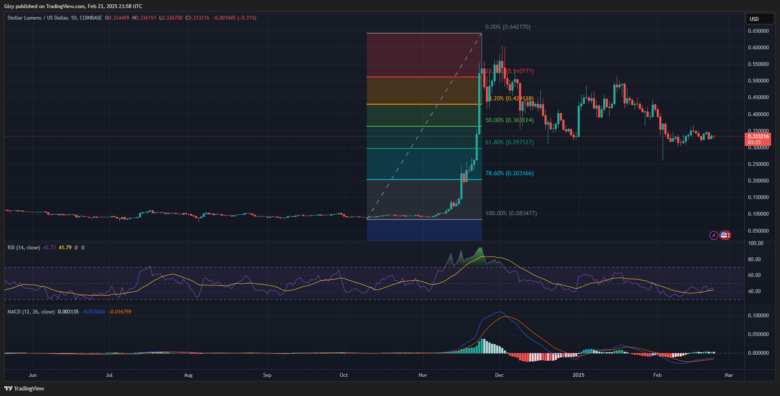
On Wednesday, XLM had its most significant bullish push when it opened trading at $0.32 and surged to a high of $0.342. It closed with gains of almost 6% in the end.
However, it has seen less trading volume and volatility over the last seven days. Nonetheless, the moving average convergence divergence displays buy signals. Since its positive interception a few days ago, the 12-day EMA has continued upward and maintained the trend amid several declines.
Find Cryptocurrencies to Watch and Read Crypto News on the Go Follow CryptosToWatch on X (Twitter) Now
