BNB and a few cryptocurrencies in the top 100 are on the uptrend. A look at the top 10 shows major assets grappling with small selling pressure. BNB received more attention as trading volume slightly increased.
The global crypto market cap sharply dropped a few hours ago, hitting a low of $3.28 trillion. Trading dropped by over 17% due to growing bearish sentiment. The fear and greed index is at 84, dropping from 90 the previous day.
Nonetheless, some altcoins are up by a notable margin. ENS shot up to $39 a few hours ago. It almost doubled in value during the previous intraday session, surging from $22 to $34. It is currently up by over 31%.
WLD may close the day as the top gainer. It started at $2.55 and surged to a high of $3. Up by 13%, it closes the second consecutive day with significant increases.
The crypto market is relatively calm regarding fundamentals. Nonetheless, some of the biggest concerns are CZ’s opinion on memecoins. He asserted that they are getting weird and called for more focus on utility tokens.
Volatility returned to the market, and several cryptocurrencies attained new heights. Here is how some in the top 10 performed.
BTC/USD
Bitcoin faced strong rejections at $96k a few hours ago. It started the climb closer to the mark and peaked at $96,658. It lost momentum, slipping to a low of $94,658. The coin failed to register any significant moves as it grappled with growing selling sentiment.

BTC is undergoing a cooldown following the previous day’s surge. It averted fears of a possible decline below $90k. Kicking off at $92k, it continued upwards, reclaiming the $96k barrier. It peaked at $97,353 and retraced afterward. Nonetheless, it registered over 4% increase.
Onchain indicators are split amidst the ongoing trend. Traders in the Asian market may be responsible for the ongoing decline. The Korea premium is currently negative, showing lesser buying volume against the selling pressure. Nonetheless, exchange reserves are declining. Deposits from cold wallets into these platforms increased by over 140% over the last 24 hours.
Indicators on the one-day chart are negative at the time of writing. RSI increased from 61 to 66 during the previous intraday session. It is at 64 as the accumulation and distribution chart suggests failure to soak up growing supply.
MACD print sell signals at the time of writing. It had a bearish divergence a few days ago. The 4% increase during the previous intraday session failed to have any impact on 12-day EMA. It continues its decline, hitting one of its lowest levels over the last seven days.
ETH/USD
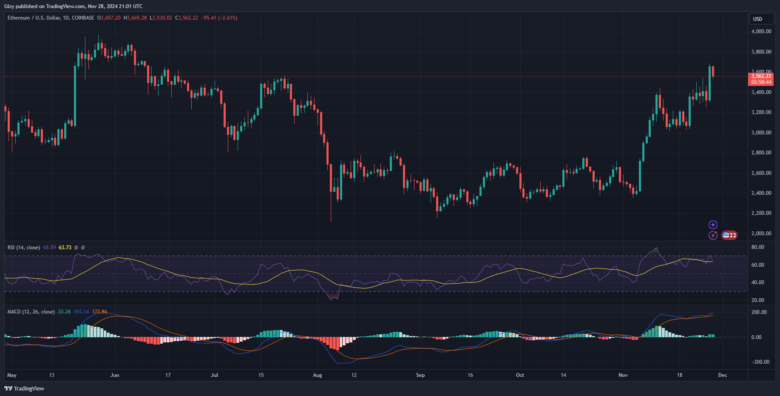
Ethereum had one of its biggest declines during the previous intraday session. It opened trading at $3,323 and surged, breaking its July high at $3,544. The uptick continued but halted $12 shy of $3,700. The bulls eagerly anticipated a possible retest of the $3,800. However, trading actions over the last 24 hours points to less buying volume.

The buyers showed signs of exhaustion as ETH failed to continue its surge. The current day’s candle shows the asset had a sudden spike in selling volume following its opening. Currently trading at $3,580, the coin is recovering from a slight dip. It is also down by over 2%.
The moving average convergence divergence prints buy signals amidst the small decline. The 12-day EMA continues its uptrend following the bullish interception a few days ago. However, it’s not at the same pace as the previous as the histogram bars remain the same.
RSI hit 70 during the previous intraday session as the asset slightly became overbought. It’s currently at 66. The metric reading is the same as the A/D that shows growing distribution. Nonetheless, the bulls hold on to the $3,500 support amidst growing bearish sentiment. ETH must continue above this critical level or risk a dip below $3,400.
SOL/USD
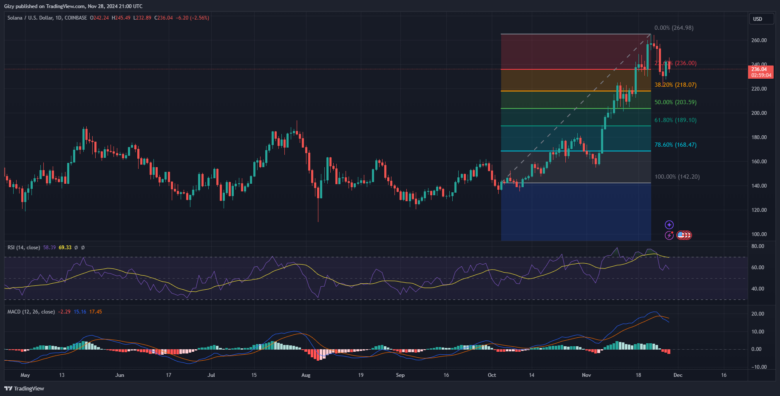
At the time of writing, Solana is grappling with massive selling pressure. It shows signs of recovery as it trades at $236 after its decline to $232. The coin dropped from a high of $245, signifying an almost 3% drop in value since the day started.

The asset is going through a cooldown following the previous day’s surge. It recovered from its previous four-day downtrend that saw it drop from $260 to $220. SOL lost a whopping 15% during this period. It gained over 5% following it surge from $230 to $243.
Indicators like RSI and A/D shows massive bearish actions. The asset’s relative strength index is currently neutral following its drop from 70 a few days ago. The selloffs continues with the metric at 57. Accumulation has significantly dropped over the last 24 hours more traders dump their bags.
MACD prints sell signals at the time of writing. It had a bearish divergence a few days ago. The 5% increase during the previous intraday session failed to impact the 12-day EMA. It continues its decline, hitting one of its lowest levels over the last seven days.
Traders fear a retest of the $220 support. Previous price movements suggest it served as strong resistance. It remains to be seen if it will break.
BNB/USD
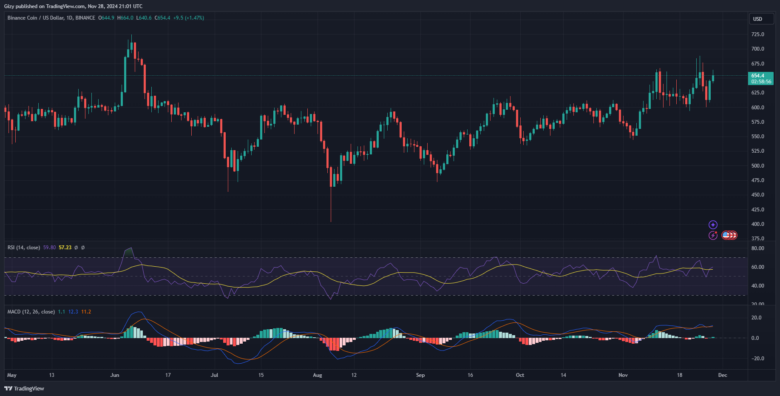
Binance coin is on the verge of another breakout but faced strong rejections, resulting in a notable decline. It currently trades at $649 after opening the day at $644. It peaked at $664 as it lost momentum. BNB may close the current session with no significant change in value.

Nonetheless, the reason for the latest change in trajectory may be due to the massive increase BNB saw during the previous intraday session. It started trading at $613, surging after a brief decline to $607. It surged, breaking above $640, and was $3 shy of $650.
The current-day price action suggests that the bulls are getting exhausted. The sharp decline following the peak suggests that BNB is grappling with massive selling pressure. A/D chart on the 1-day timeframe shows dwindling pressure at soaking up supply.
The relative strength index shows significant buying pressure during the previous intraday session, surging from 50 to 57. However, it barely moved by one figure over the last 24 hours. Nonetheless, the moving average convergence divergence remains positive amidst growing bearish sentiment. The 12-day EMA continues to climb following the bullish divergence during the previous session.
Previous price movement suggests that the stay above $640 may be temporary due to less demand concentration. BNB looks to hold $250 to prevent further slip.
Find Cryptocurrencies to Watch and Read Crypto News on the Go Follow CryptosToWatch on X (Twitter) Now

