SOL rose to a new all-time high during the previous intraday session. It maintained its spot in the top 10 after displacing the BN a few days ago.
The crypto market was largely bullish during this period but has lost momentum at the time of writing. Nonetheless, XLM continues its upward momentum with a bigger surge. It gained over 29% on Nov. 22, flipping its July high. It returned to its highest valuation as of May 2021, surging to a high of $0.55 but retracing to a low of $0.48 at the time of writing.
Polkadot received a significant boost from the bulls following the previous day’s 11% increase. It started the current session at $6.54, breaking May’s high of $7.80. It continued upwards, flipping $9, but lost momentum as it edged closer to $9.50.
Fresh investments flocked into the crypto market over the last seven days. Retailers are waking up as the Coinbase app surges up the IOS store. Phantom Wallet registered a similar milestone a few days ago.
New integrations from other sectors poured into the industry. Nonetheless, how did the assets in the top 10 perform over the last six days?
ETH/USD
Ethereum recovered from its decline two weeks ago. It had a bullish start to the previous week but changed trajectory on Tuesday and Wednesday. Many traders feared a drop below $3k. However, it resumed its uptrend on Thursday with one of its most significant surges.
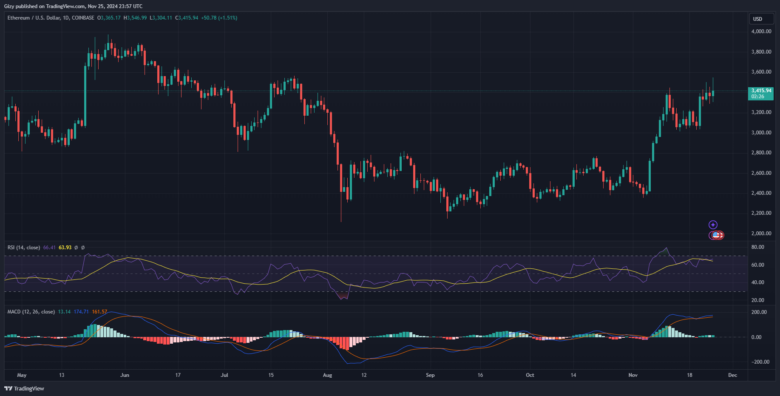
It opened trading at $3,072 and resumed after a brief decline. The bulls staged a buyback, pushing prices high. It reclaimed the $3,200 level, continuing upwards but retracing following a failed attempt at the $3,400 barrier. Peaking at $3,390, it closed with gains exceeding 9%.
It attempted to break the $3,500 barrier on Saturday but failed. ETH broke above the mark a few hours ago, hitting a high of $3,546 before corrections.
Indicators remain positive amidst the ongoing uptick. Last week, the moving average convergence divergence printed a bearish divergence but recovered and reversed the trend. The 12-day EMA is rising, and the 26-day EMA is doing the same.
The Relative strength index is at 67. The apex altcoin may see further increases before it breaks out above 70 and becomes overbought.
Onchain data shows that the asset sees notable buying pressure from the US. The Coinbase premium is currently positive. Traders in South Korea are also bullish, as indicated by the green Korea premium. The bullish sentiment spreads into the derivative market, causing a significant surge in funding rates.
SOL/USD
SOL surged to a new all-time high during the previous week. It happened on Friday when it recovered from a drop to $251. It surged to a high of $264, the new ATH. However, it closed with a doji, facing massive retracement following its peak.
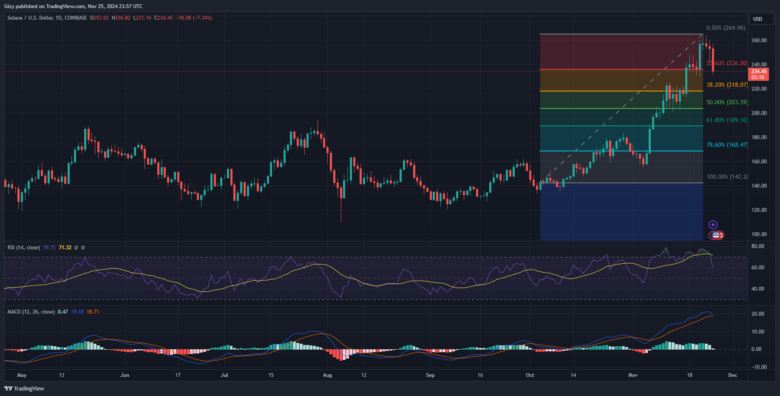
The altcoin had a buildup to the milestone on Thursday. It opened the day at $235 but dropped to $230 before rebounding. It broke above $250 for the time in years. SOL continued upwards, edging closer to $260, but failed to break it.
The coin has since been on the decline following its all-time high. The downtrend is currently on the decline. SOL opened the day at $253 and is trading at $240 after it dropped to a low of $233. Currently down by almost 5%, indicators are currently bearish.
MACD prints sell signals. The 12-day EMA is declining in a negative convergence. If the downtrend continues, it may intercept the 26-day EMA in the coming days. Nonetheless, RSI shows that the asset is not overbought at the time of writing; the metric is neutral at 63.
Previous price movements hint at the importance of $230 support. The bulls must defend this mark as a slip below it may send SOL as low as $210.
BNB/USD
Binance coin was mainly bullish last week. The main round started on Thursday when it started trading at $605 but dipped to $593. It rebounded and surged to a high of $630. The uptick continued on Saturday, with the asset at $633. It experienced a massive increase in buying volume, shooting prices above $650. It continued upwards, peaking at $683, but retraced due to massive selling congestion.
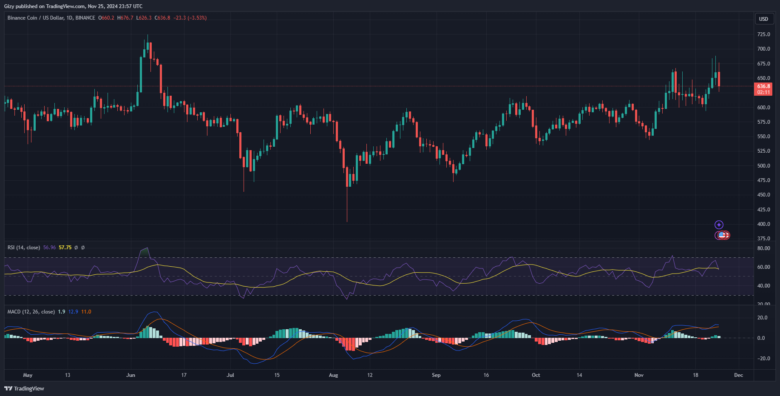
It had a similar movement on Sunday, hitting a high at $688. A few hours ago, BNB edged closer to the $680 resistance but faced massive resistance. It dropped to a low of $632 but is currently trading at $646.
Indicators remain positive amidst the ongoing uptick. Last week, the moving average convergence divergence printed a bearish divergence but recovered and reversed the trend. The 12-day EMA is rising, and the 26-day EMA is doing the same.
The Relative strength index at 60. The apex altcoin may see further increases before it breaks out above 70 and becomes overbought.
XRP/USD
XRP registered gains exceeding 36% last week. It accumulated most of the gains between Thursday and Friday. It started the fourth day of the week at $1.10, surged above $1.20, and peaked at $1.30. It closed with gains exceeding 12%.
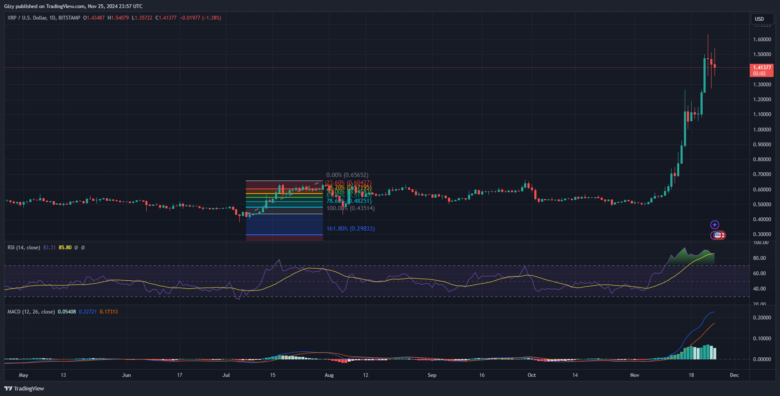
It had its biggest surge the next day, opening at $1.24. It surged to a high of $1.50 for the first time in over a year. Despite small declines, it closed with gains of almost 20%. The bulls tried to continue the trend the next day with limited success. The altcoin hit a high of $1.16.
It registered notable declines during the previous intraday session, dipping to a low of $1.27 after opening trading at $1.46. A few hours ago, it recovered from a low of $1.35. The bulls’ buyback is the reason for the asset’s 2% increase.
The moving average convergence divergence maintains its bullish stance. The 12-day EMA and 26-day EMA are on the uptrend. The relative strength index shows the asset experiencing massive buying pressure. It is at 86 at the time of writing, and XRP is overbought.
The momentum indicator points to an increasing bearish presence. The metric dropped 0.77 to 0.66. It remains to be seen how prices may react in the coming days. Nonetheless, previous price movements have pointed to a notable demand concentration of $1.20.
Find Cryptocurrencies to Watch and Read Crypto News on the Go Follow CryptosToWatch on X (Twitter) Now

