SOL is showing tremendous signs of recovery following the massive declines it experienced during the previous intraday session. However, the downtrend was not isolated, as other cryptocurrencies registered notable price downtrends during this period.
Apecoin started the session with a massive increase in buying volume, resulting in significant price surges. It was up by over 15%, breaking above $1.13, but retraced due to massive rejections. The dip continued until the memecoin retested the $1 barrier but rebounded and closed with losses exceeding 7%.
Another big loser during the previous intraday session was Arweave. It opened the session trading at $18.3 but faced massive correction following a failed attempt at surging. It dipped to a low of $15.2 before rebounding. It registered losses exceeding 12% amidst the slight recovery.
The global cryptocurrency market cap dropped by over 3% as bearish sentiment ravaged the industry. Tensions in the Middle East worsened trading conditions, resulting in downtrends.
Let’s see how the leading cryptocurrencies performed and are fairing at the time of writing.
BTC/USD
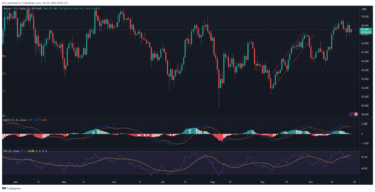
Bitcoin is down almost 3% on the weekly scale. It had a bad start to the week, as it registered notable losses on Monday. It opened trading at $69k but retraced after a failed attempt at retesting $70k. It dropped and lost the $68k support, hitting a low of $66,815 before rebounding. Nonetheless, it closed with losses exceeding 2%.

The decline continued on Wednesday as it dipped further, losing the $66k barrier. It continued downward until it hit the critical $65k. The bulls rallied the market as the coin fell to a level of notable demand concentration. It changed its trajectory and almost closed at its opening price. The uptrend continued into the next day as the apex coin had its biggest green of the week, gaining over 2%.
However, it lost all the accumulated gains during the previous intraday session, dropping to a low of $65,521 and losing over 2%. Currently printing a green candle, it is slightly up but has yet to register any significant improvements.
The moving average convergence divergence prints a sell signal at the time of writing, as it shows an ongoing bearish divergence. The 12-day EMA intercepted the 26-day EMA, which completed the negative convergence during the previous session.
The relative strength index shows the asset gaining momentum. However, it also hints that a contributing factor to the ongoing downtrend is that the asset was previously overbought. Currently at 57, the bull may gear up for a buyback.
ETH/USD
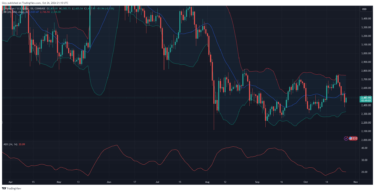
A closer look at the one-day chart shows Ethereum grappling with strong bearish dominance throughout the week. It started with notable losses on Monday, dropping by over with losses of almost 3%. It retraced from $2,745 and lost the $2,700 support before rebounding at $2,653.

The downtrend continued into the next day, as it registered another 2% decline. Wednesday was one of the worst days for the asset, as it registered one of the biggest price declines of the week. It briefly lost the $2,500 barrier, retracing to a low of $2,448, but rebounded and closed with losses of almost 4%.
ETH sank deeper during the previous intraday session, dipping below $2,500 again but hitting a new low. It briefly lost $2,400 and found support at $2,379. The bulls staged buybacks but failed to return prices above the opening price, resulting in a close with losses of almost 4%.
The RSI is at 46 after plunging to 41 on Friday. However, the average directional index is still declining amidst the ongoing buyback attempts. Bollinger bands show the altcoin making notable progress as it edges closer to returning above the middle band.
Nonetheless, MACD prints sell signals at the time of writing, as it shows an ongoing bearish divergence. The 12-day EMA intercepted the 26-day EMA, which completed the negative convergence a few days ago.
BNB/USD
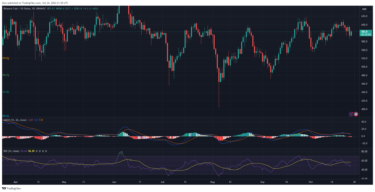
Binance coin closed the previous week on a bullish note, registering small gains, reclaiming $600, and peaking at $607. It tried continuing the trend on Monday but faced massive rejections at $611. It retraced to a low of $591 due to the ensuing sell-offs but rebounded and closed with small losses.

The downtrend continued over the next two days, with the asset hitting its lowest on Wednesday. It lost the $580 support and continued downwards until it rebounded at $572. The bulls staged a comeback that yielded a small result. However, the altcoin ended the session with losses of almost 2%.
Friday was another bearish day for BNB, as it sank to its lowest of the week. It opened trading at $594 but retraced, breaking the $570 barrier before seeing a buyback at $565. The day ended with losses exceeding 3% amidst the buybacks.
The RSI is at 50 after plunging to 46 during the previous intraday session. The average directional index is on the rise amidst the ongoing buyback attempts. Bollinger bands show the altcoin making notable progress as it edges closer to returning above the middle band.
Nonetheless, MACD prints sell signals at the time of writing, as it shows an ongoing bearish divergence. The 12-day EMA intercepted the 26-day EMA, which completed the negative convergence a few days ago.
SOL/USD
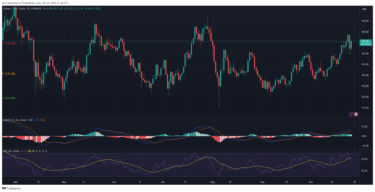
Solana is seeing notable increases at the time of writing. The bulls resumed buybacks, and it is a contender for the top gainer in the top 10s. It started the day trading at $164 but dropped to a low of $162. Currently trading at $172, prices show it experienced a massive spike in buying pressure, resulting in an almost 5% surge.

The latest spike comes barely a day after SOL registered one of its most significant losses. It retraces after a failed attempt at $180. It peaked at $177 but faced massive corrections, resulting in a slip below the $160 support. Although it slightly recovered, the day ended with losses exceeding 7%.
The relative strength index dropped from 72 to 57 in response to the massive spike in selling pressure. The bulls are gradually building momentum as the metric is at 62 at the time of writing. However, the average directional index is still declining amidst the ongoing buyback attempts.
The moving average convergence divergence is printing buy signals as the 12-day EMA changed its downhill movement in response to the ongoing buyback.
Find Cryptocurrencies to Watch and Read Crypto News on the Go Follow CryptosToWatch on X (Twitter) Now

