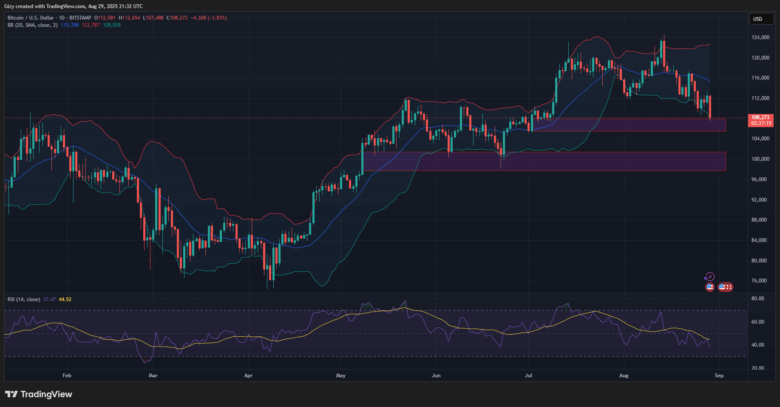
Bitcoin experienced a series of selloffs, causing its price to drop to a monthly low of $108,700 on August 27. The price was ranging around this value over the coming days, a stark contrast to the previous week.
At the time of writing this report on August 29, the coin is still experiencing a significant decline, down 3.99% for the day. The 4-hour chart tells the same story. Red candles dominate it as traders continue piling on the selling pressure. Technical analysis suggests that the apex coin may experience an even steeper decline as the week progresses.
The coin is on the verge of concluding the last 24 hours with a steep decline of over 4%, sinking to price levels unseen since April. Bitcoin rose to an ATH high of $124,480 before retracing to a current low of $107,878. Bitcoin has not fallen this low since July 4.
The cryptocurrency’s current downtrend was unexpected, as many had predicted an uptrend following previous losses. The dip was also shrouded in some controversy, as traders accused whales of market manipulation.
Meanwhile, the BTC derivatives market is buzzing with activity, with traders choosing to hold their positions. Over the last 24 hours, traders have incurred losses exceeding $543 million, with bullish positions suffering the heaviest losses at $449 million. Bitcoin also experienced the second-largest wave of liquidations, erasing over $149 million in value.
Speculations are flying about what really caused the BTC dip. U.S. President Donald Trump announced a reenactment of tariffs on Friday, albeit on low-value imported shipments.
Concerns over PCE
The Personal Consumption Expenditures (PCE) is a metric the Federal Reserve uses to track inflation. The latest core PCE data, released Friday, showed July inflation climbing to 2.6%, matching market expectations but still raising concerns over persistent price pressures.
Nonetheless, core PCE inflation climbed to 2.9%, its highest level since February 2025, signaling renewed upward pressure on prices. Ordinarily, the figures recorded would cast doubt on the likelihood of a September rate cut; however, analysts remain confident that it is inevitable.
Fears of inflation in the prices of several commodities, alongside the latest tariffs, are causing panic selloffs across the crypto market.
Bitcoin Has a Higher Chance of Rebounding
BTC’s 24-hour chart reveals that the coin is seeing some slight bullish buybacks. However, the buybacks do not show a path to an uptick as the threat of further declines remains high.
Additionally, the chart indicates that Bitcoin is consolidating within a demand zone between $105K and $108K. Notably, the asset briefly broke above this range in early July, suggesting that another rebound from this level is likely.

Bitcoin’s bollinger bands are further indication of a possible pullback. It recently surged past the indicator, suggesting a potential uptrend may be on the horizon.
Furthermore, Bitcoin could see a further slide toward the next support zone between $98K and $100K if bulls fail to hold this level. The Relative Strength Index (RSI), currently at 37, suggests that the coin may continue to experience downward trends.
Conversely, BTC may face significant selling pressure around $110K if there is a possible rebound in the future.
Find Cryptocurrencies to Watch and Read Crypto News on the Go Follow CryptosToWatch on X (Twitter) Now

