Bitcoin retraced to levels not seen in over a month as it continues Sunday’s descent. It shows no signs of changing its trajectory at the time of writing as the selloffs continue.
The apex coin had one of its biggest declines on Sunday, retracing from $115,626 to a low of $110,671. Although it ended the session a little close to its opening price, trading actions on Monday indicate that the selling continued.
The 4-hour chart shows that the coin had a significant decline earlier that resulted in losses of almost 2%. The chart also shows that while the decline reduced, the apex coin registered notable losses during the first 12 hours of the day.
However, it saw a slight pullback a few hours ago. It resumed the downtrend, seeing a deeper correction. The current candle shows that the asset dropped to a low of $109,437 from $112,943 and is down over 2% in the last 8 hours.
Liquidation data shows that the bulls are bleeding. Reports from Coinglass indicate that traders lost over $729 million in the last 24 hours, and more than 80% of these losses were from longs. However, these participants lost over $128 million trading Bitcoin.
Long positions from the total liquidations were $109 million, but Glassnode noted that this figure is smaller than the losses incurred by traders on Sunday. Liquidated longs were $150 million, the highest since Dec 2024.
Bulls Score Flips Bearish
Reports from CryptoQuant show that an important metric flipped bearish. The Bitcoin Bull Score Index is at 40, indicating that the market is becoming more bearish.
On Aug 21, a technical analyst noted that the index retraced from 70 to 50, switching from bullish cooldown to neutral. He warned that the switch may result in further softening of the market, resulting in further price declines.
True to the statement, several events took place that caused massive price declines. Trading actions on Friday were largely bearish as institutional selling pressure increased. It is worth noting that many companies hold BTC exchange-traded funds instead of the actual coin. US spot ETFs saw outflows of up to 4.2k BTC, causing prices to retrace before the Fed news.
The downtrend continued over the weekend and worsened on Monday. The bull score index is now at 40, suggesting that there may be massive corrections ahead.
Data from Coinglass shows that some traders are following this indicator. The number of shorts outweighs the longs 51% to 48%. However, the bulls are pushing back as they increased the number of long positions, outweighing the shorts 54% to 45% in the past hour.
Bitcoin Eyes $105k
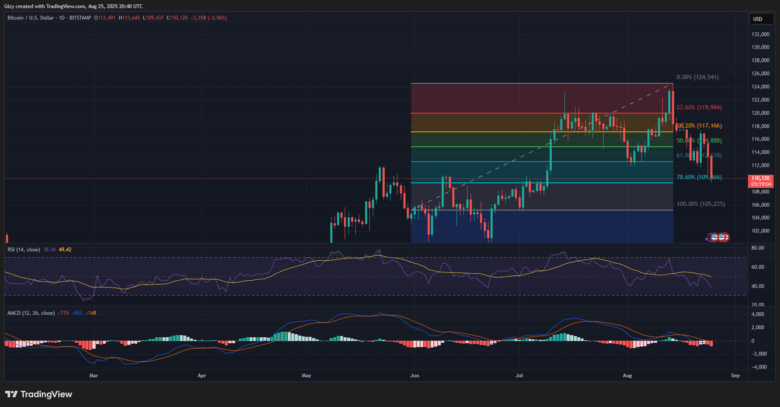
Indicators on the 1-day chart are largely bearish at the time of writing. A closer look at the moving average convergence divergence prints more sell signals as the histogram prints longer red candles. Additionally, the relative strength index remains in a downtrend as selling pressure increases.

The fibonacci retracement levels indicate that Bitcoin is trading at a level with notable demand concentration. The coin needs to hold this level, as losing will result in a possible drop to the 100% mark at $105k.
Nonetheless, the bollinger bands show a likelihood of rebound at the current price. Bitcoin is trading at the lower band, which traditionally may indicate the end of the downtrend.
Find Cryptocurrencies to Watch and Read Crypto News on the Go Follow CryptosToWatch on X (Twitter) Now

