
Bitcoin experienced considerable upward price movement, concluding the second quarter of 2025 with a notable improvement. The apex coin recorded significant gains this quarter, offsetting the losses of the previous one.
The coin experienced impressive growth in January, hitting 109k, its all-time high, following news of Trump’s U.S. presidential election win. However, it failed to sustain the momentum for the next three months, falling by over 11% at the end of the quarter and recording a low of 76k.
Trump’s tariff policies further worsened the situation. The measures, along with the resulting trade tensions, sent shockwaves across the crypto market and triggered panic selloffs. The downward trend persisted through March, further fueling market uncertainty among traders.
The drama continued into April, causing Bitcoin to dip further to a low of $ 74,000. However, the downturn was halted as the tariffs were gradually rolled back. As a result, Bitcoin rebounded, closing April and May with gains of over 14% and 11%, respectively. It is also poised for a similar positive closing this June.
This first quarter marked major milestones and intense activity for Bitcoin. The coin hit a new ATH this quarter, reaching a new all-time high of $112,000 on May 22, following two consecutive days of strong upward momentum. However, it has struggled to retest its highs due to negative market fundamentals.
Institutional investors remained unfazed by the pullback, continuing their aggressive accumulation strategies, with Microstrategy taking the lead. The organization intensified its Bitcoin purchase strategy, expanding its Bitcoin holdings to 597,325 BTC, valued at $64 billion. Metaplanet also joined the accumulation frenzy, with its recent 1,005 BTC purchase bringing its total to 13,350 BTC.
Exchange-traded funds also significantly contributed to the uptick in buying pressure, as Bitcoin ETFs recorded a $12.7 billion net inflow, surpassing the Q1 figure.
Bitcoin Heads into the Third Quarter
Based on previous data, Q2 is historically the most bullish period for Bitcoin. It gained an average of 150% during this period, so it’s no surprise that it ended the quarter with profits totalling over 30%.
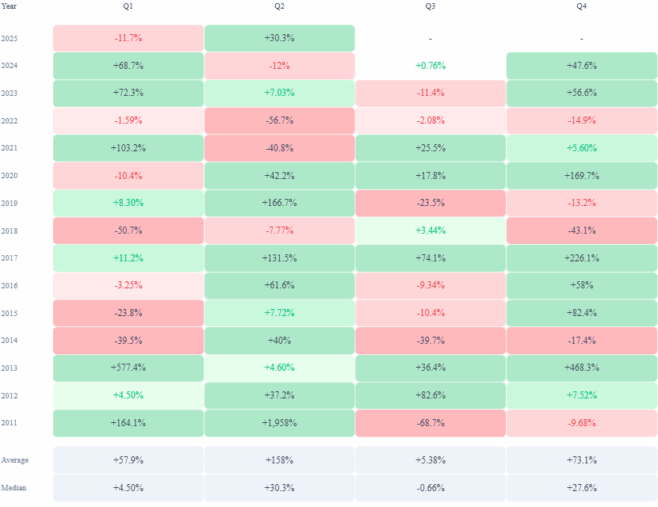
However, Q3 presents a stark contrast. Bitcoin historically underperformed during this period with very little bullish momentum. On average, the coin records gains of 5%, making Q3 its worst-performing quarter. Its highest gain was in 2012, when it surged by over 82%. Previously, it had lost 68% in Q3 of the previous year. The coin also lost 11% that same quarter in 2023.
The current market still suggests an extension of Bitcoin’s bullish momentum, which may alter the predictions. However, records suggest that the coin may have experienced significant losses during this period. If that happens, investors might pull back in anticipation of the dip.
A closer look at the chart reveals that BTC has registered three consecutive bearish Q3 performances, with 2024 being the exception. As Q3 unfolds, the likelihood of another negative market in 2024 is increasing.
Furthermore, the 3-month chart strengthens the case for a potential pullback. Bitcoin tends to retrace after breaking above the upper Bollinger Band, a pattern observed multiple times, including in 2021. The most recent example came in 2024, when the apex coin surged past the band only to retreat below it in the following quarter, suggesting a recurring pattern. Currently, BTC trades above that same indicator once again, suggesting a potential repeat of this pattern.
That said, a bullish outcome isn’t off the table. Bitcoin has seen two green Q3s historically, including a modest gain in 2024. Investors are hopeful that it will continue into this year.
A Slightly Bullish Month
Despite June ending on a positive note for Bitcoin, it’s still the least profitable month of Q2. The coin recorded a measly 2.2% increase this month, the third least in 2025.
An overview of Bitcoin’s monthly return profile explains the subdued performance. June has historically been its least profitable month in the first half of the year, with an average gain of just 7%. Even January outpaces it, typically closing with returns above 9%.
The one-week Bitcoin price chart was not particularly convincing, with sharp losses amid fears of tariff increases this week. However, the candle closed as a doji, indicating potential signs of a shift in momentum. Bitcoin ended the third week 4% down before rebounding last week.
The fear over the possibility of a world war when Israel and Iran began conflicts in mid-June led to a market frenzy that resulted in massive selloffs.

For most of the month, Bitcoin moved sideways in a tight range, battling volatility as a result. The one-day chart reveals a story of quiet consolidation until a sudden breakout, in contrast to May’s steady and consistent climb.
The monthly returns chart clearly shows that May outshone June. Bitcoin typically posts average gains of 19% in the fifth month—a stark contrast to the more subdued performance that tends to follow the next month. ETFs also recorded significant inflows during this stretch, with over $4.5 billion pouring in over the past 30 days.
Bitcoin Outlook for July
Bitcoin is expected to experience a price increase this July. This is especially true as the past week ended on a calmer note, with tensions between Iran and Israel gradually easing.
Notably, investors are keenly observing several events planned for this week. One such event is the EU releasing its CPI, and the other is the U.S. releasing its jobless claims after this week. Both events will significantly impact the market and determine its movement upwards or downwards.
A potential downturn would be very brief, notwithstanding that July is historically a bull month. Bitcoin performed slightly better this month than in June, gaining an average of 8% compared to June’s 7%.
The one-day chart suggests a potential shift, with Bitcoin currently hovering above the Bollinger midline and eyeing the upper band near $110,000. Historically, touching this resistance level has often triggered sharp pullbacks—a pattern that, if repeated, could send the price tumbling below $100K. Still, the possibility of a breakout cannot be ruled out. If bullish momentum builds, BTC could break through and rally past $ 115,000 in July.
Find Cryptocurrencies to Watch and Read Crypto News on the Go Follow CryptosToWatch on X (Twitter) Now
