
Bitcoin opened the day at $117,833 and peaked at $118,904. However, it trades at its opening price as it heads for yet another day with no significant increase. A close at the current price will see it mark its 3rd consecutive day of printing a doji.
Nonetheless, the coin is still positive on the one-month scale. It is seeing a perfect start to Q3, a quarter known for low price improvement.
Historically, the apex coin gains an average of 8% every July. It continues this trend with its over 10% increase in the last 30 days. This marks a big change from the previous month’s action that saw it gain a little above 2%.
The latest increase was predicted in a previous outlook that hinted at a surge above $115k. The analysis noted the increasingly positive stance of geopolitical events. One such event is the US trade war that ended last month.
It stated that with the trade war over, the crypto market will register a notable increase. It also cited the role of fundamentals in July.
True to these words, several bullish events took place over the last 30 days, including the signing of the CLARITY and GENIUS ACT. It is worth noting that the days leading up to the official signing, BTC saw significant increases as investors were optimistic.
Aside from the legislative actions, the coin also saw a spike in institutional buying pressure. One such is Matadel Technology’s ink. The company recently announced that it plans to raise $657 million to boost its Bitcoin treasury.
It will raise this surge through the issuance of common shares and other securities on the Canadian provincial exchange, Quebec.
Strategy continues buying Bitcoin, with its latest acquisition of 21,021 BTC for $2.4 billion. The firm announced that it purchased the coin using the proceeds from its initial public offering of over 28 million shares.
Another big buyer in the last 30 days is MARA Holdings. The company announced that it completed a $950 million private offering of 0-interest convertible senior notes.
Per the announcement, it plans to use it for Bitcoin acquisitions. Nonetheless, the firm currently holds 50,000 BTC.
Bitcoin Breaks Above $120k
The consistent accumulation from these large institutions resulted in massive increases in the coin’s value. The 1-week chart showed that the asset attained various critical levels over the last 30 days.
In the week starting July 7, the coin surged from $109,231 and broke above $112,000, a few weeks after it attained the previous ATH. Nonetheless, a decline to $107,000 was rebounded afterwards. It continued upward as the week progressed, breaking above $115k, but faced massive rejection at $119,482, resulting in a slight downtrend afterwards.
The candle representing the following week’s trading action was relatively smaller as the apex coin saw reduced volatility. Nonetheless, it broke above $120k and surged to a high of $123,234, registering its new all-time high.
However, it lost momentum after this milestone, resulting in a drop to a low of $115,729. It rebounded and closed with losses of almost 2%.
The bulls attempted to continue the uptrend the next week but failed as the asset consolidated for most of the session. Nonetheless, it registered slight increases.
Currently, the apex coin has yet to register any significant increases in the last 4 days. A close at its current price will continue its 3-week trend of consolidation.
Nonetheless, another contributing factor to the notable increase in price is the Bitcoin Spot ETFs. Investors bought a total of $6.13 billion in July alone, bringing their total net assets to $151.3 billion.
It had the highest inflow into the week starting July 11, as it registered the net influx of $2.72 billion.
Bitcoin Heads into August
Historically, Bitcoin sees significant losses during the 8th month of the year. It is the second most bearish month.

The image above shows that Bitcoin registers an average of 0.23% in losses every August. A look at the previous movement shows that in the last 14 years, the Apex coin registered notable losses in 9 years.
It had its biggest loss in 2011, when it declined by 32%. On the other hand, it recorded its largest increase by over 63%.
The presented data suggests the high likelihood of massive losses this year. Additionally, a closer look at the previous trend indicates that trading conditions worsened during the 8th month of the year, almost doubling the losses of July.
This trend held over the last 3 years, as BTC gained over 3% in July but lost a little over 8% the next month.
In 2023, the asset ended the 7th month of the year with losses exceeding 4% but declined by 11% the next month. The trend played out again in 2022, when Bitcoin gained 17% but lost 14% in August.
A repeat of these trends may result in a 10% decline in the next 30 days.
BTC Will Drop Below $110k
A closer look at the 1-week chart shows BTC has lost momentum as it consolidated for most of the last 3 weeks. The relative strength index reveals that the apex coin was overbought 2 weeks ago.
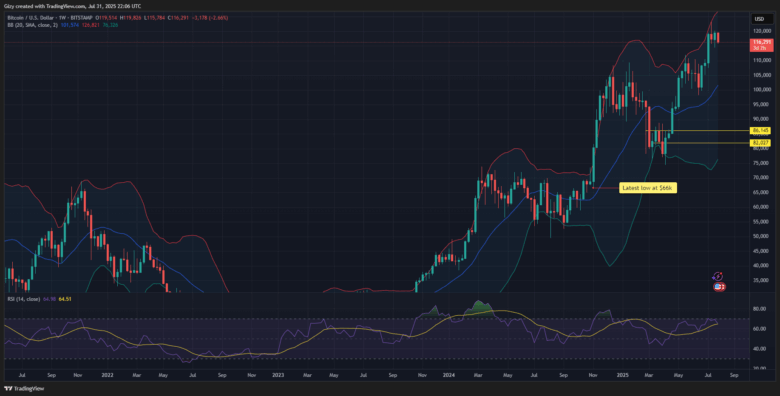
However, the metric is at 67 after 3 weeks of consistent downtrend. Previous movement suggests that the metric will drop lower, and prices will follow with the impending rise in selling pressure. Bitcoin is sure to see several periods of massive sell-offs.
The Bollinger band supports this prediction of an impending decline. It is worth noting that the asset broke above the Bollinger’s upper band a few weeks ago.
Previous price movement suggests that after it retests the upper band, the coin will drop to as low as the middle band. This will guarantee a retest of the $110k support.
Previous price movement suggests notable demand concentration around $115k. The bulls will attempt to defend this mark.
Additionally, if the buyer fails to defend the $115k mark, it may result in a drop to $104k.
Find Cryptocurrencies to Watch and Read Crypto News on the Go Follow CryptosToWatch on X (Twitter) Now
