Bitcoin is down by over 3% at the time of this writing. It is unable to continue the uptrend, and investors have become increasingly bearish.
Onchain data shows massive wallet movement from wallets over the last 24 hours. The slight increase in exchange reserves tells about the ongoing sentiment. These trading platforms also recorded a notable rise in coins deposited during this period, indicating a growing selling pressure.
A look at the unrealized profit and loss shows a vast number of wallets in profit. As the market anticipates more selloffs from these wallets, fears of further declines increase. Others are trading off their bags as the aSOPR shows massive profit-taking.
The asset also sees massive outflows from critical regions. One such is the United States. It was one of the leading regions in the previous short burst but is bearish at the time of writing. The Coinbase premium is negative; traders dump their assets. This is the same sentiment in the Asian market as they take profit, resulting in a negative Korean premium.
Miners joined the frenzy with a notable hike in trading volume. The selling pressure resulted in the liquidation of over 56 million long positions, which amounted to over $60 million. Selling sentiment remains dominant in the derivative markets as more sell orders are fulfilled.
Nonetheless, bullish traders expect a rebound anytime soon as they strengthen their positions to avoid liquidations. Others opened new trades, and the open interest surged by over 92% in the last 24 hours. Funding rates increased due to increased activity in the market.
Bitcoin May Drop to $66k
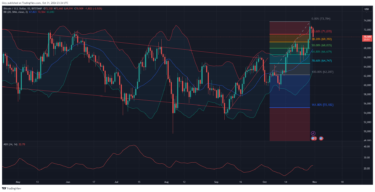
Bitcoin prints bearish signals on the 0ne-day chart. Indicators like the moving average convergence divergence are negative at the time of writing. The 12-day EMA is on the decline following its previous surge. Previous declines resulted in an interception with the 26-day EMA, and it may play out the same way this time.

The Bollinger bands explain the reason for the ongoing declines. BTC peaked above the upper SMA on Tuesday and ended the day above it. When an asset attains this feat, price declines are bound to follow, and the unfolding downtrends are a result. Currently trading at $70k, it is closer to the middle band and may rebound soon.
The relative strength index is declining as selling pressure mounts. The accumulation/distribution mirrors this movement as accumulation decreases. ADX is on the decline as the uptrend hits brick and loses momentum.
Bitcoin recently tested the 38% Fibonacci retracement level at $69,400 but rebounded. Previous price movement shows the apex almost certainly tested the middle Bollinger band after breaking above the upper. If that plays out this time, it may drop to the 50% fib level at 68k. Nonetheless, it may slightly slip below it, putting the 61% level at $66,600 in view.
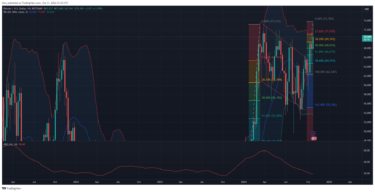
A surge during the first half of November is almost inevitable, as the one-week chart is mostly bullish. MACD on this timeframe showed a positive divergence a few weeks ago. The latest event is significant as the previous bearish interception resulted in losses exceeding 24%.

Three weeks ago, the apex coin gained over 9%. It broke out from a downward channel that started in March. Such a breakout will spell further price increases in the coming days, and November may be more bullish than the present.
Considering the 24% increase during the previous interception, a new all-time in November is almost inevitable.
Ethereum Flips Bearish
According to onchain data, there has been a significant amount of wallet movement over the past 24 hours. The slight rise in exchange reserves provides insight into the current mood. Coin deposits on these trading sites also increased noticeably around this time, suggesting that selling pressure was intensifying.
There are also significant withdrawals from impessentialcations from the asset. The United States is one example. Although it was among the top locations during the last brief surge, it is currently bearish. Traders dump their assets because of the negative Coinbase premium. The Asian market shares this opinion as they profit, which causes the Korea premium to decline.
At the time of writing, exchange-traded funds are experiencing massive outflows, exceeding $5 million, which has resulted in the fund premium becoming negative. Nonetheless, over 41 million long positions totaling more than $30 million were liquidated due to selling pressure. As more sell orders are fulfilled, selling sentiment continues to dominate the derivative markets.
Ethereum is currently trading down by almost 6%. It started the day at $2,658 but saw massive corrections following a failed attempt at surging. It lost the $2,600 barrier but rebounded at $2,500.
ETH Will Recover
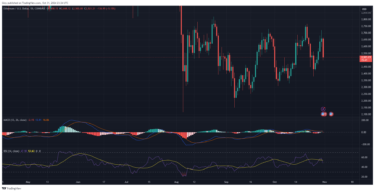
The current price mimicked Friday’s. ETH fell further, falling below $2,500 once more but reaching a new low. It gained support at $2,379 after momentarily losing $2,400. The bulls attempted buybacks but were unable to raise prices beyond the opening price, leading to a nearly 4% loss at the close.

The RSI dropped to 41 on Friday and surged to 46 the next day. Nevertheless, despite the continuous buyback attempts, the average directional index continued falling. According to Bollinger Bands, the altcoin was making significant strides as it got closer to rising over the middle band.
Nonetheless, after that massive dip, price action showed that the apex altcoin recovered and gained over 10% over the next five days.
One key highlight happened during the previous intraday session. ETH printed a green candle amid the increasing selloff in the cryptocurrency market. It began the day at $2,638 and dropped slightly to $2,598 before rising again and surpassing the $2,700 mark.
Indicators are currently negative and show that the downtrend may continue during the first three days of November before significant increases.
Find Cryptocurrencies to Watch and Read Crypto News on the Go Follow CryptosToWatch on X (Twitter) Now

