
Bitcoin dipped below the $100k mark on Monday, continuing its descent from Sunday. It dipped again and rebounded to $97k.
The coin opened Monday at $102,573 but faced massive selling pressure following its opening, resulting in a dip to $97,750. The coin rebounded and closed at its opening price. It tested the $100k support again on Tuesday but rebounded.
BTC ended its four-day downtrend on Wednesday. It surged from $101,291 to a high of $104,769, then lost momentum and retraced. The next day, it edged upwards, breaking above the $105k barrier and peaking at $106,447.
The apex coin grapples with significant selling pressure on Friday, erasing the previous day’s increase. It peaked at $106k but retraced and trades at $103,300 at the time of writing. The latest declines see the speculation of a dip below $100,000 increase.
The Bulls Hold Steady
Data from CryptoQuant shows the bulls maintaining to sustain the buying pressure. Exchange reserves slight decreases in response to the small buying pressure. However, the current price action fails to reflect this. This may be due to the massive increase in investors dumping assets into exchanges. The number of coins investors moved into these trading platforms increased by over 180%.
At the time of writing, the number of traders taking profit is almost 3% higher than the previous day. Active wallets declined by 36%, as transactions saw similar losses. Nonetheless, the transfer volume increased by over 19%. Long-term holders are moving fewer assets, indicating renewed faith in the coin’s prospects.
US investors remain bullish amid the declines. The Coinbase Premium is positive. However, their buying pressure is significantly lower than the previous day. The positive fund premium indicates notable inflows into ETFs and other Bitcoin products.
However, the Korea Premium is negative as Asian traders exhibit more selling pressure. Their sentiment coincides with the bearish state of the derivative market. The taker buy-sell ratio is below 1. Open interest dropped by almost 3%.
Bitcoin May Slip Below $100k
The one-day chart shows some indicators flipping bearish due to the ongoing selloff. The moving average convergence divergence prints sell signal at the time of writing. It displayed the reversal of its previous negative interception during the last intraday session. However, the bearish convergence is underway as the 12-day EMA dips lower.
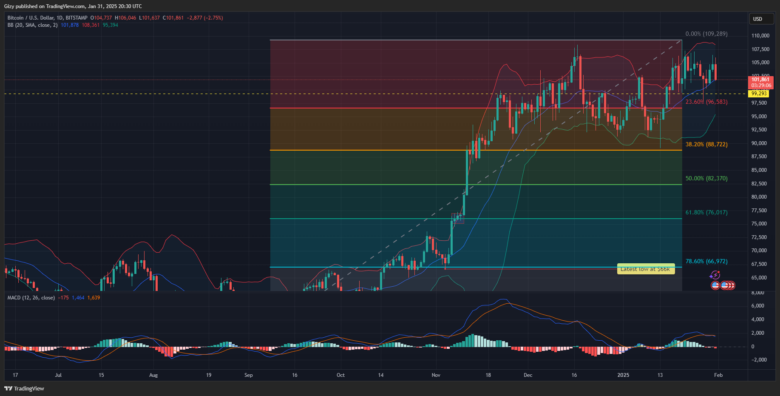
The Bollinger band showed that the coin broke above the upper band a few days ago. Previous price movements suggested that BTC dipped below the middle band and veered closer to the lower band before rebounding. The assets surged, halting that trend. However, following the almost 3% dip, the trend may be in full swing.
The relative strength index is declining in response to the latest price action. It is at 52 after dipping from 58 the previous day.
If the bulls fail to resume the uptrend, the coin may slip lower. The Fibonacci retracement level reveals that Bitcoin is trading above the 23% level. If the downtrend continues, it hints at a possible decline to $96k. Nonetheless, previous price movements point to notable demand concentration around $100k and $97k.
The coin rebounded at the 50-day exponential moving average. The same may happen in the coming days.
BTC Gains 9%
As January ends, investors reflect on how Bitcoin performed in the last thirty days. It opened the month at $93,347 and experienced a massive decline earlier in the session.
It had a three-day decline that started on Jan. 7. The coin lost over 5% as it dipped from $102,278 to $96,100. It lost almost 5% over the next two days. It had a slight rebound before another massive retracement.
The cryptocurrency opened on Jan. 13 at $94,498. However, it experienced a massive sell-off that saw its price lose the $90k support. It rebounded at $89,164 and shot up, erasing all its losses. After the dip, BTC resumed its uptrend and peaked at $109k a few days later.
Bitcoin grappled with a spillover of the previous month. The news of expected inflation in January caused may investors to panic, resulting in massive selloffs. The days leading up to the CPI release were filled with notable uncertainty, resulting in a dip below $90k.
Nonetheless, news of a positive CPI improved the bullish sentiment across the market. The coin received a further boost from the news of Donald Trump’s inauguration.
Looking Into February
The 9% gain in January sees the coin grapple with selling pressure . The sentiment across the market remains relatively calm as investors called the start of a bulll run during the previous intraday session but are silent at the time of writing.
Data from Santiment indicates that discussions across social media platform about crypto is low. There is no FOMO about Bitcoin, resulting in higher uncertainty. Nonetheless, the blockchain analytic platform asserted that the reason for the calm may be because the asset is recovering from a previous decline.
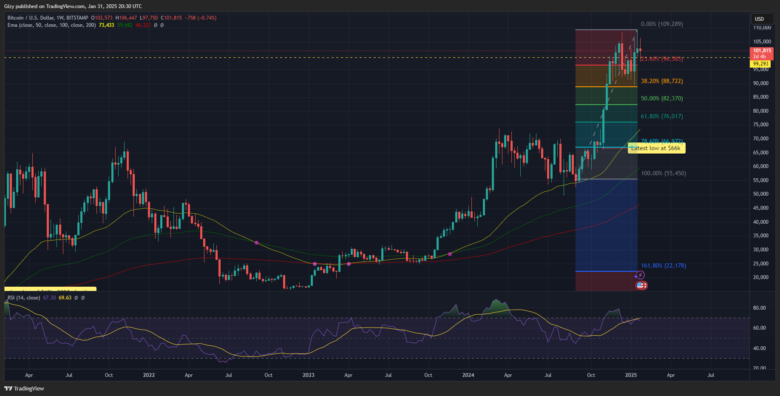
The one-week chart reveals that the apex coin may see notable declines in February. The relative strength index is at 67, indicating that a sudden uptrend may result in the asset becoming overbought. This is not the first BTC is becoming overbought on this timeframe. It may continue upward amid calls for corrections. This may guarantee a new all-time high.
Find Cryptocurrencies to Watch and Read Crypto News on the Go Follow CryptosToWatch on X (Twitter) Now
