ETH leads the altcoin market in an ongoing downtrend. It dropped to a level it broke in November and is grappling with massive bearish sentiment.
Ethereum’s price reflects the ongoing trend across the crypto market. On Monday, the fear and greed index further declined, showing significant bearish sentiment. The global cryptocurrency market dropped from $3.33 trillion to $3.14 trillion before rebounding. This comes as selling pressure increased, but trading volume fell by 8%.
The latest decline left many investors wondering what caused it and when it will end. No bearish fundamentals in the last 24 hours could have caused so much panic. However, it is worth noting that it is CPI week, and the market is geared for a possible negative release.
Reports on last week’s treasury yield increase and its effect on global liquidity may still be active at the time of writing, causing further declines.
Nonetheless, Santiment reports that the volume of cryptocurrency trading has decreased significantly as the markets have been covered by trading paralysis. A low activity level may indicate FUD, which increases the likelihood of price rebounds. Will the rebound happen this week?
Top Five Cryptocurrencies
BTC/USD
Bitcoin is off to a bad start but remains fairly positive onchain. Data from CryptoQuant shows that miners are no longer selling. The Binary CDD, which shows the activity of long-term holders, is positive, indicating less movement from this group of investors. The low movement may hint at an impending trend reversal in the coming days.
However, exchange reserves are on the increase. Slightly up by a few percent, the metric shows more investors moving their assets from cold storage to exchanges. This action indicates ongoing selling pressure and a possible continuation of the trend.
Traders in the US show weaker sentiment, as indicated by the Coinbase premium. The Korea premium suggests that South Korea traders may be major players in the ongoing downtrend. The selling pressure from this region almost doubled in the last 24 hours.
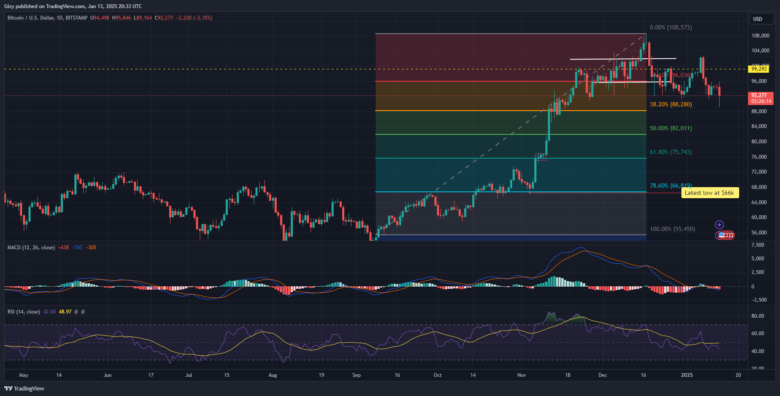
Indicators on the one-day chart show the apex stuck below $96k. A few hours ago, it attempted the mark but faced massive rejections, resulting in an enormous decline below $90k. BTC hit a low of $89,167 before rebounding.
Currently trading at its opening price, traders may expect further increases. The largest cryptocurrency may surge above $96k if the recovery continues. However, indicators like MACD and RSI are negative. The moving average convergence divergence continues downward after its bearish interception a few days ago. It risks retesting the $88k support.
ETH/USD
Ethereum saw a notable buyback after its latest dip below $3k. As selling pressure mounted, it lost the $3,200 support and continued downward until it rebounded at $2,913. Currently trading at $3,129, recovery is underway, and traders look forward to further price increases.
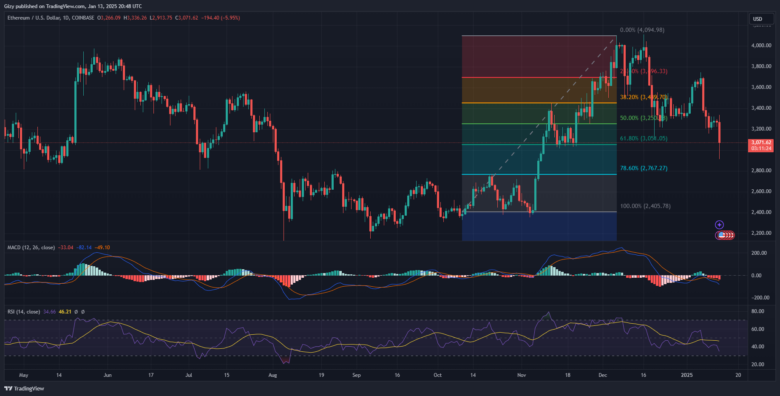
The apex altcoin trades above the 61% Fibonacci retracement level. It may continue upwards from this level, with sight set on the 50% fib level at $3,250. Onchain data supports claims of a trend reversal following the ongoing downtrend.
Investors are moving their assets off exchanges. The amount of ETH they transferred was 50,000 times higher than the previous day’s. The massive outflows from these trading platforms suggest renewed confidence in the asset’s long-term prospects.
However, indicators on the one-day chart print bearish signals amidst the ongoing buyback. The moving average convergence divergence continues downward after its bearish interception a few days ago. ETH risks retesting the $2,700 support.
SOL/USD
Solana sees a similar price movement to that of ETH. It opened the day at $188 but retraced following rejections at $191. The coin failed to break its four-day trend and retraced, breaking the $170 barrier before rebounding at $169.
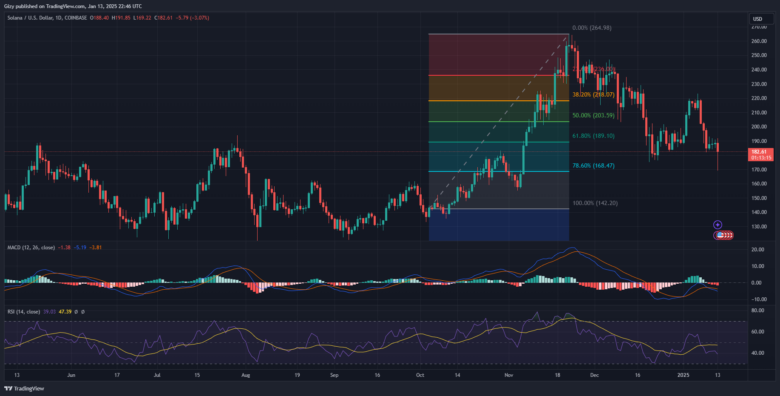
SOL trades at $182 at the time of writing, indicating that buyback is underway. The asset is at the critical support it held over the last four days. Nonetheless, its latest rebound from the 78% fib level may indicate an impending trend reversal.
However, MACD hints at the opposite. The metric displayed a bearish divergence a few days ago. The 12-day EMA continues its descent as selling continues. RSI is on a downtrend in response to the ongoing price trend. It dropped below 40 a few hours ago. Previous movements suggest that Solana is at a crossroads. It rebound or continue downward.
The altcoin will retest $170 if it continues downhill. However, a change in price trajectory may result in a breakout from its four-day trend.
ENA/USD
Ethena’s price actions follow that of ETH. It sees a similar movement, surging slightly higher than its opening price and retracing to levels it hasn’t visited since November. It started Monday at $0.87 and briefly broke above $0.90. The cryptocurrency faced massive rejections, resulting in its retracement below $0.80 support.
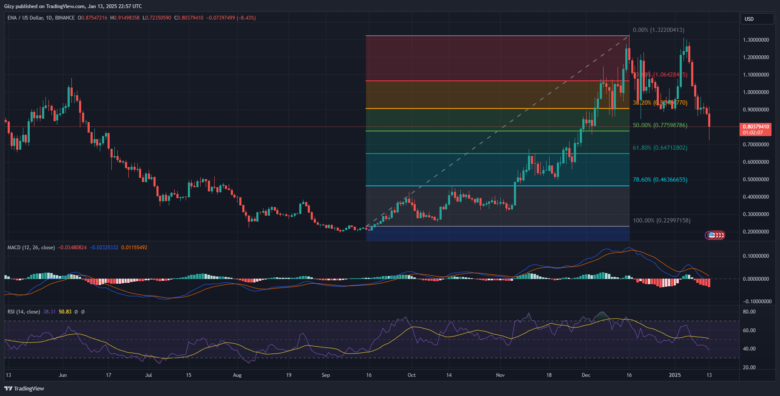
ENA dipped to $0.72 before rebounding. It trades at $0.80 at the time of writing, hinting at the bulls seizing control. It also trades above its 50% Fibonacci level, a level known for its demand concentration. The altcoin may surge upward after its latest dip. It will look to break above the 38% fib level at $0.905 before the weekends.
On the other hand, the relative strength index is fast approaching 30 and may be oversold. The moving average convergence divergence prints sell signals. If the downtrend continues, Ethena may retest its current low.
WLD/USD
WLD marks its second consecutive day of notable price declines. It opened the day at $2.14 but retraced following rejections at $2.20. The asset failed to break its four-day trend and retraced, breaking the $2 barrier before rebounding at $1.84.
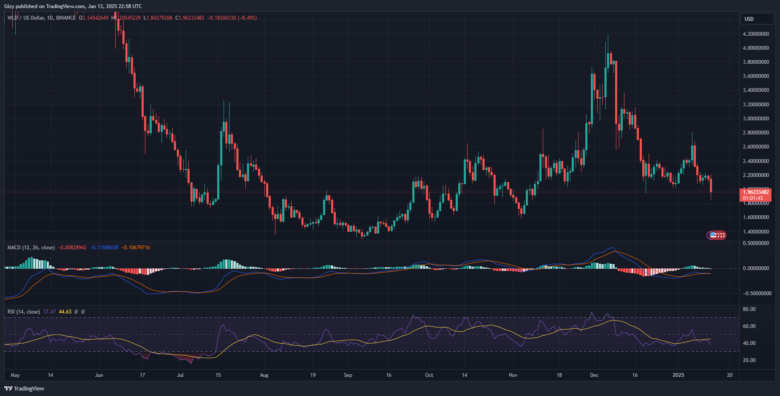
Worldcoin currently trades at $1.96, indicating a slight recovery. Its latest rebound from the 100% Fib level may indicate an an impending trend reversal. If the upticks resume, it will look to break above the 78% Fib level at $2.25.
On the other hand, the moving average convergence divergence prints sell signals. The metric displays an ongoing bearish divergence. WLD may retest $1.60 if the downtrend continues.
Find Cryptocurrencies to Watch and Read Crypto News on the Go Follow CryptosToWatch on X (Twitter) Now

