ETH continues its advances amidst the ongoing stagnant price trend across several cryptocurrencies. The altcoin will look to close with significant gains, will it?
Nonetheless, altcoins joined ETH in its bullish bid, and MKR is a contender for top gainers. It opened trading at $1,156 but surged after a small decline. The massive spike in buying pressure sent prices higher, and the asset broke above $1,250, peaking at $1,269. Although it sees slight corrections, it is up by over 8%.
Another on the list is LINK. Despite its utility, some traders made fun of the coin, seeing very little volatility compared to memecoins. Price actions over the last three days show that the bulls are waking up. The coin surged from $11.8 to a high of $12.3 but retraced due to small rejections. Currently up by over 3%, this will mark its third consecutive day of consistent increases.
The global cryptocurrency market cap is down by over a few percent, having slipped to a low of $2.42 trillion, and trading volume dropped by over 22% in the last 24 hours. Let’s see how some assets performed this week.
BTC/USD
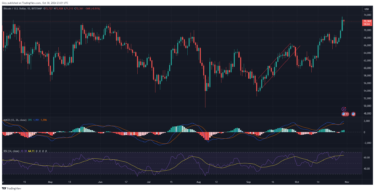
Bitcoin maintains its $72k support despite several slips below it over the last 24 hours. The bulls rallied the coin after it dropped to a low of $71,313. Nonetheless, it prints a red candle, meaning it had small losses during this period.

The latest price actions come after the apex coin edged closer to breaking its all-time high. BTC started the previous intraday session at $69,900 and surged to a high of $73,600, barely $200 away from a fresh ATH. Indicators reacted to those trading actions and hints at the reason for the ongoing price struggles.
The relative strength index broke above 70 from 65 a few days ago. Trending above 70 meant that Bitcoin was overbought and due for corrections. The ensuing declines are an apparent reason for the drop. Although at $72k, the metric barely reacted, dropping to 69 at the time of writing.
The Bollinger bands mirror the same sentiment as the previously highlighted metric. During the previous intraday session, BTC surged above the upper band and closed trading above it. The slight decline saw it drop between the middle and upper bands. However, a small hike at this level will result in another breakout.
Price movement suggests that the bulls are prepping the $72k as critical support in their bid at a new ATH. Nonetheless, the apex coin’s most robust positive barrier is $68k. Failure to defend $70k will guarantee such a slip.
ETH/USD
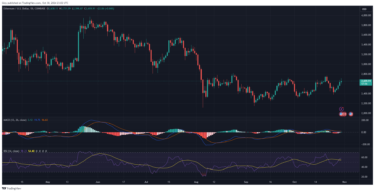
ETH is printing a green candle amidst the growing crypto market selloff. It opened the day at $2,638 but slightly dipped to a low of $2,598 before rebounding and breaking above the $2,700 barrier. Currently trading at $2,656, the altcoin may close the day with no significant price changes.

Nonetheless, the accumulation and distribution charts point to the reason for the ongoing struggles. The market is declining as selling volume exceeds buying volume, resulting in the bulls’ inability to maintain the surge to the high. The RSI mirrors this trend as it slows its ascent due to the growing selling pressure.
The moving average convergence divergence prints positive signals amidst the fears of rising selling volume. The 12-day EMA intercepted the 26-day EMA, completing its bullish convergence. The divergence is underway which may spell further increases for the asset.
ETH will look to continue the surge, and the Bollinger bands show a small room for further uptrend. The upper band sits at $2,744, and a breakout may signal the end of the uphill movement. It has since climbed closer to breaking above the market since it almost retested the lower SMA last week. The previous day’s 3% increase saw the asset edge closer to this bid.
BNB/USD
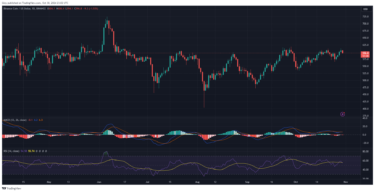
Binance coin is printing a red candle at the time of writing as trading conditions favor the bears, who staged minor selling congestion. It lost $600 in support and dropped to a low of $594 but now trades at $597, indicating an almost 2% drop.

Indicators are responding to the ongoing selloffs. MACD shows an indecisive interception. The 12-day EMA intercepted the 26-day EMA during the previous intraday session, and a divergence was soon to follow during the current session. However, the histogram associated with the metric displays a barely visible bar, as the ongoing trend may cause a reversal.
The relative strength index shows the asset succumbing to the growing bearish sentiment as it declines. Currently at 55, the A/D mirrors its movement, dropping as supply increases and the buyers are unable to fully absorb it.
The Bollinger bands show that BNB briefly surged above the upper band during the previous intraday session. The slight decline saw it drop between the middle and upper band. However, a small hike at this level will result in another breakout.
The altcoin is exchanging close to its $590 support, and the bulls must defend the mark, as a slip may send it below $580.
SOL/USD
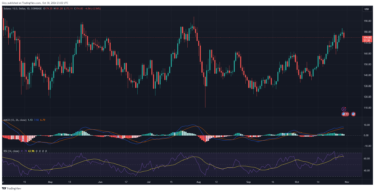
Almost all indicators associated with Solana are negative at the time of writing. The reading comes as it dropped from a high of $181 to $173. Although it rebounded, it is down by almost 3% over the last 24 hours.

The moving average convergence divergence prints a sell signal at the time of writing. The 12-day EMA arches downward as it starts what may become a bearish convergence. If the downtrend continues, it may intercept the 26-day EMA in the coming days. This mirrors the movement of the relative strength index, which dropped from 66 to 61.
The Bollinger band shows that the altcoin still has room for small surges. However, it retraced following its close interaction with the upper band the previous day, which also explains the reason for the ongoing declines.
The accumulation and distribution chart shows that the bulls may be exhausted following the previous four-day uptrend.

