
ETH has been almost stagnant since Monday’s price action. During this period, the trend was a small hike or decline, ending with a return to its opening price.
Nonetheless, other altcoins registered notable price changes over the last five days. One such is Dogecoin. It is currently up by over 27% on the weekly scale. It has not printed any red candles since the week started and may close with this trend.
Other memecoins like BONK and FLOKI are currently bullish, printing over 10% of gains during the period under review.
The crypto market has been largely bullish, as the global market cap is up by over 5% this week. Valuations stabled around $2.35 trillion as several cryptocurrencies surged. Let’s see how some in the top 10 performed.
BTC/USD
Bitcoin is printing a red candle at the time of writing as the bulls take a break from the uptrend. Although not the first red of the week, prices may drop below $68k if it continues. Nonetheless, the slight decline did not notably impact its performance on the weekly scale. It is up by over 8%, the highest one-week gain since August.
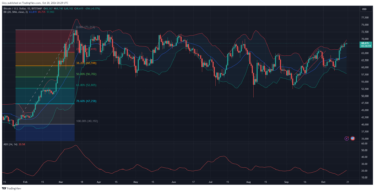
BTC had an excellent start to the session, experiencing massive increases on Monday. It opened trading at $62,850 but experienced an enormous increase in buying pressure. It surged, crashing through the $64k and then $66k barrier. However, its bid at $67k yielded no result, as it faced strong rejections around $66,400.
It continued seeing slight uptrends over the next day as the bulls halted a decline to $65k and pushed prices closer to $68k. The next day, BTC finally broke the mark but failed to sustain the momentum. It continued upwards on Friday as it sparked hopes of a return to $70k but faced solid resistance at $69k.
The Bollinger bands provide some insight into why the latest price decline occurred. Following the price surges, the apex coin broke above the upper SMA on Tuesday. It continued slipping out of bounds, indicating that the run may end.
Other indicators, like the relative strength index, show the bulls struggling to regain control of the market. Although the metric saw slight declines in the last 48 hours, prices remained relatively stable. The same trend is present in the accumulation and distribution chart. There has been no significant difference in the pressure from buyers and sellers.
Nonetheless, the average direction index shows the bulls edging as it continue its surge.
ETH/USD
Ethereum is heading for another bullish close following the previous week’s performance. Nonetheless, this is the best week since the month started, as the altcoin is up by over 6%. A closer look at the daily chart shows that most increases happened on Monday.
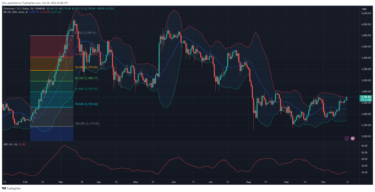
The asset opened the first day of trading at $2,467 but had a spike in buying pressure, resulting in a massive price uptick. It flipped the $2,600 barrier but gradually lost momentum as it edged closer to $2,700. Facing strong rejections at $2,657, it closed slightly lower but registered gains exceeding 6%.
The next day, the uptrend continued but failed to break above the highlighted level due to solid resistance at $2,687. The bears staged a selloff at the peak, as some took profit. The apex altcoin lost the $2,600 support and hit a low of $2,536 before rebounding and closing at its opening price.
ETH has since failed to break out from $2,680 due to little volatility. Nonetheless, the relative strength index has been relatively stable due to an almost equal push from the bulls and bears. The A/D chart also suggests decent buying and selling volume.
Nonetheless, the average direction index is still on the uptrend, and the Bollinger bands show room for more surges.
BNB/USD
Binance coin is up by almost 4% on the weekly scale. Although the coin saw little volatility for most of the week, it exploded on the first day. However, it failed to continue the trend, resulting in its trading within a channel.
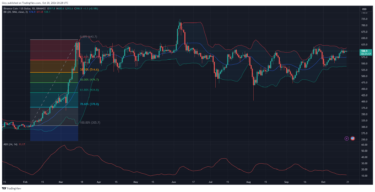
Monday kicked off with the asset at $572. It experienced a spike in buying volume, resulting in a significant price climb. It edged close to $600 but faced massive rejections at $592—the day ended with slight losses but a close with gains of almost 3%.
The uptrend continued on Tuesday as the bulls attempted a buyback after BNB declined to $580. The bullish actions yielded results, as the altcoin surged and retested $600. However, it gradually lost momentum, retracing and closing at its opening price.
The last few days of the week saw the range with no significant impact on price. Nonetheless, the Bollinger showed the bulls edging in terms of dominance. The asset continued trading between the upper and middle bands.
MACD is also reasonably silent as the 12-day EMA and 26-day EMA continue upwards. However, a closer look at the 12-day EMA shows a slight change in trajectory. RSI is largely stable as BNB sees mild buying and selling pressure. ADX continues downward as the coin loses momentum.
SOL/USD
Solana had one of its best performances on Monday. It started trading at $147 but experienced a significant explosion in buying volume, resulting in an uptrend. It broke above $150 and continued upwards until it faced strong rejections at $158. It ended the day with gains exceeding 6%.
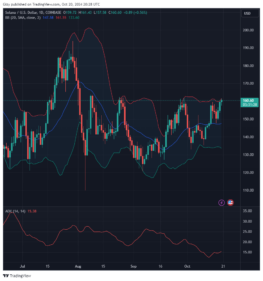
SOL lost momentum the next day after a failed attempt at $160. It soon retraced, hitting a low of $150 before rebounding. The downtrend continued over the next few days as it lost over 4% in three days and hit a low of $147.
The Bollinger bands provide some insight into the reason for the latest price decline. Following the price surges, the altcoin recently broke above the upper SMA, and the ongoing decline is a response to this action.
Nonetheless, the average direction index shows the bulls edging as they continue their surge. The RSI is declining as the asset has seen more selloffs in the last 12 hours.
Find Cryptocurrencies to Watch and Read Crypto News on the Go Follow CryptosToWatch on X (Twitter) Now
